SLA and ROI Widgets
LAST UPDATED: DEC 18, 2024
Overview
Service level agreement (SLA) and return on investment (ROI) widgets provide actionable insights into event detection, resolution efficiency, and automation impact. These widgets aid users in evaluating time and cost savings, optimize workflows, and make data-driven decisions. This article explores SLA and ROI widgets, including their calculation formulas, and presents an appendix that clarifies the field names used across D3 vSOC.
SLA Widgets
Average Detect Time
Tracks the average time to detect events, providing insights into the efficiency of event detection processes by measuring the time elapsed between an event's occurrence and its detection.

Average Resolve Time
Highlights the efficiency of incident response workflows and identifies opportunities for process streamlining by tracking the average time taken to resolve an incident from creation to closure.
%201.png?inst-v=f0ae511a-7398-4e63-b935-74c903306443)
Detect Time By Day
Helps identify daily patterns or anomalies by tracking how detection time for events varies across days, enabling targeted optimizations in detection processes.
%202%20(1).png?inst-v=f0ae511a-7398-4e63-b935-74c903306443)
Event Detect Time By Severity
Offers insights into the efficiency of detecting critical events compared to lower-severity ones, ensuring effective resource allocation, by displaying detection time based on event severity (i.e., Critical, High, Medium, Low).

Mean Time to Detect By Incident Type
Helps highlight detection performance across various incident categories, helping identify areas for improvement, by measuring the average time to detect events associated with specific incident types.

Mean Time to Resolve By Incident Type
Offers insights into which incident categories are resolved efficiently and which need improvements in response times by measuring the average time to resolve incidents of each type.

Mean Time to Resolve By Owner
Evaluates individual or team performance, highlighting strengths and areas for improvement, by providing average resolution times for incidents handled by specific individuals or teams.

Top 10 Average Detect Time By Incident Type
Helps prioritize process improvements by focusing attention on incident types that take longer to detect once the related event has occurred.

ROI Widgets
Total Saved Hours
Quantifies operational efficiency gains by calculating the time saved through automation (use of utility or integration commands), as defined in the ROI settings.

Total Saved Money (USD)
Converts operational time savings into monetary terms, demonstrating the financial impact of automation by calculating savings based on the "Cost saved per command run (dollars)" configured in the ROI settings.

Appendix
EventUTCTime
This is the timestamp indicating when the source system (e.g., Gmail, Splunk) initially created the event. In D3, this field is referred to by different names across the platform:
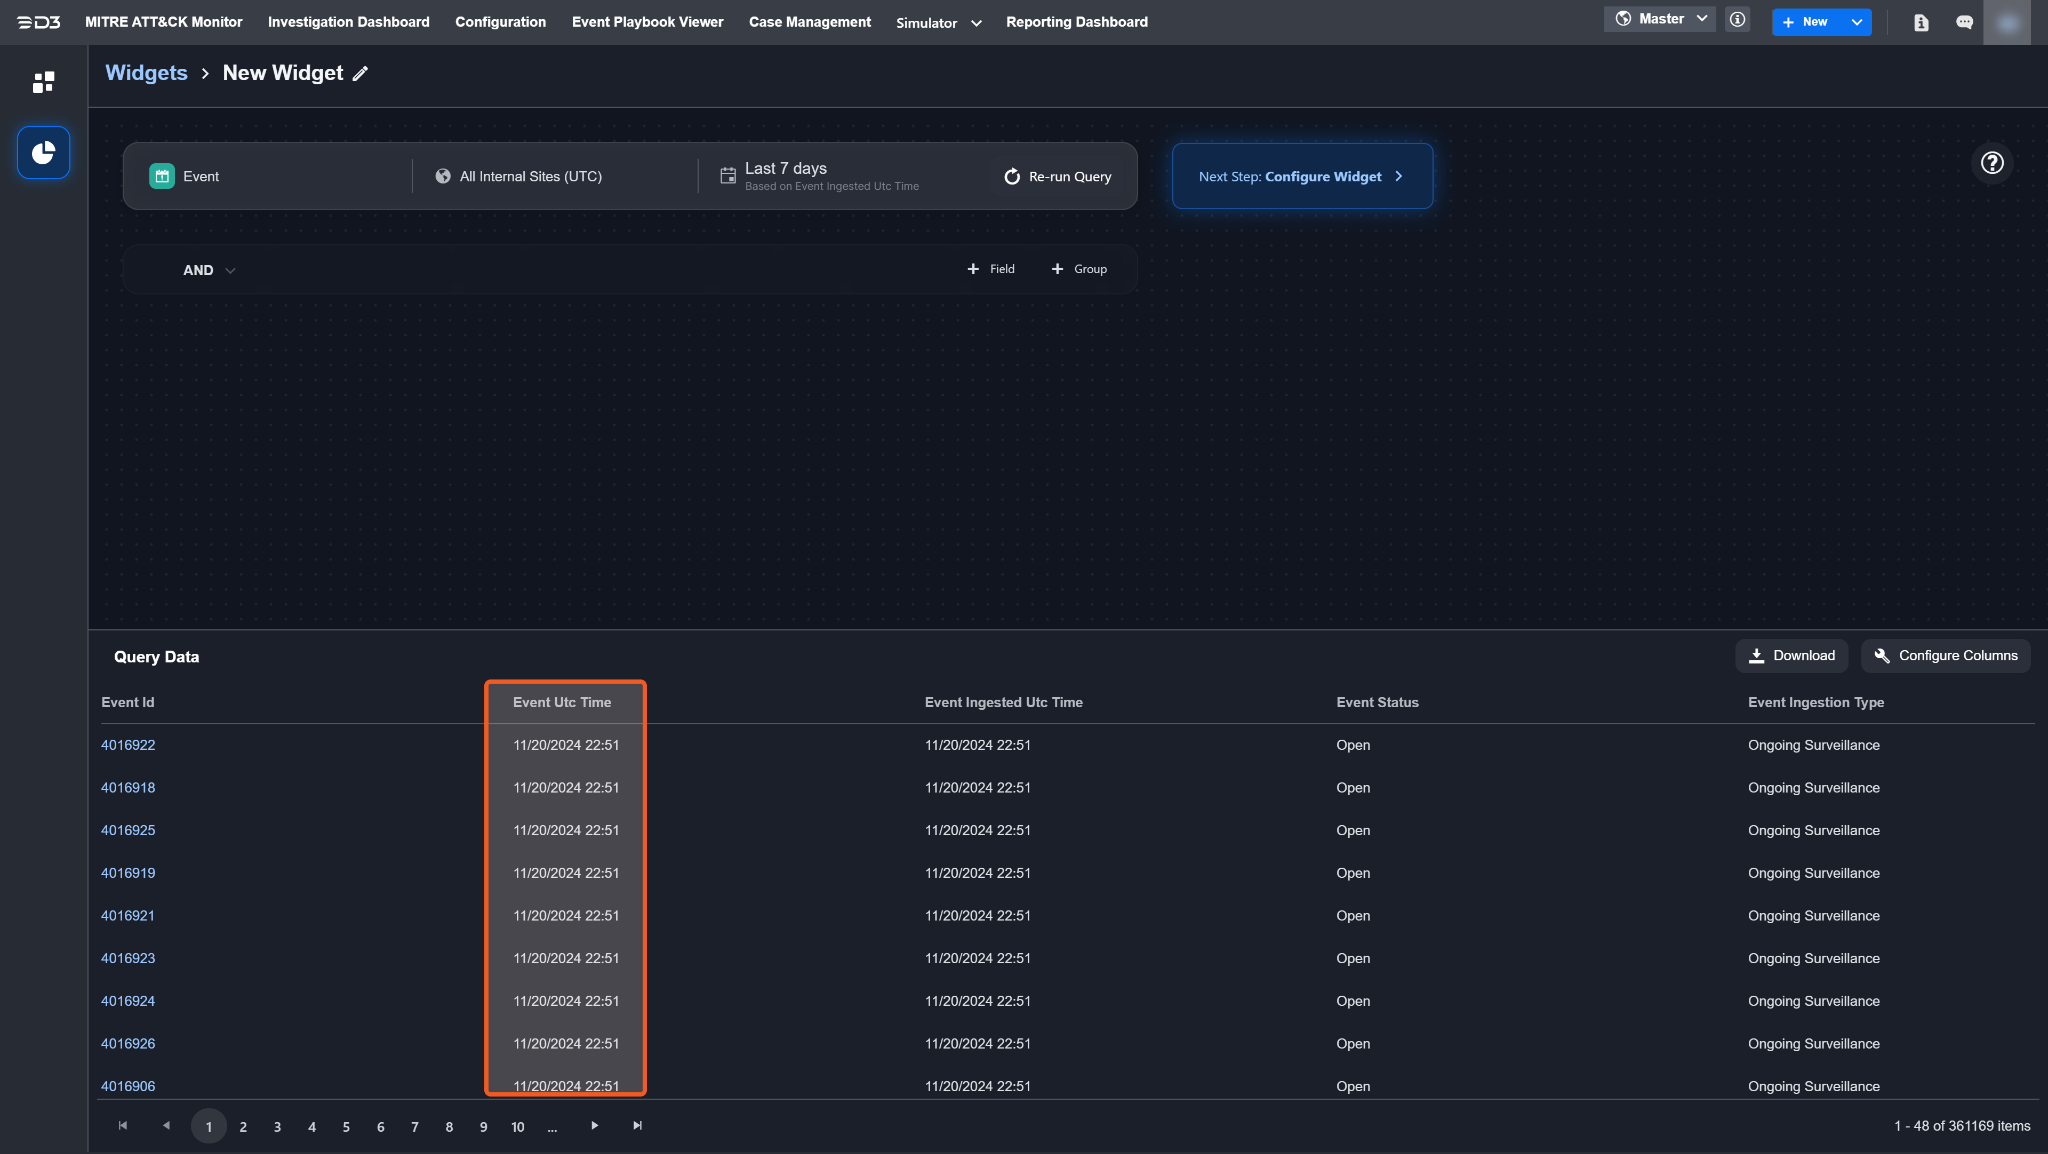
In the resulting table of a query dataset for widget creation, it is called Event Utc Time.
READER NOTE
Click on the ![]() button to configure the table headers if Event UTC Time is not visible.
button to configure the table headers if Event UTC Time is not visible.
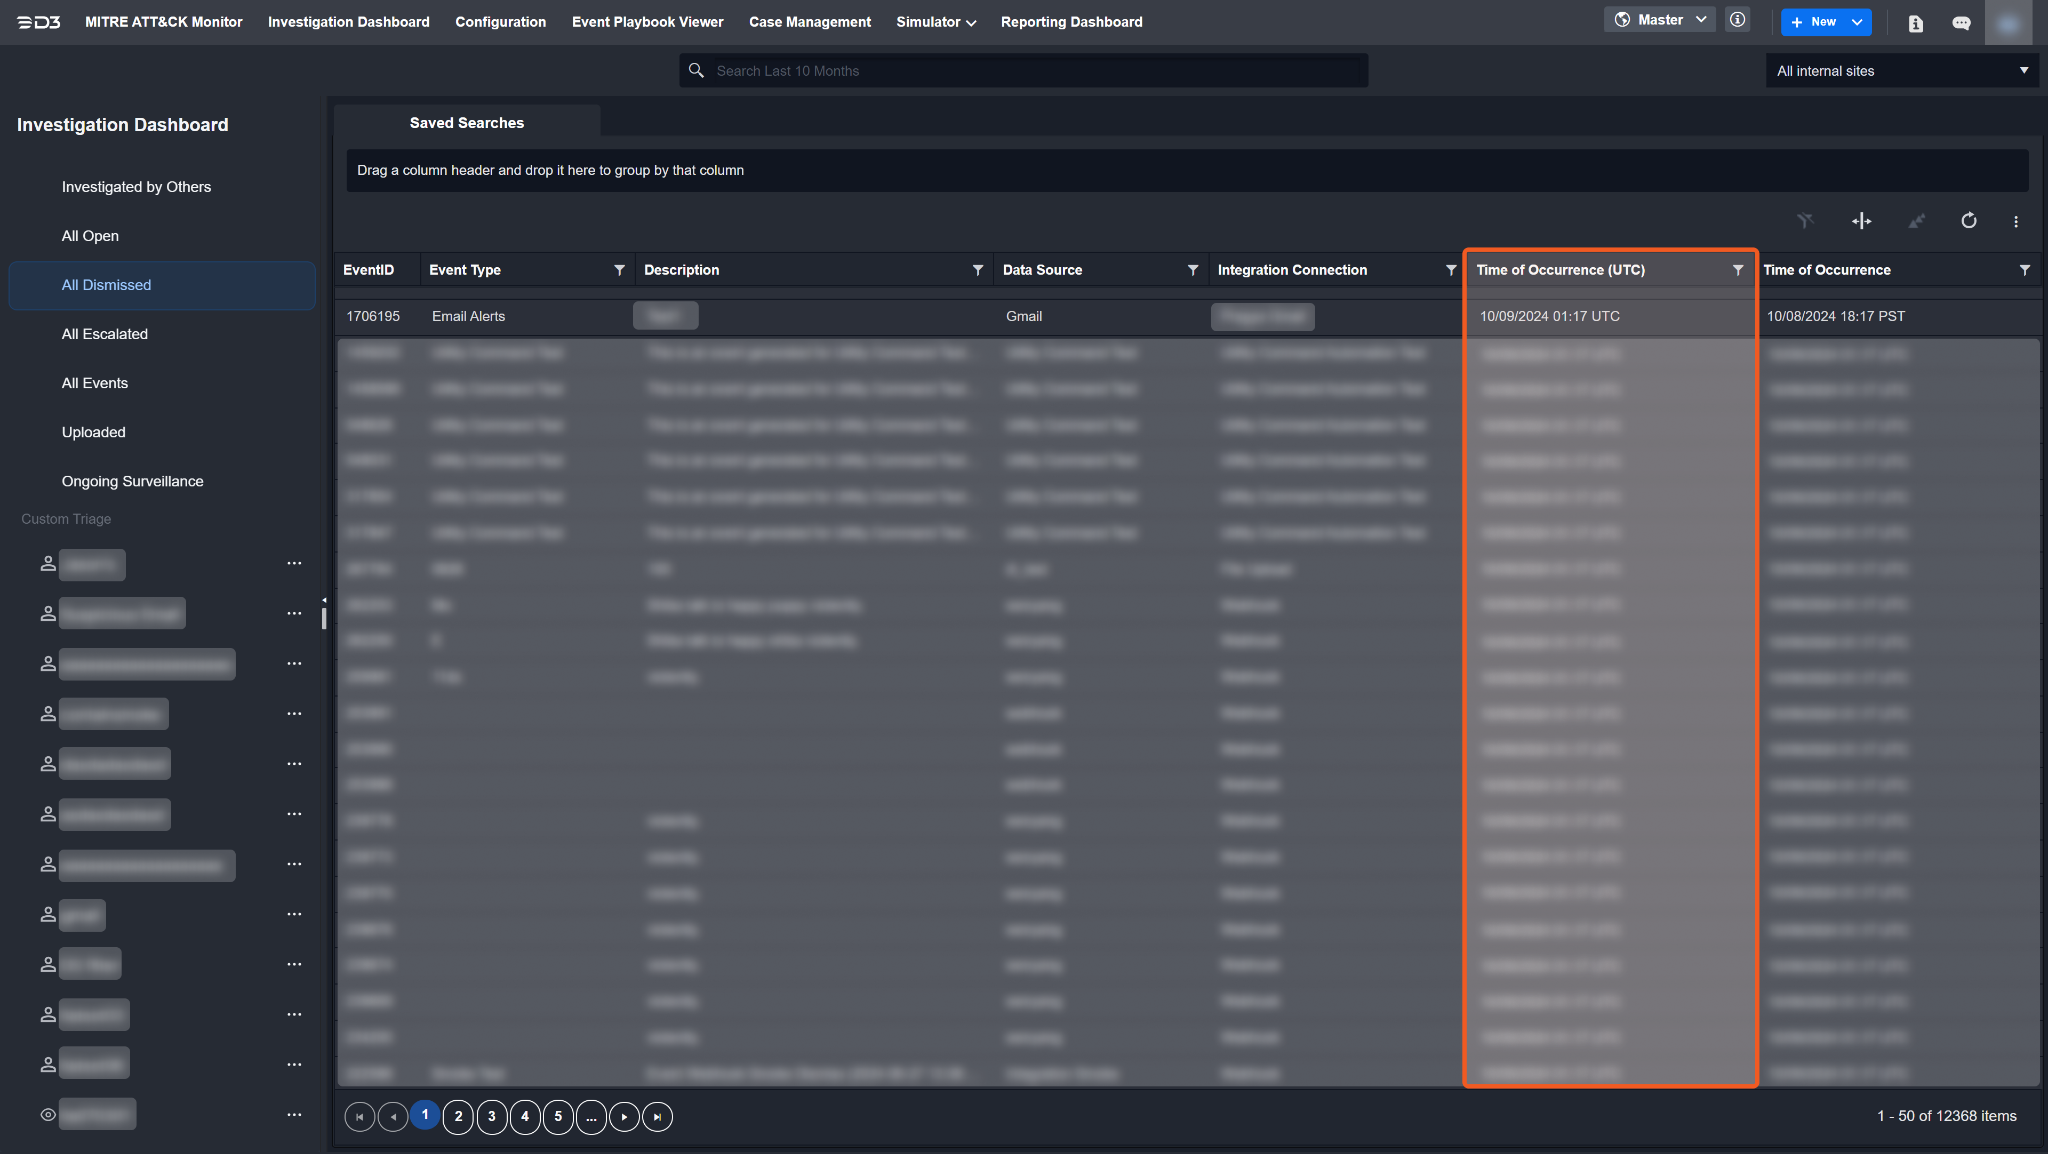
In the Investigation Dashboard > Events table, the same timestamp is referred to as Time of Occurrence (UTC).
READER NOTE
Click on the ![]() button to configure the table headers if Time of Occurrence (UTC) is not visible.
button to configure the table headers if Time of Occurrence (UTC) is not visible.
Within the Event Details popup, the same timestamp is referred to as Start Time (UTC).
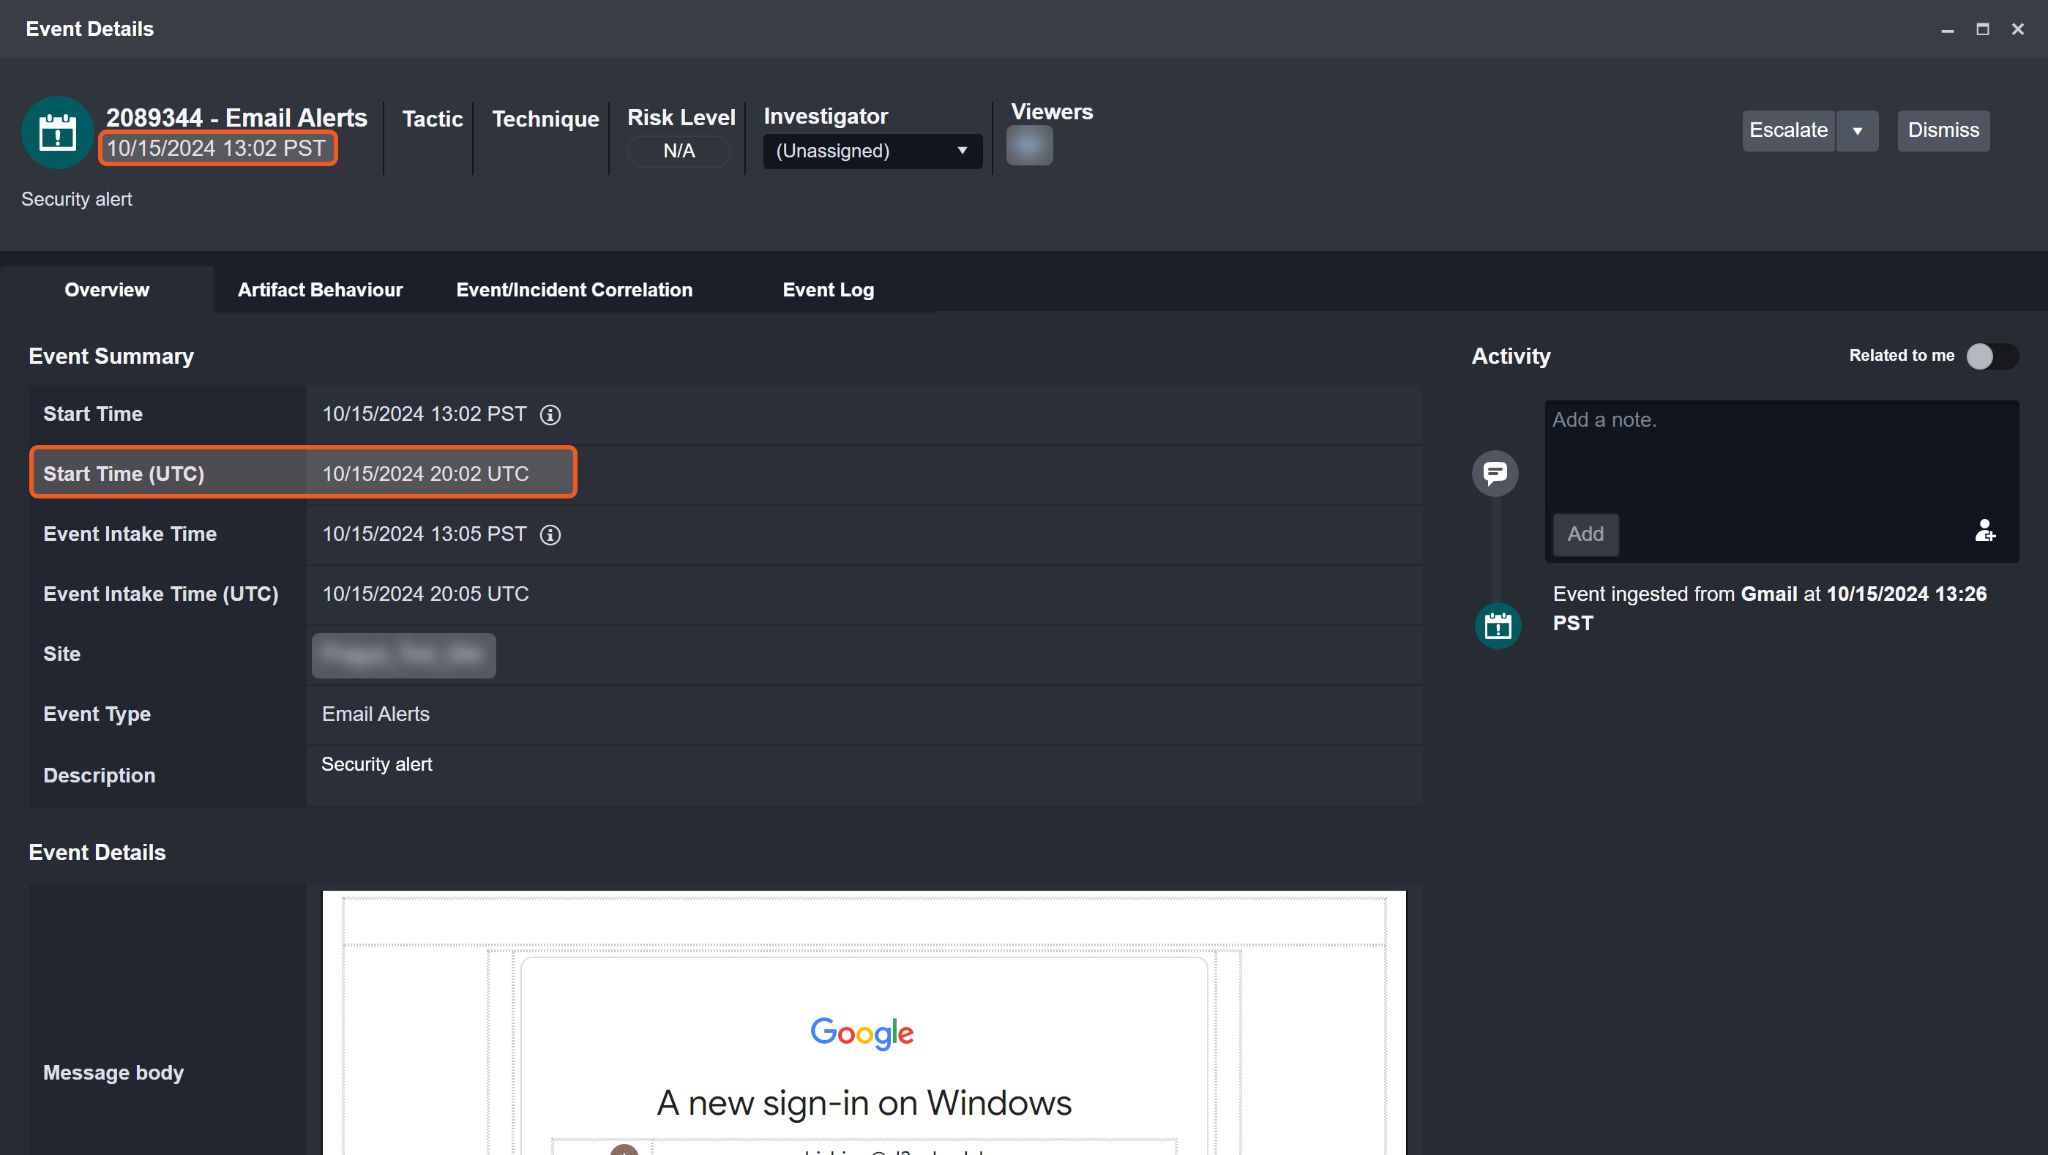
READER NOTE
To populate Start Time (UTC) with the original value from the source system, the Event Field Mapping must map the original event's JSON path value to D3's built-in system field Start Time. This can be found within the Event Field Mapping popup.
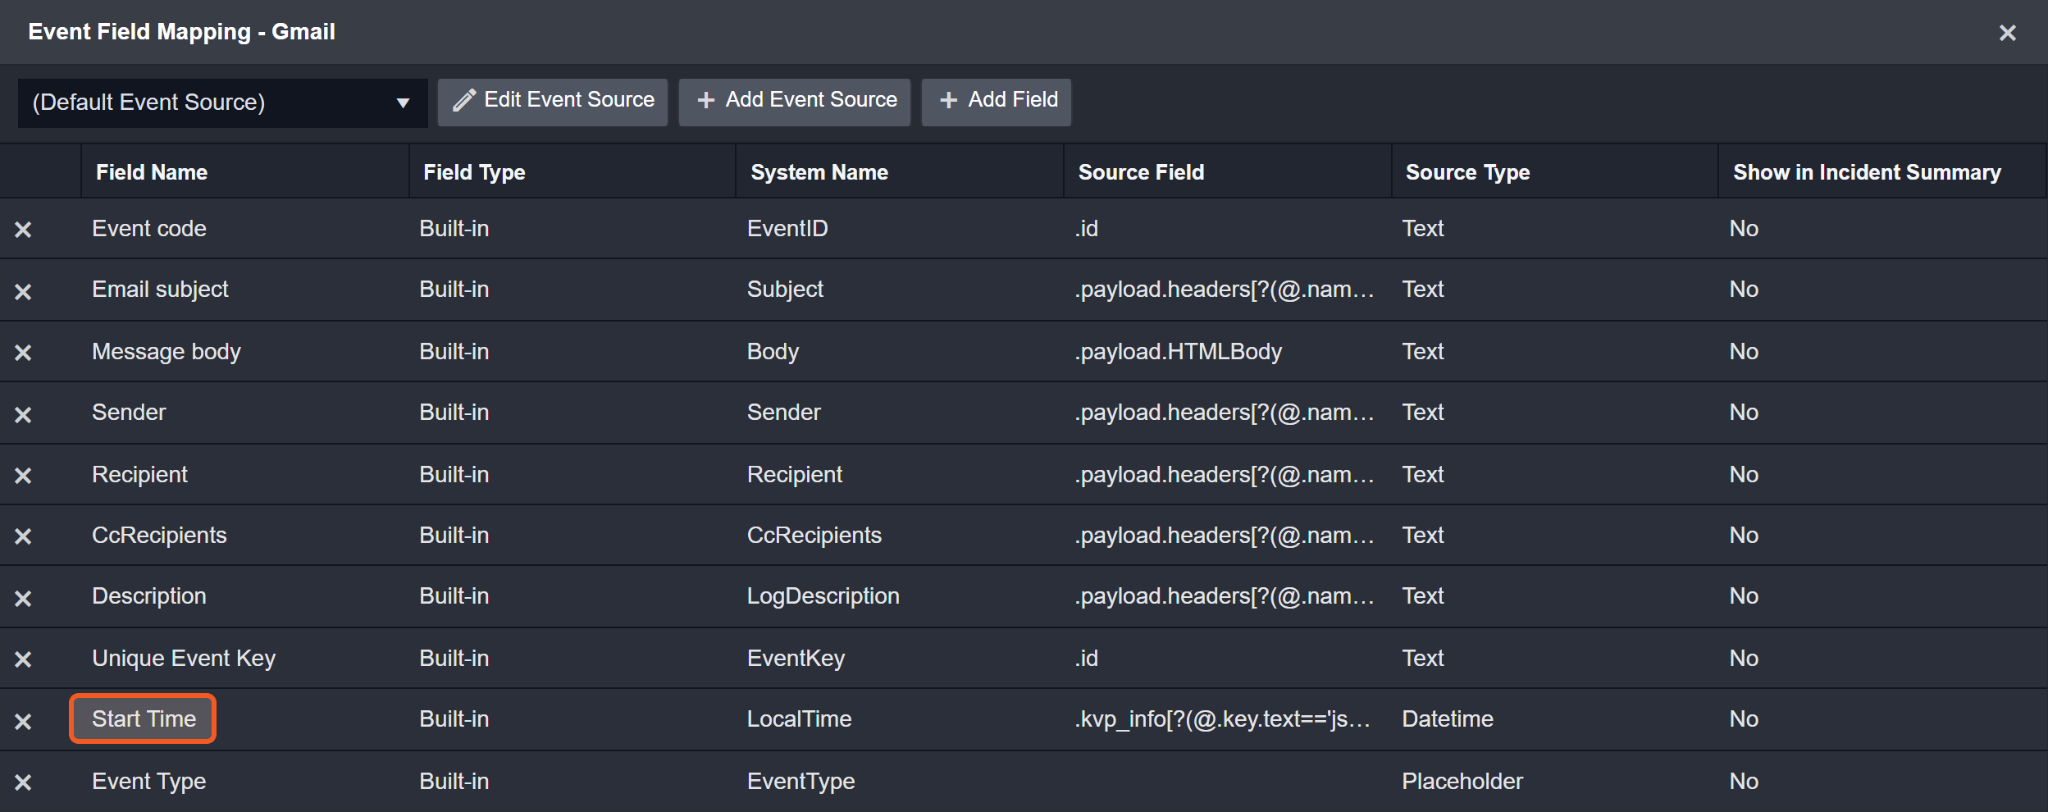
If the original source system does not provide the EventUTCTime field, the D3 system will default to using the IngestedUTCTime.
IngestedUTCTime
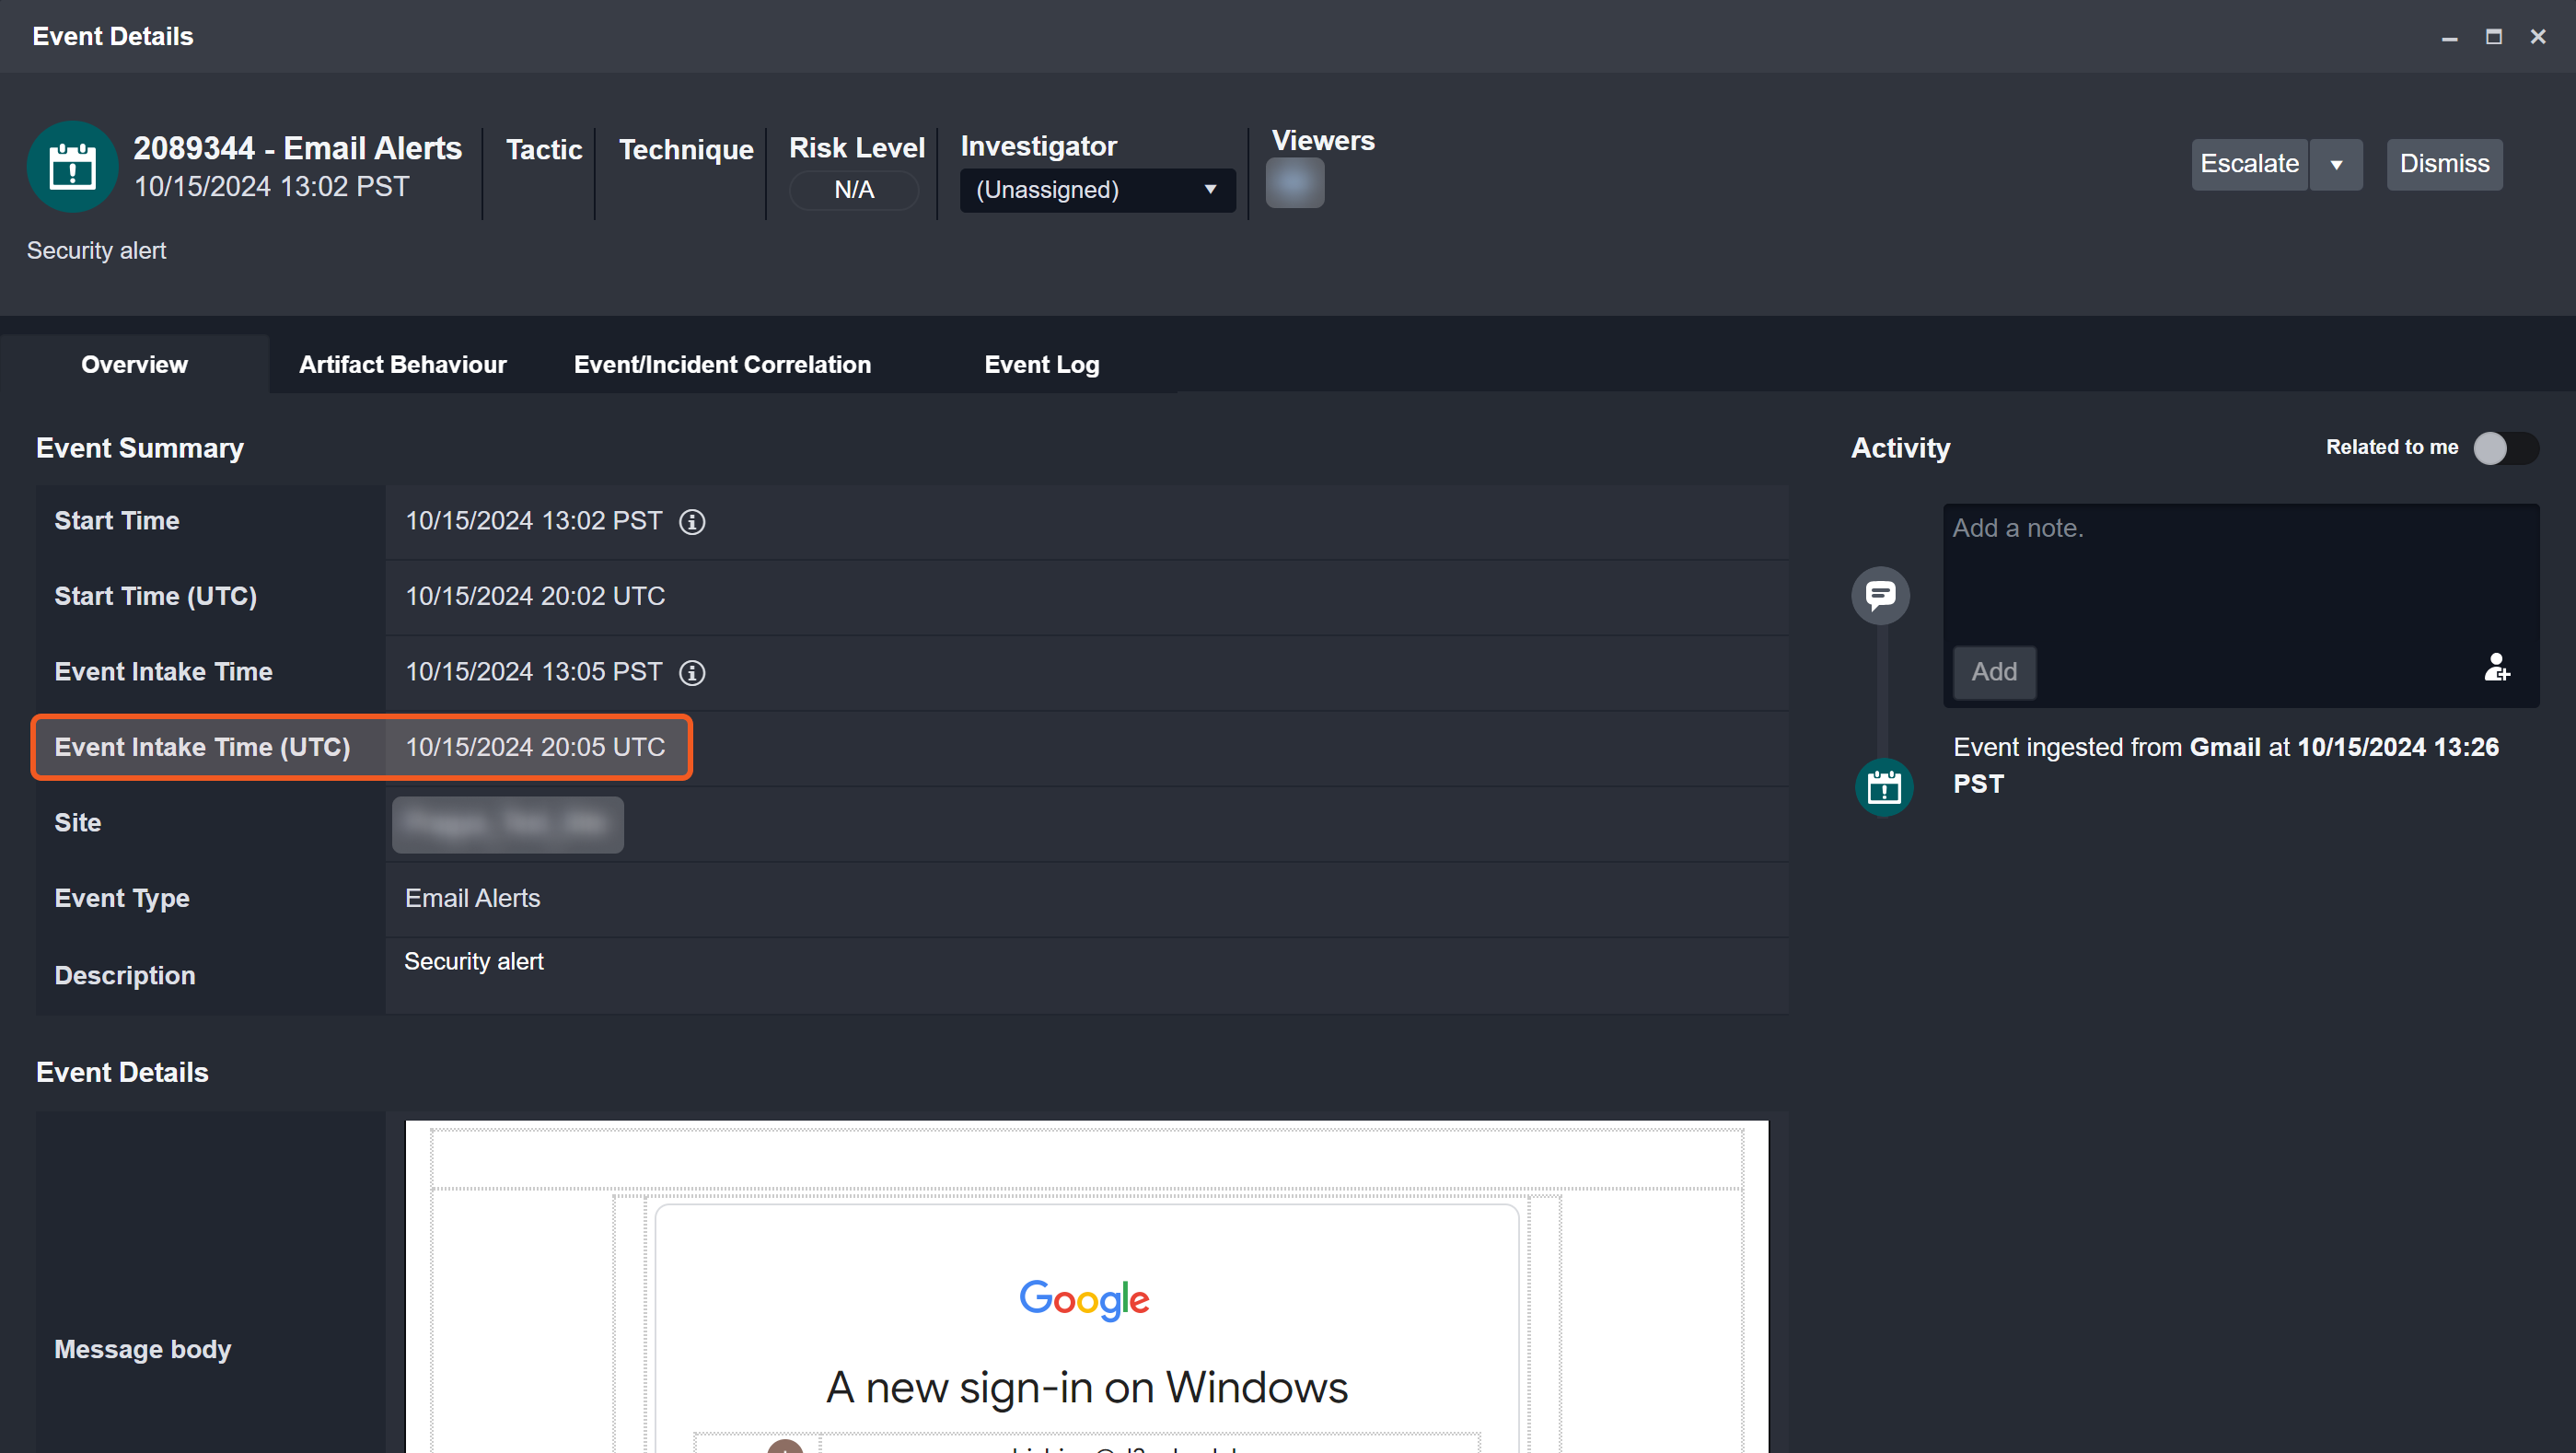
This is the UTC time at which D3 creates the event record. In D3, this field is referred to by different names across the platform:
In the resulting table of a query dataset for widget creation, it is called IngestedUTCTime.
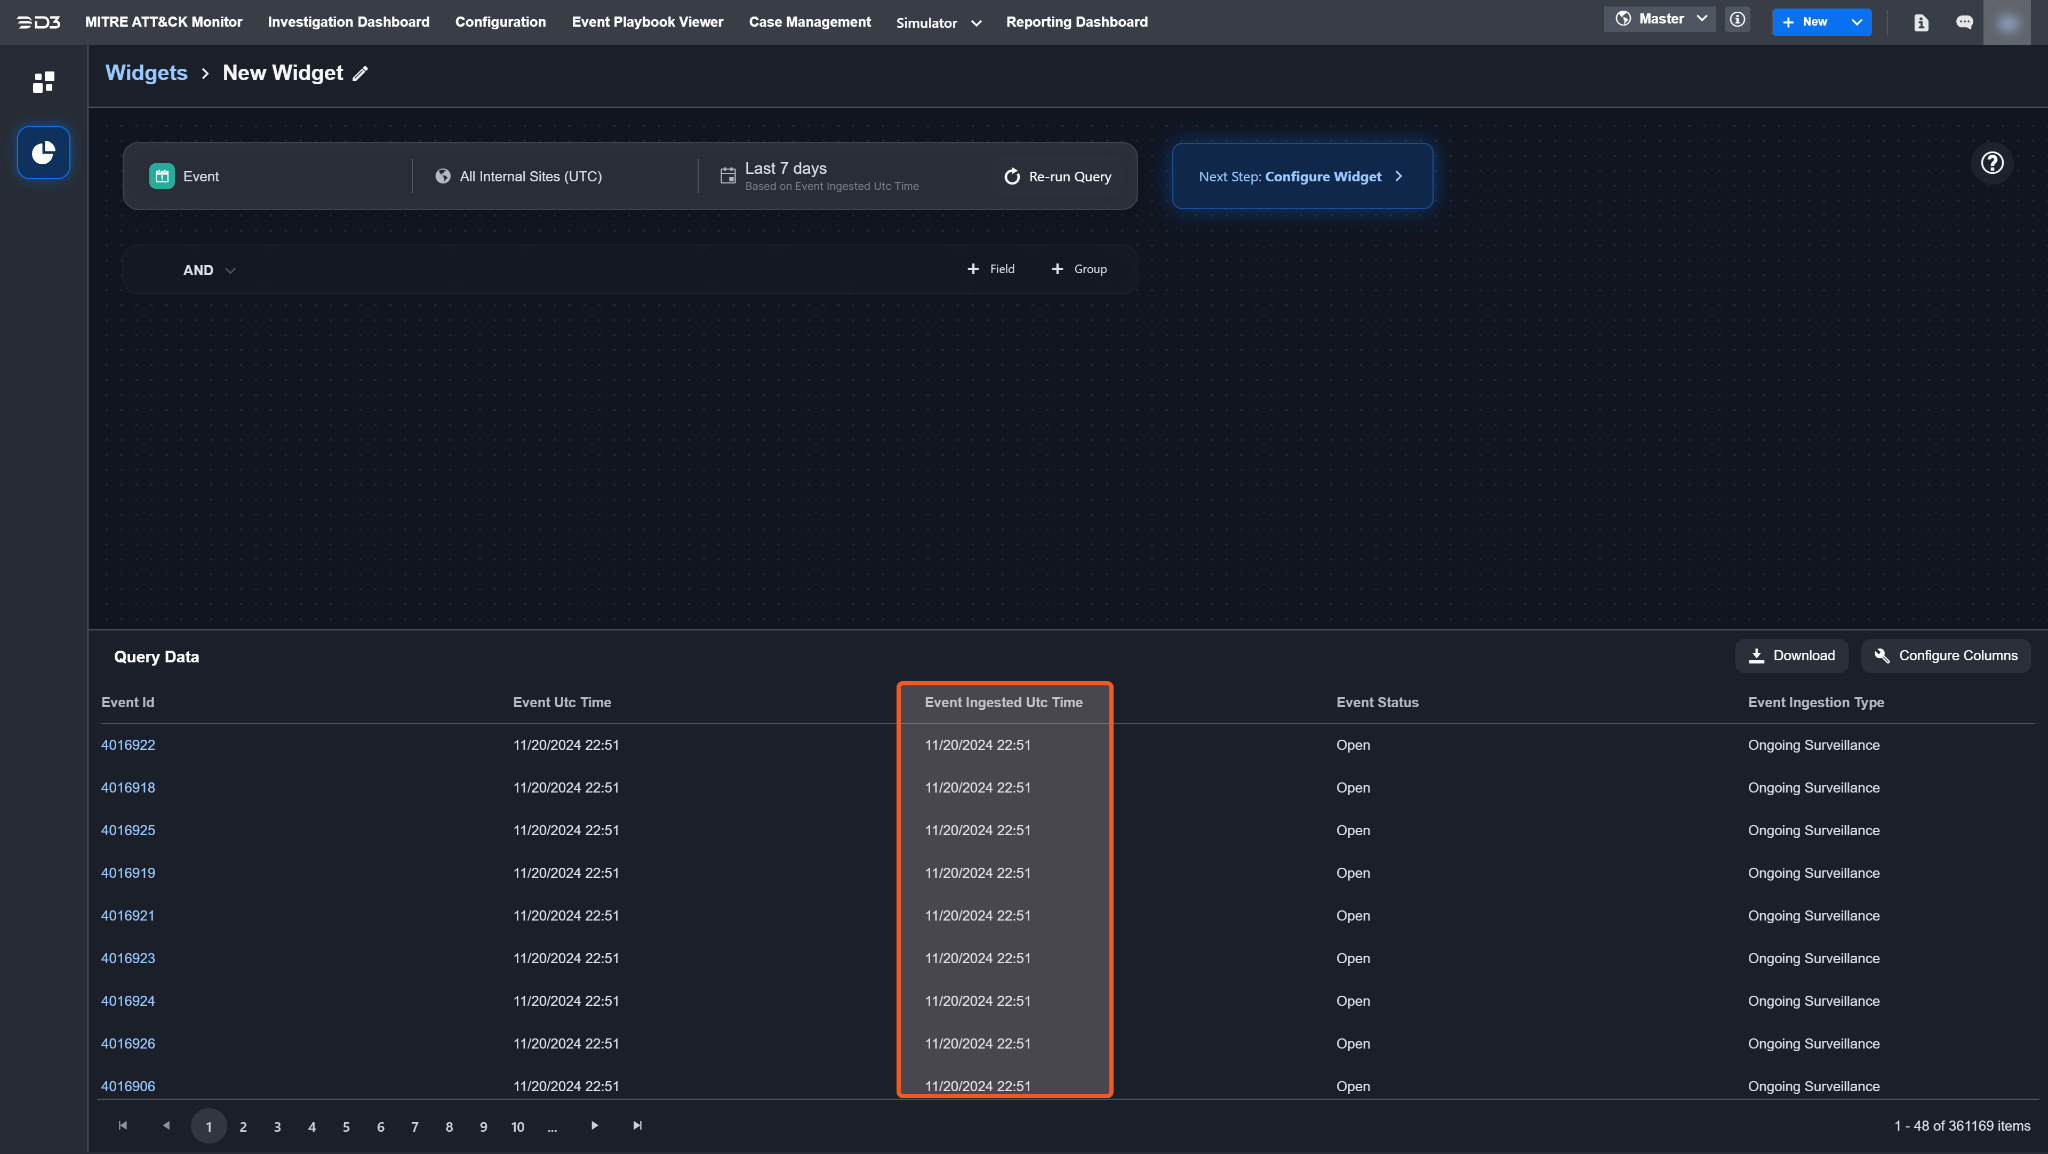
Within the Event Details popup, the same timestamp is referred to as Event Intake Time (UTC).
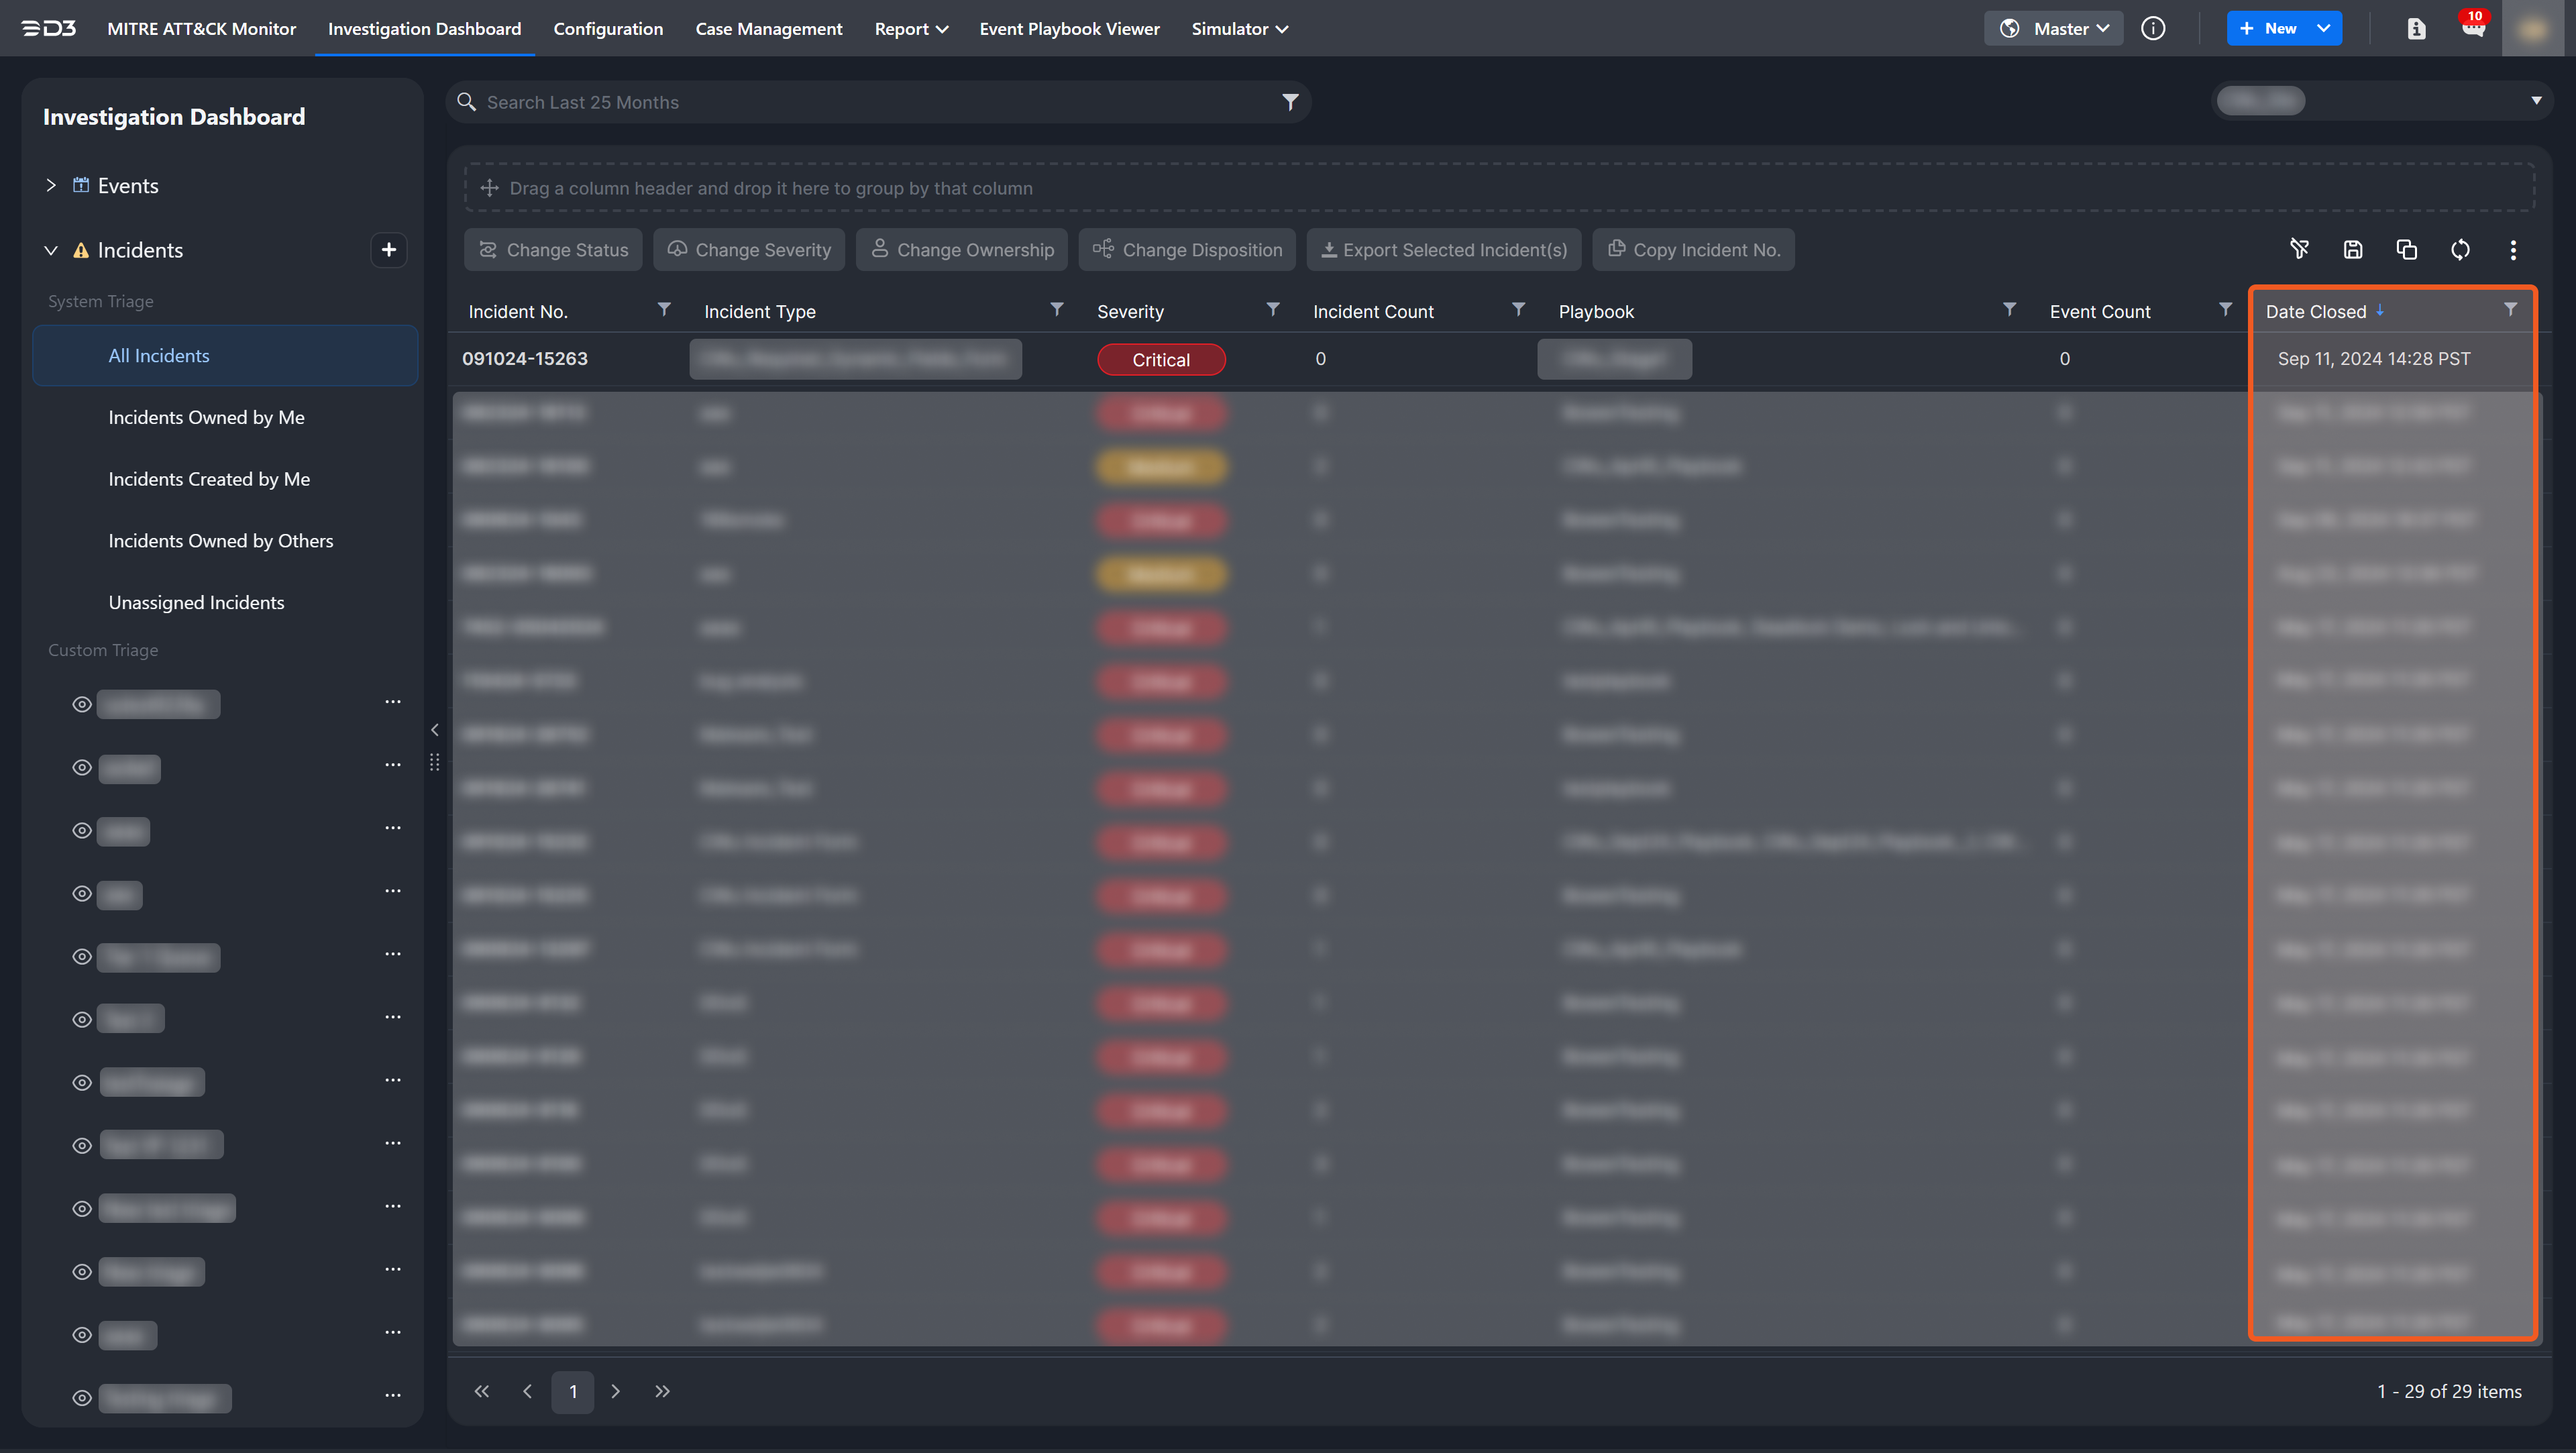
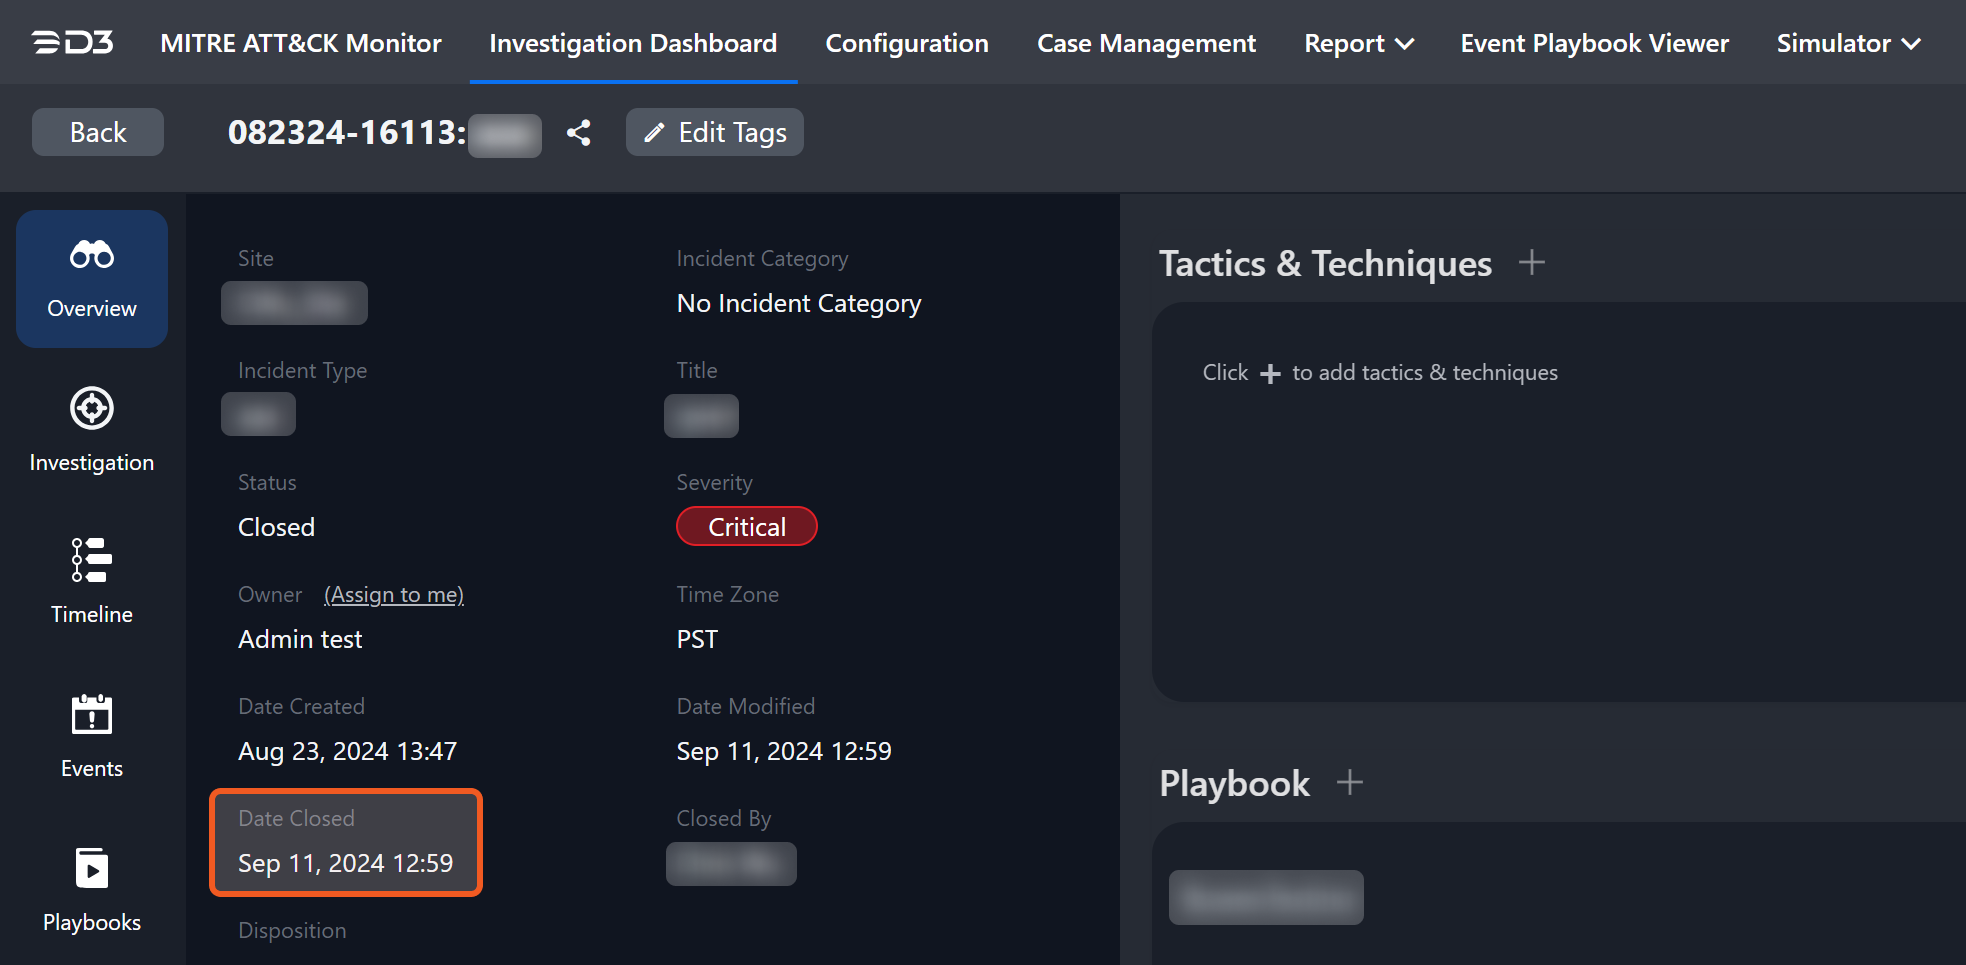
ClosedUTCTime
This is the UTC time at which a D3 incident is closed.
In both the Incident Investigation dashboard and Incident Workspace (Overview), it is referred to as Date Closed.
CreatedUTCTime
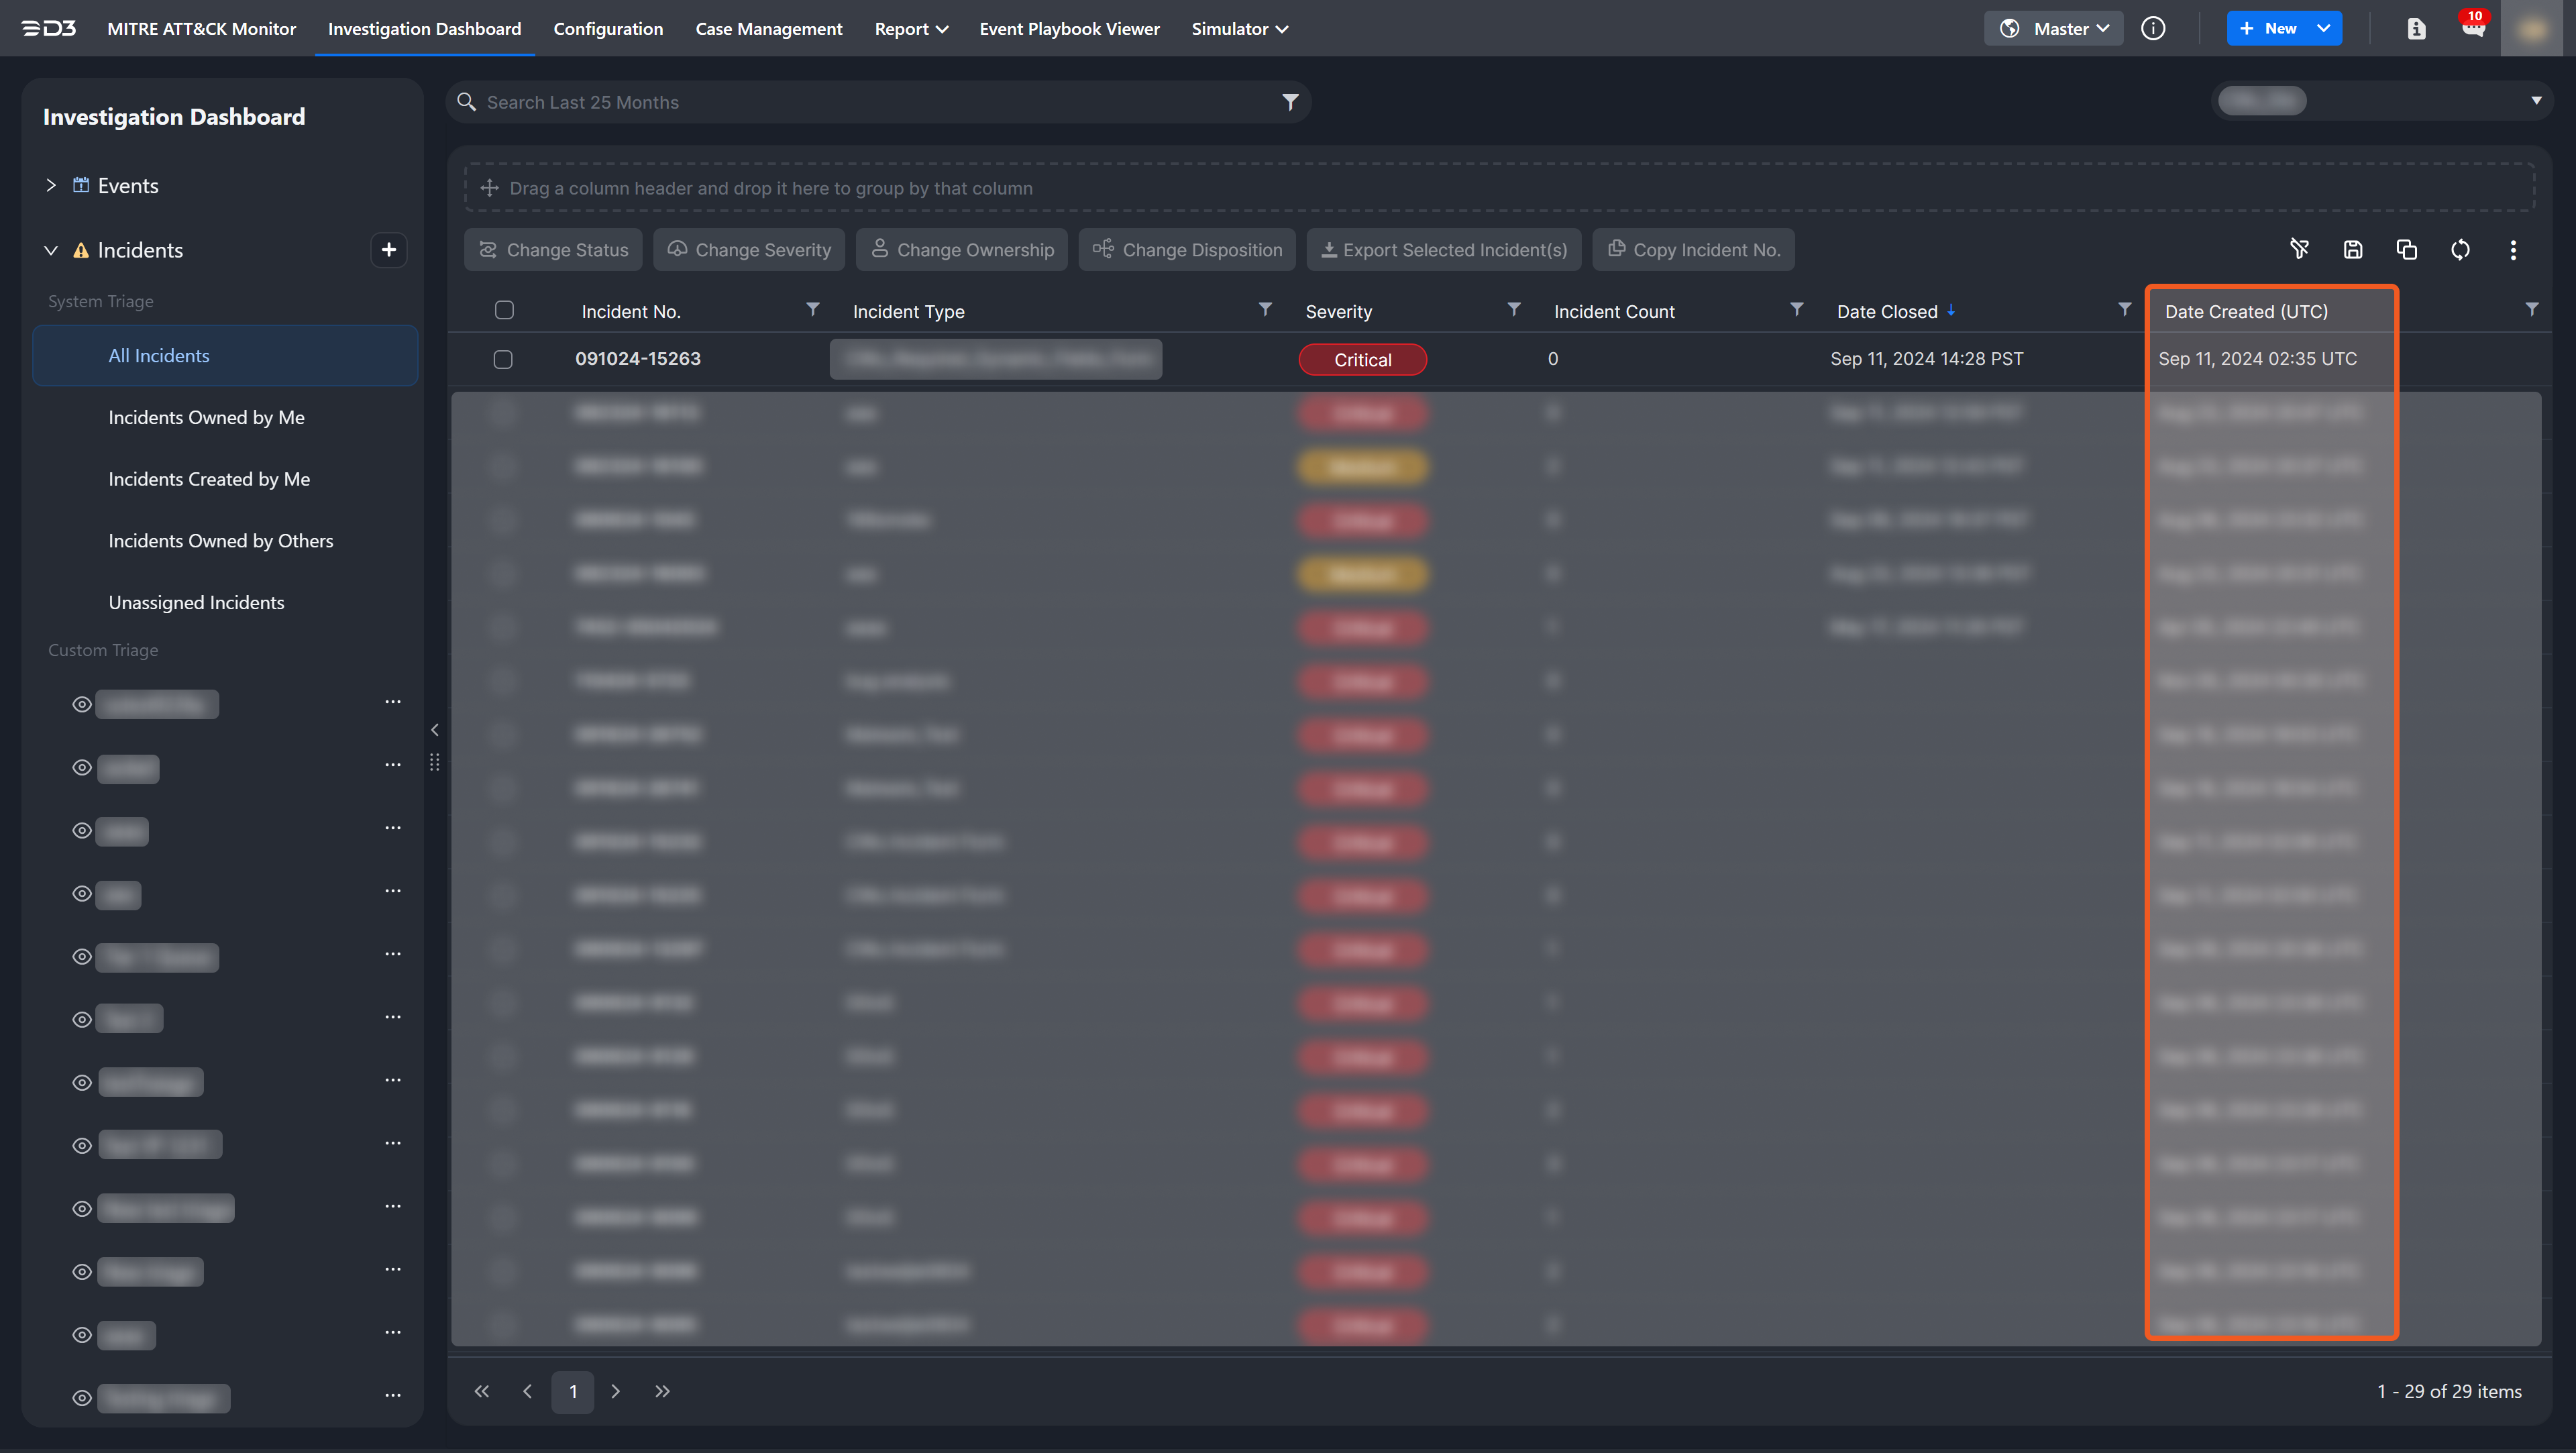
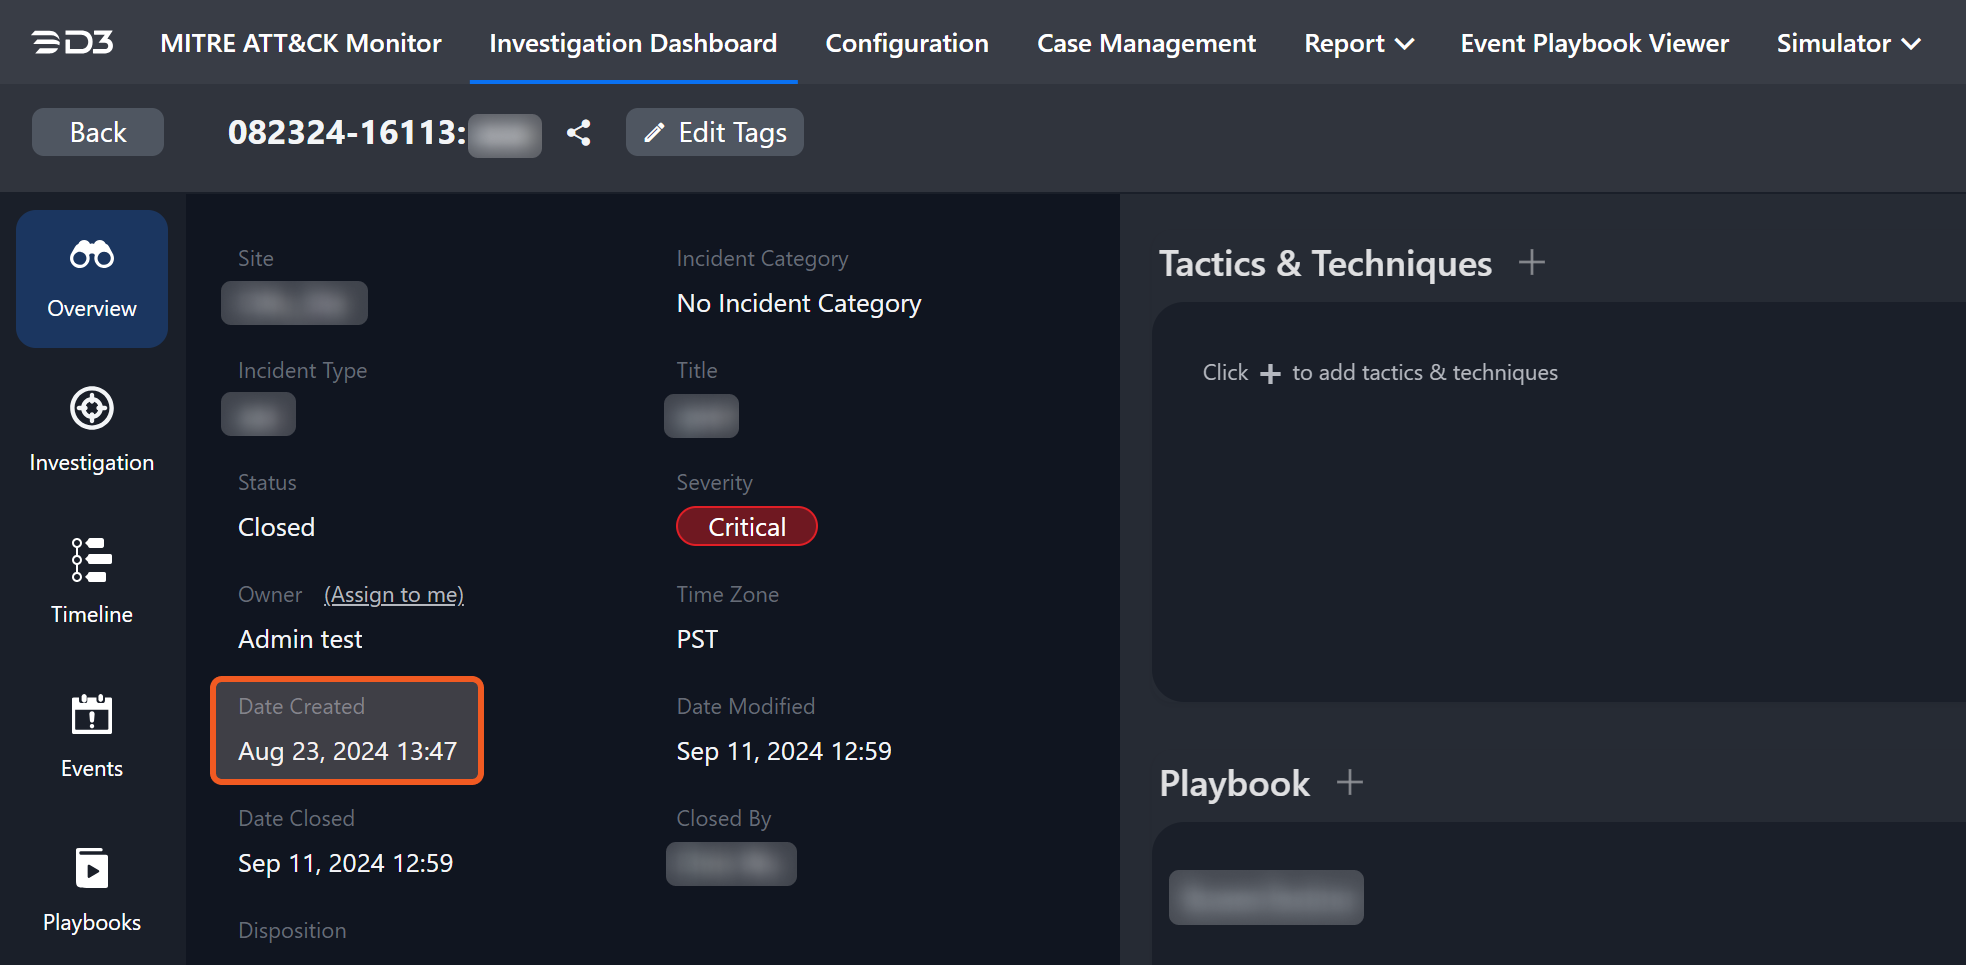
This is the UTC time when a D3 incident is created.
In both the Incident Investigation dashboard and Incident Workspace (Overview), it is referred to as Date Created (UTC).
