.png)
Incident Playbooks
Overview
Incident Playbook is the main Playbook type you will use in the system. SOC Engineers, Senior Analysts and MSSPs can configure workflows for day-to-day operations within the SOAR platform within the Incident Playbook. These Playbooks should be configured to respond to different Incident types, and the complexity of these Playbooks can vary depending on your organization’s needs. In this section, we will outline and explain the unique features of an Incident Playbook.
Life Cycle
The life cycle of the Incident Playbook starts when an Event escalates into an Incident. A sample life cycle of the Incident Playbook is:
Event is escalated into an Incident with a default Incident Playbook attached
Tasks run in sequence according to data flow
End of Incident Playbook
UI Elements
The incident playbook UI contains the following components:
Action Bar
.png?inst-v=156e7329-33f8-4adb-969f-b1d01cda1134)
Back Button: Navigate to the previous level.
Breadcrumbs: Displays your location relative to other modules/pages.
Concurrent Users: All the current users viewing/editing this playbook are displayed here in their initials.
Playbook Features: View the current state of the Playbook (Live/Draft), and perform actions like Submit, Edit, Publish, or Share Permissions on the Playbook you’re working on.
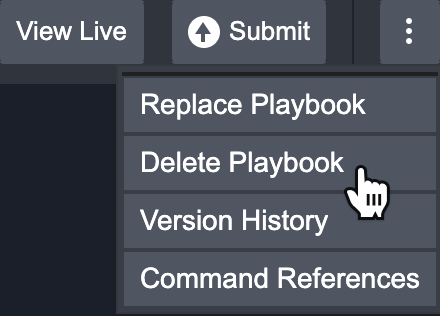
More Actions :
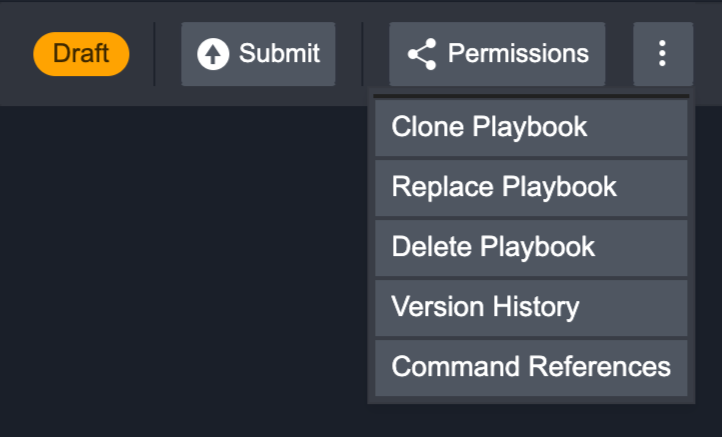
Clone: Make a copy of the current incident Playbook.
Replace: Import a Playbook to replace the existing one (only in Draft mode).
Delete: Remove the Playbook from the system.
Version History: View the previous versions of the Playbook and export.
Command References: View all commands used in the Playbook.
Playbook Details
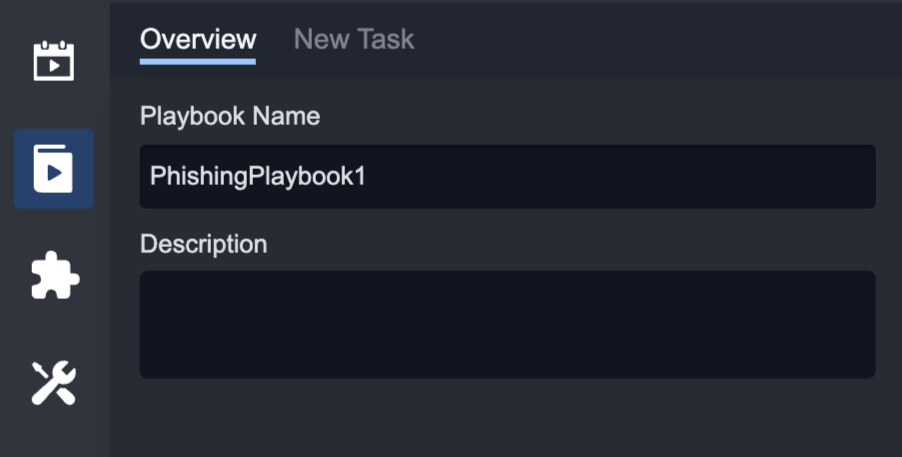
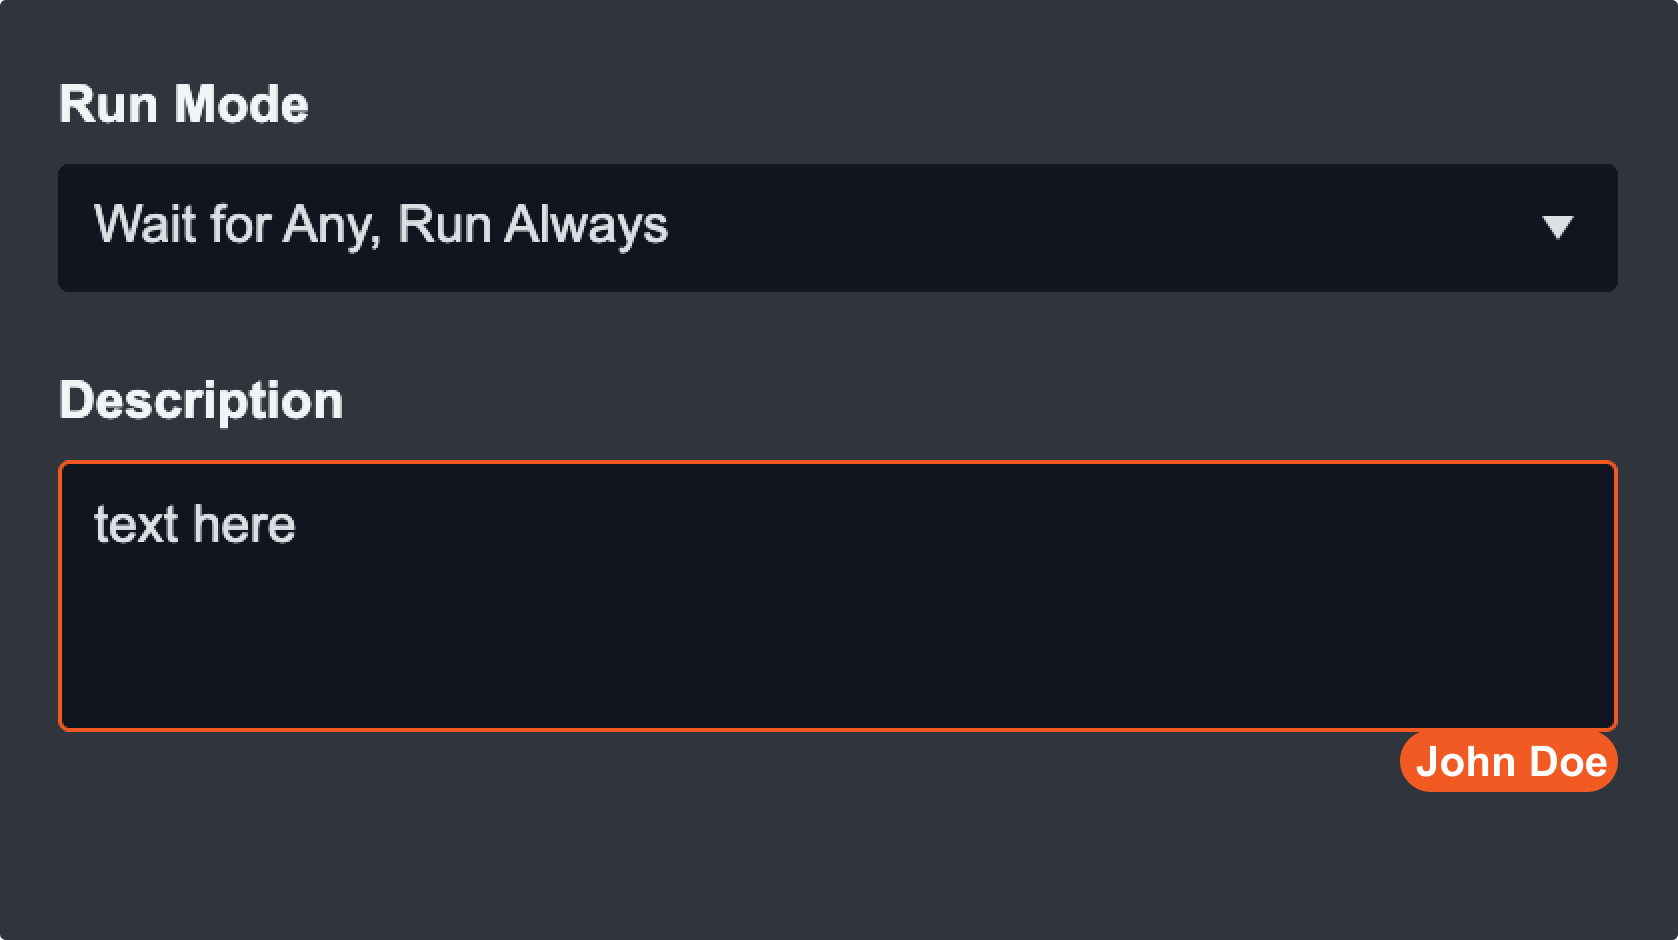
Playbook Name: This Playbook’s name; it can only be changed in edit mode.
Description: A short description of this Playbook.
New Task: The tab displays a list of Playbook Tasks, Integration, and Utility Commands for configuring your Playbook.
Main Editor
The Main Editor shows an overview of all the Tasks being used and how they are related to each other.
Within this view, there is a secondary Action Bar with the following actions:
.png?inst-v=156e7329-33f8-4adb-969f-b1d01cda1134)
Toggle minimap: This feature can be activated when the playbook view is larger than the frame
Zoom in: Zoom in to view a task at a larger size
Zoom out: Zoom out to view more tasks and task flows in the frame
Fit to screen: The entire playbook will fit into the size of the frame
Export: This allows you to save the current playbook view as a .PNG file
Refresh: Refresh the Playbook for the most recent updates
Search: You can search for any task in the Playbook
Run test: Test run your Playbook
Stop test: Stop the test run
Starting from the source node, Tasks are run from left to right. You can choose to have different types of flow between nodes, including looping and conditional tasks. For more details on data flow, refer to Data Flow in Playbooks.
Task Editor
You can configure details of a Task such as Task Name, Input, Assigned To, etc
Features
Triggers
In an incident playbook, task chains can be connected to a trigger. In this case, each task chain is only run when the trigger condition is satisfied. Currently, incident playbooks have four triggers:
On Incident Close – Tasks connected to this trigger run when the incident is closed.
On Incident Reopen – Tasks connected to this trigger run when the incident is reopened.
On Incident Change – Tasks connected to this trigger run when the incident is changed.
On Incident Status Change – Tasks connected to this trigger run when the incident status is changed.
You should use these triggers to help you classify which workflows to run depending on the stage of the incident life cycle an incident is currently in.
Draft/Live Modes
There are two Playbook modes in the incident playbook:
Draft  | Playbooks that are in Draft mode are configurable. This mode is meant for you to test and make changes to your Playbooks without impacting the Playbooks you’re currently using in a live environment. |
Live  | Playbooks in Live mode are the Playbooks you can use in your live environment. These playbooks are read-only as they’re being actively used. You can only Publish a Playbook in Live mode to other sites. |
By default, all newly created Playbooks are in Draft mode. Once a Playbook is fully configured, you can switch the Playbook mode from Draft to Live by pressing the Submit button to solidify the changes.
Collaboration and Concurrent Users
When collaborating with other users on a playbook, it’s essential to know if you are on the same playbook and what changes each of you is making. Seeing concurrent users is also important when working independently on a playbook so that you are aware of where other users are, and no crucial data is unknowingly overridden.
Concurrent Users at Playbook Level
Every user currently working on the same playbook will appear on the toolbar as coloured circles with their initials. When you hover over a specific user, you can see their name. The toolbar can display up to five users’ initials. However, if the total number of concurrent users exceeds five, the 5th circle will show you how many more people are here on this playbook. When you hover over that number, you will see a list of their names.

Concurrent Users at Task Level
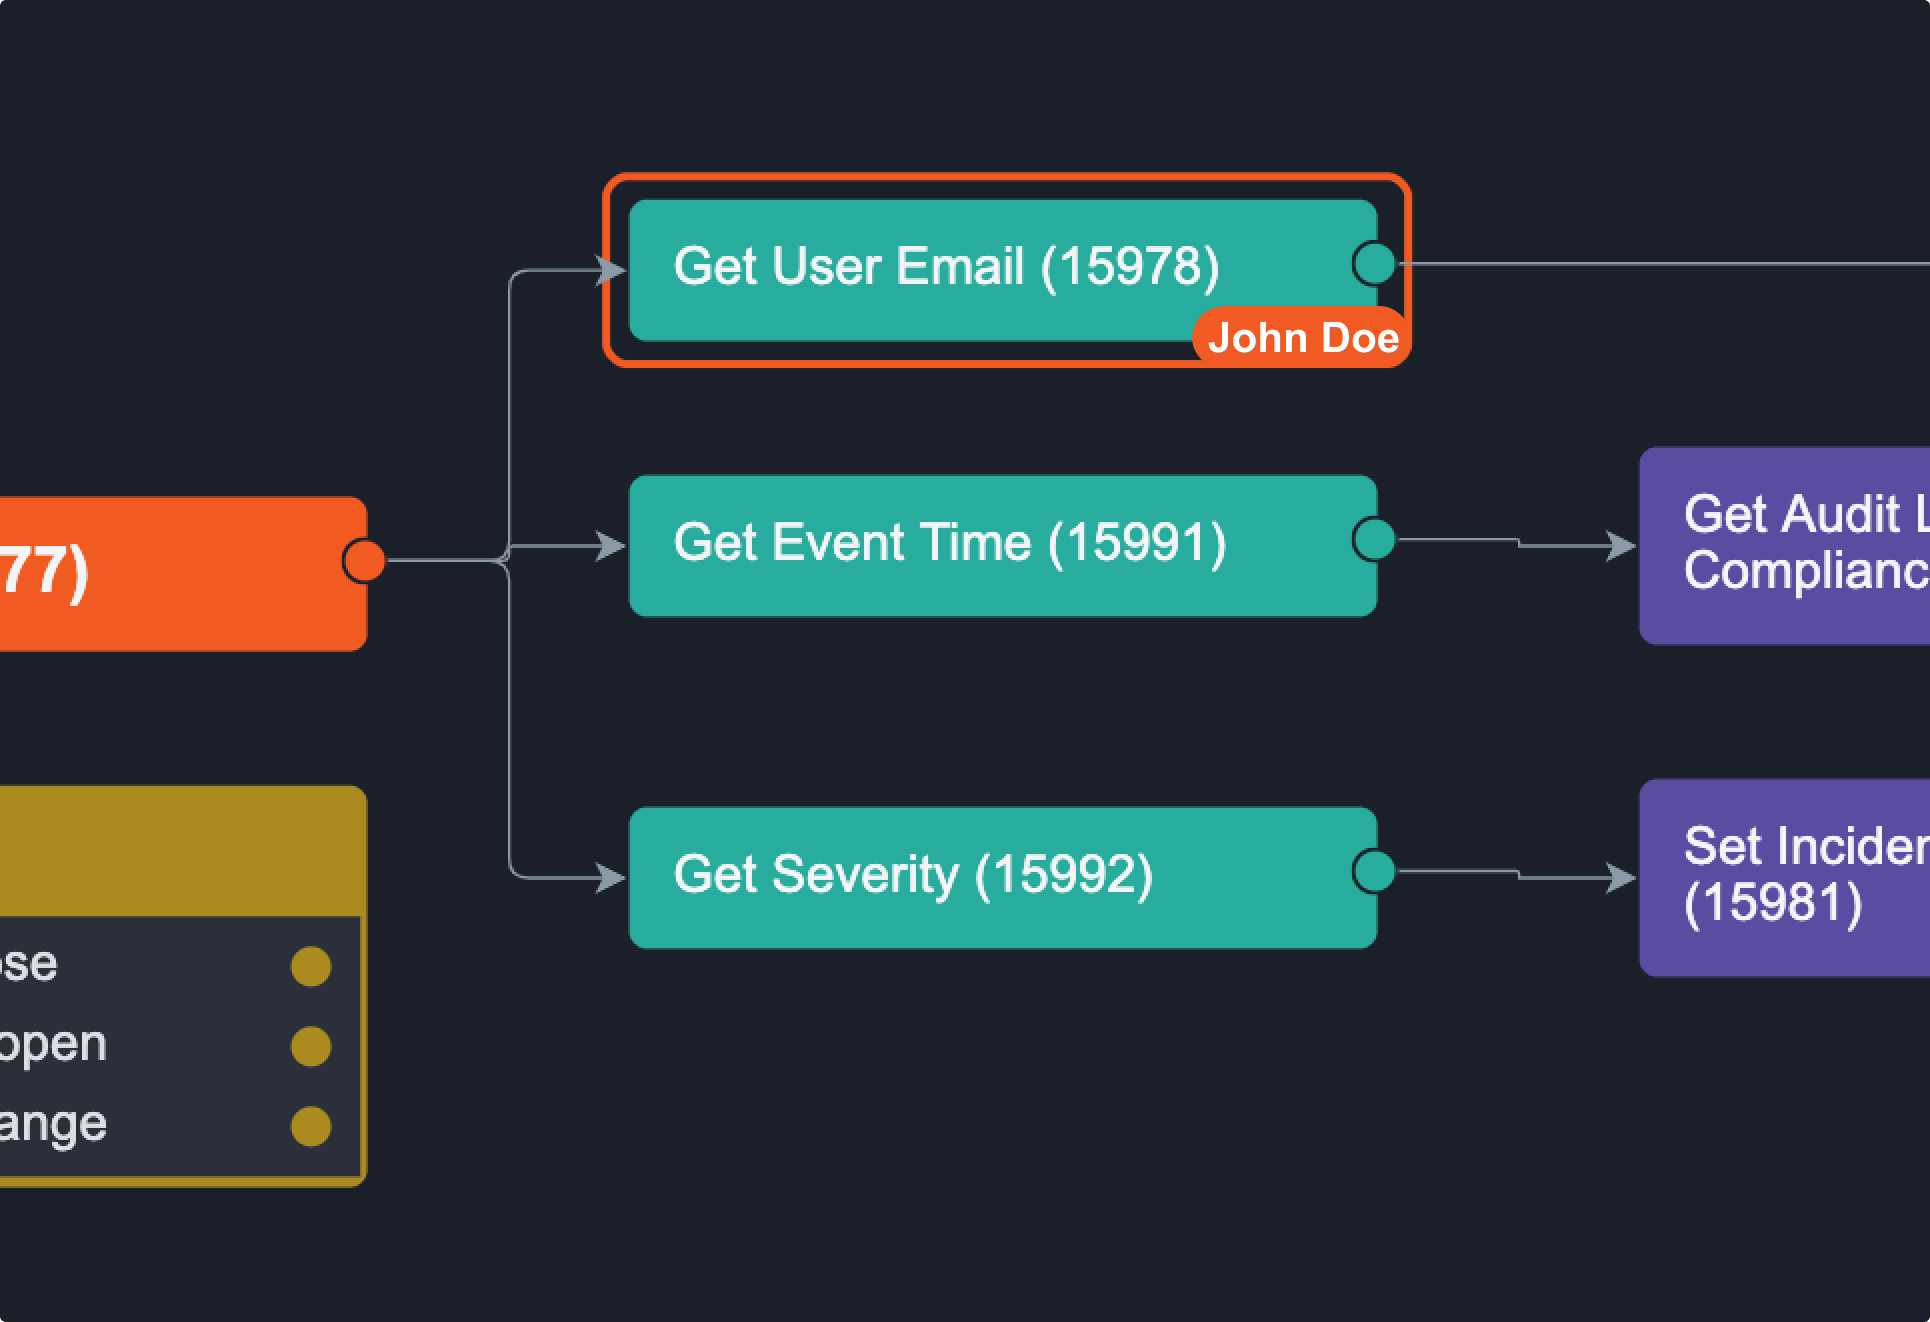
When a user is on a specific playbook task, whether they’re viewing or editing it, you will see an outline in their colour around the task they're on. When you hover over the task, it tells you exactly who the user is.
In the case of multiple users on one task, you can hover over the task to see everyone’s name.
Concurrent Users at Field Level
To view a specific field that a user is editing, click on the task to open up the task configuration panel. The field being edited will be outlined in the editor's colour. When you hover over the field, you will see the editor's full name at the bottom right corner. However, concurrent users at field level can only be seen when the playbook is in draft mode.
In the case of multiple users on the same field, you can hover over the field to see everyone’s name. Fields are automatically saved when you click away from the input box.
Alert
Please be aware that when multiple users are editing the same field, the last saved edit will override previous saved edits.
Concurrent Editing and Saving
View Draft / View Live
As mentioned in the above section, a playbook can have two modes, a live mode, and a draft mode. When another user clicks on the Edit button while you are viewing a playbook, a draft mode is created for the other user to edit. You will remain on the live mode so that your viewing is not interrupted. If you want to edit or view the changes made by the other user, you can do so by clicking on the View Draft button. You can exit the the draft mode at any time by clicking on the View Live button.
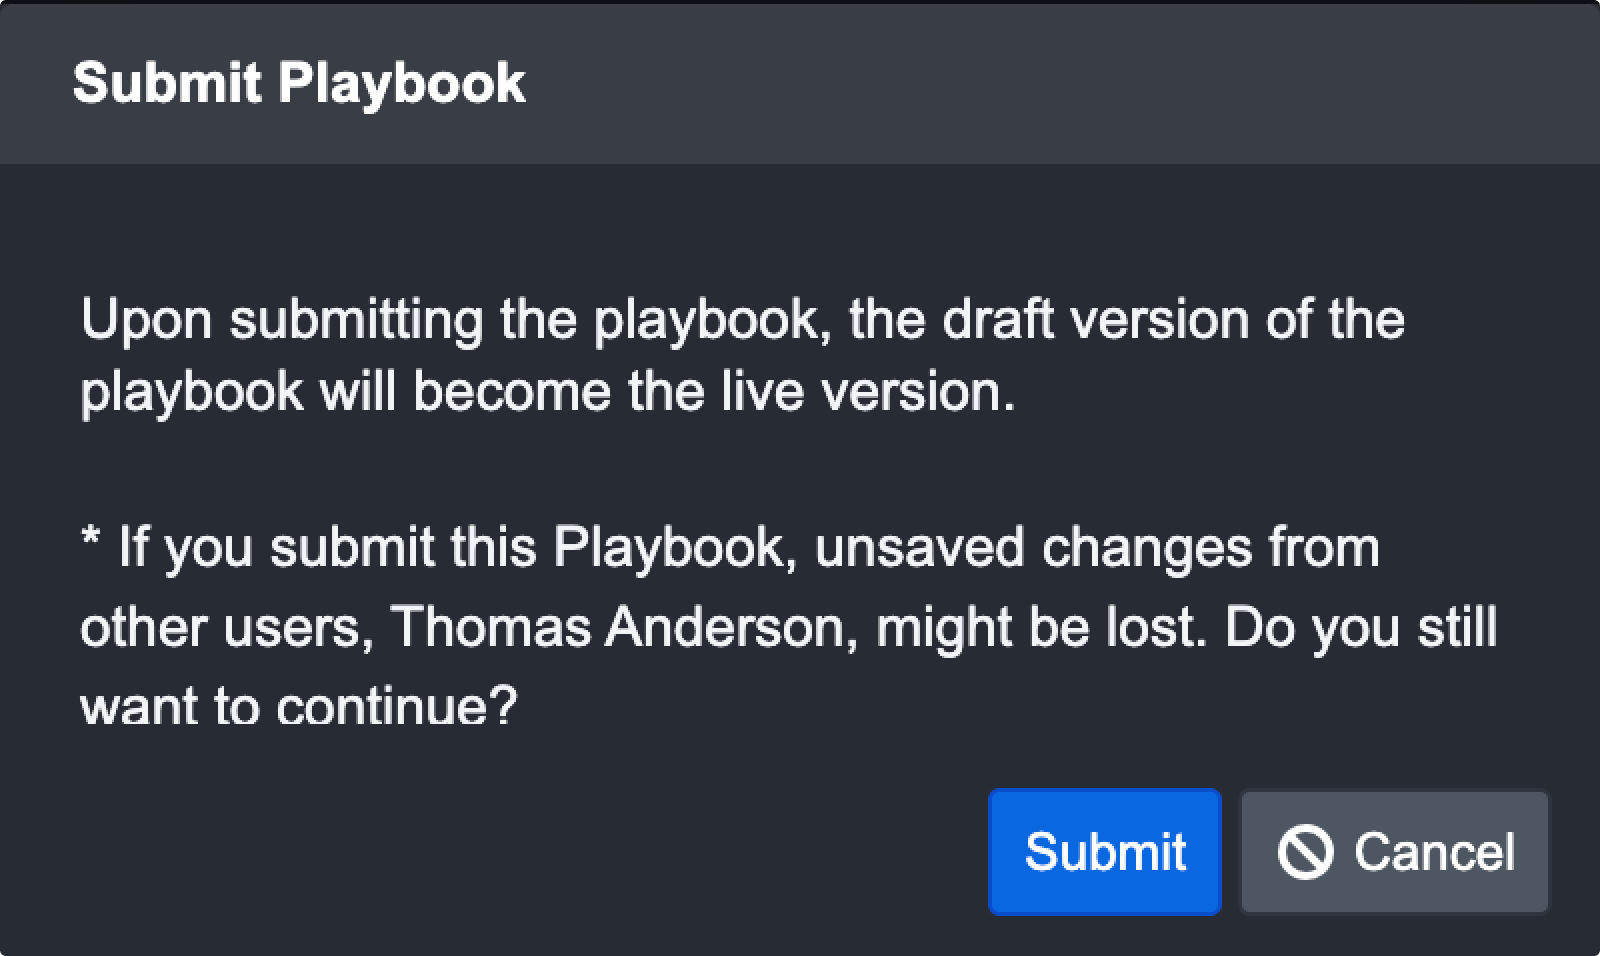
Submit Changes with Concurrent Editors
When you’ve finished editing and want to make the changes go live, the system will notify you if another user is still editing a field. You can choose to cancel your submission or submit it anyway. However, doing the latter may cause data loss or overridden changes on the fields they were editing.
In the event that other users submit their edits to go live while you are still editing a field, you will see the following notification:
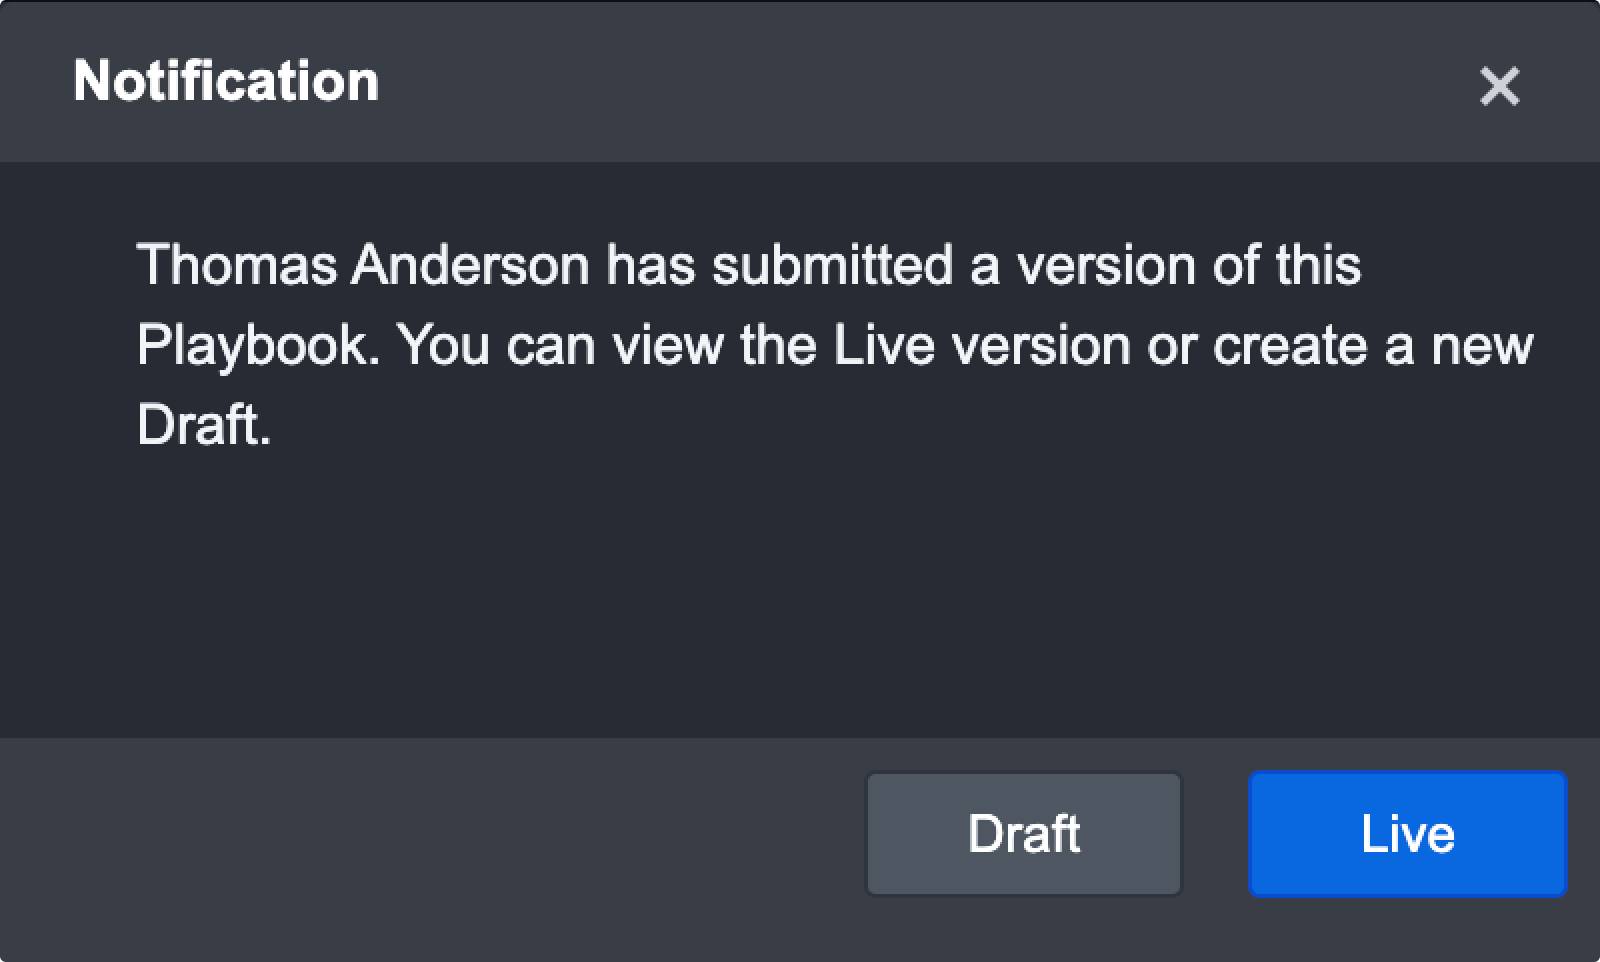
You can then choose to see the newest live view or open a draft view of the most recent live view to continue your edits.
Version History
A version of the playbook is saved every time it goes live. Each version contains the DateTime the playbook went live and the user who performed this action. You can access all previous versions of this playbook by clicking on the More button located in the top right and clicking on Version History.
To restore to a previous version of a playbook
.png?inst-v=156e7329-33f8-4adb-969f-b1d01cda1134)
Make sure this playbook has gone Live at least once
Click on More button > Version History
Click on Export this version for the version you want to restore to
Navigate back to the playbook and make sure the playbook is in Draft mode. You can do so by clicking on the Edit button if the playbook is still in live mode.
Click on More button > Replace Playbook
Browse and select the playbook XML file that was exported in step 3
Click Replace
Result
The playbook has been replaced with the selected version.
More Actions
These actions are accessible by clicking on the ⋮ button in the Action Bar.
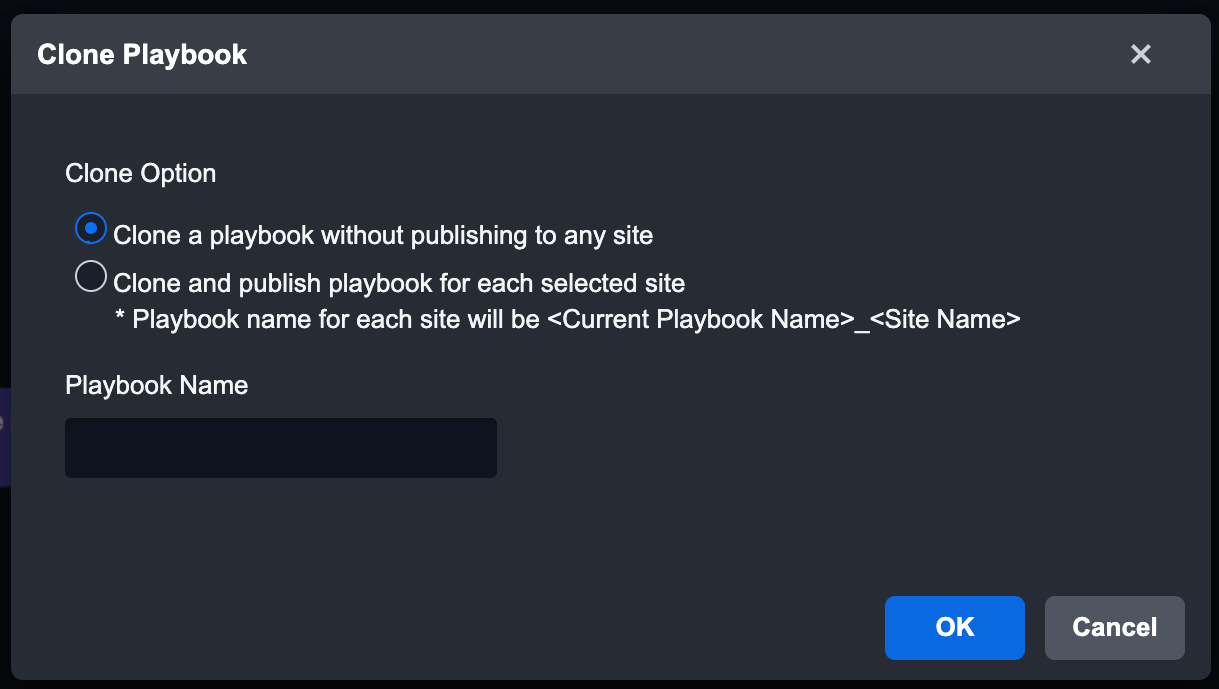
Clone PlaybookYou can reuse a Playbook within the same site with Clone Playbook. Cloning a Playbook can save time as the assignee within the tasks is preserved.
|  |
Replace PlaybookWith this feature, you can replace your current Playbook with an exported one. Only a playbook in draft mode can be replaced.
|  |
Delete Playbook
|  |
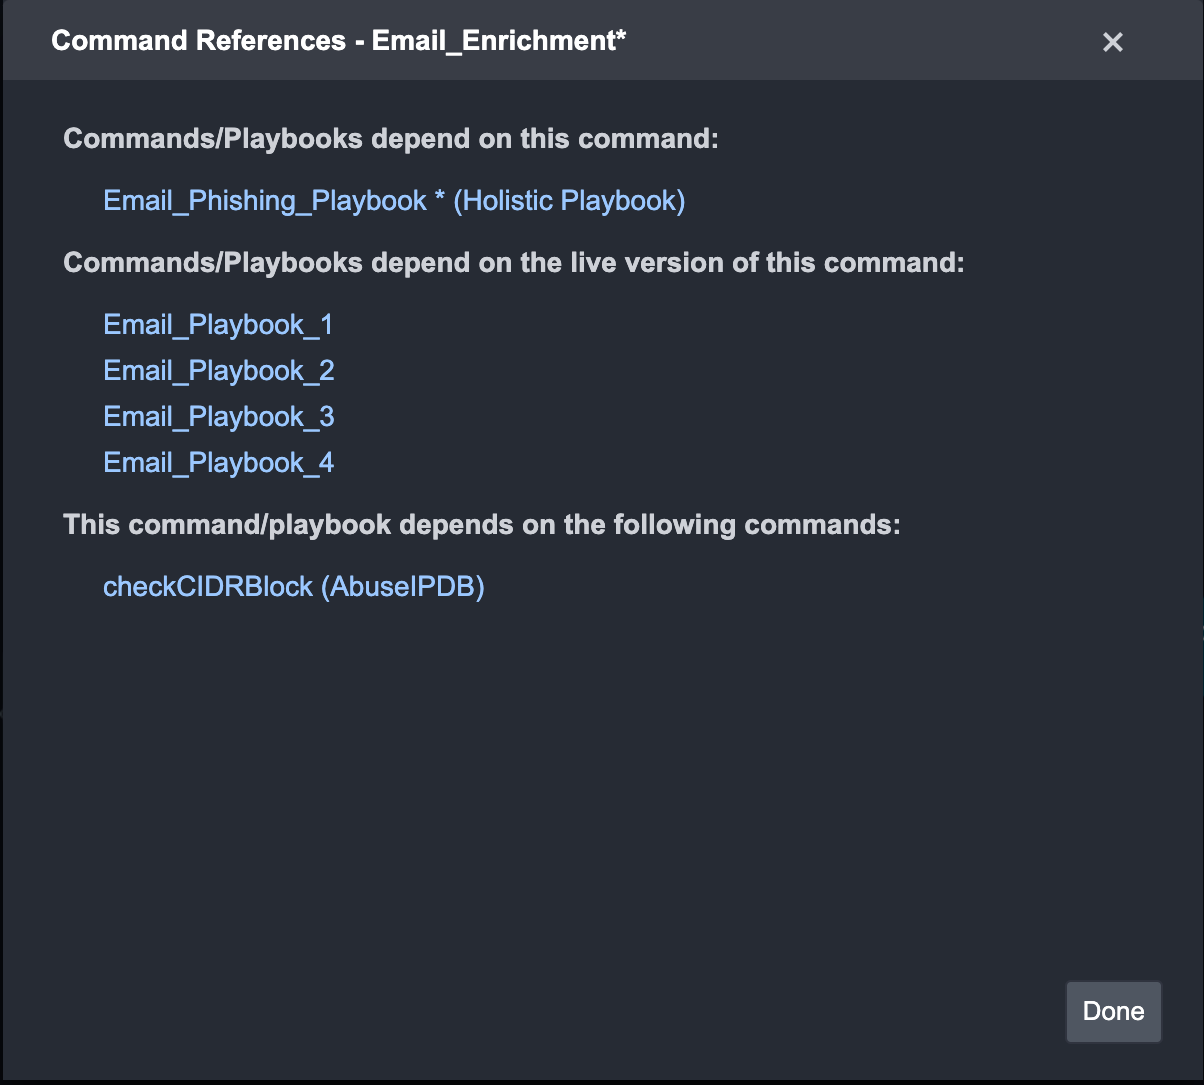
Command ReferencesThe Command References pop-up allows you to see the relationships between Playbooks and Commands. Command References are helpful when you want to see how your changes may impact the existing Playbooks that are used in a live environment. For instance, you can check:
|  |
Local Shared Data
The local shared data allows you to store data in JSON format for tasks to reuse in a playbook. This storage area is local – data stored here is only accessible by this playbook and this playbook only. This feature may be helpful in situations where there are data (e.g. URL reputations) you want to be accessible by any tasks regardless of their playbook path.
There are four utility commands in D3 SOAR to help you manipulate data in the local shared data:
Command | Description | Input | Output |
Add Root Key for Local Shared Data | Adds new JSON object data to the local shared data | JSON object data to be saved and the JSON path to define where it is saved | Stored the data to the defined JSON path in local shared data |
Remove Field from Local Shared Data | Deletes specified fields from the local shared data | Removes field with specified JSON Path from Local Shared Data in playbook | A log of what data was deleted |
Extract URLs from Local Shared Data | Extracts all URLs within the local shared data | None | All URLs in JSON array format in the local shared data |
Get Local Shared Data with JSON Path | Retrieve JSON data from local shared data by the specified JSON path | JSON path to retrieve data from | The JSON object saved in the specified path |
To add and retrieve data from local shared data
In this example, we want to save URL reputation data from a task to the local shared data and add this data to a global list in the system.
Drag the command task Add Root Key for Local Shared Data and drop it right after the Check URL Reputation task
In the command input area of Add Root Key for Local Shared Data:
Input
Select the path of the output of the Check URL Reputation taskJSON Path
Enter$.URLReputationData
In Add to Global List command task, make sure Dynamic input is enabled and click on …
Select Local Shared Data from the data source dropdown
Select the path
$.URLReputationDataTest the playbook
Result
The Add to Global List command successfully retrieves URL reputation data from the Local Shared Data.
Playbook List
The Playbook List shows all the Incident Playbooks you have in the system. Clicking on any Playbook from the List will open up the Playbook Editor where you can configure the specific Incident Playbook.
Search bar: Search for Playbooks using keywords
Create a New Playbook
Import a Playbook: Import a Playbook into the system by uploading an .xml file
[Tag] Built-in/System Playbook: These are commonly used Playbooks that are ready-made and can be implemented immediately
[Tag] Owner: This indicator helps you to quickly identify and access Playbooks that you’ve built
[Tag] Editor (Playbook): This indicates that you have edit permissions to this Playbook and this permission was granted specifically by the Playbook’s creator.
[Tag] Editor (Site): This indicates that you have edit permissions to this Playbook because you have edit permissions in this Site
Live Count: Displays the number of Sites this Playbook is published to
Draft: This indicates that there is an unpublished Draft version of this Playbook
.png?inst-v=156e7329-33f8-4adb-969f-b1d01cda1134)
Access Control
D3's SOAR platform incorporates a combination of role-based and predefined access controls that can be executed at the Incident, Stage, or Task level. Through this model, you can determine access control rules for five types of assignees: Users, Groups, Role, Owner, and Investigators. The following diagram describes the access control hierarchy within the SOAR platform:
Level 1 - Incident Type/Dynamic Sections
.png?inst-v=156e7329-33f8-4adb-969f-b1d01cda1134)
This is an overarching control whereby SOC Engineers can either grant full control, read-only access or deny Users, Groups, and Sites to a selected Incident type (e.g. Brute Force Attack) and underlying dynamic form sections (sections, options and elements).
The privileges set for each user, group, or site will determine what information can be accessed in the incident overview. Level 1 Access controls and relevant configuration will be further explored in the Organization Management module.
Level 2 - Incident Stage
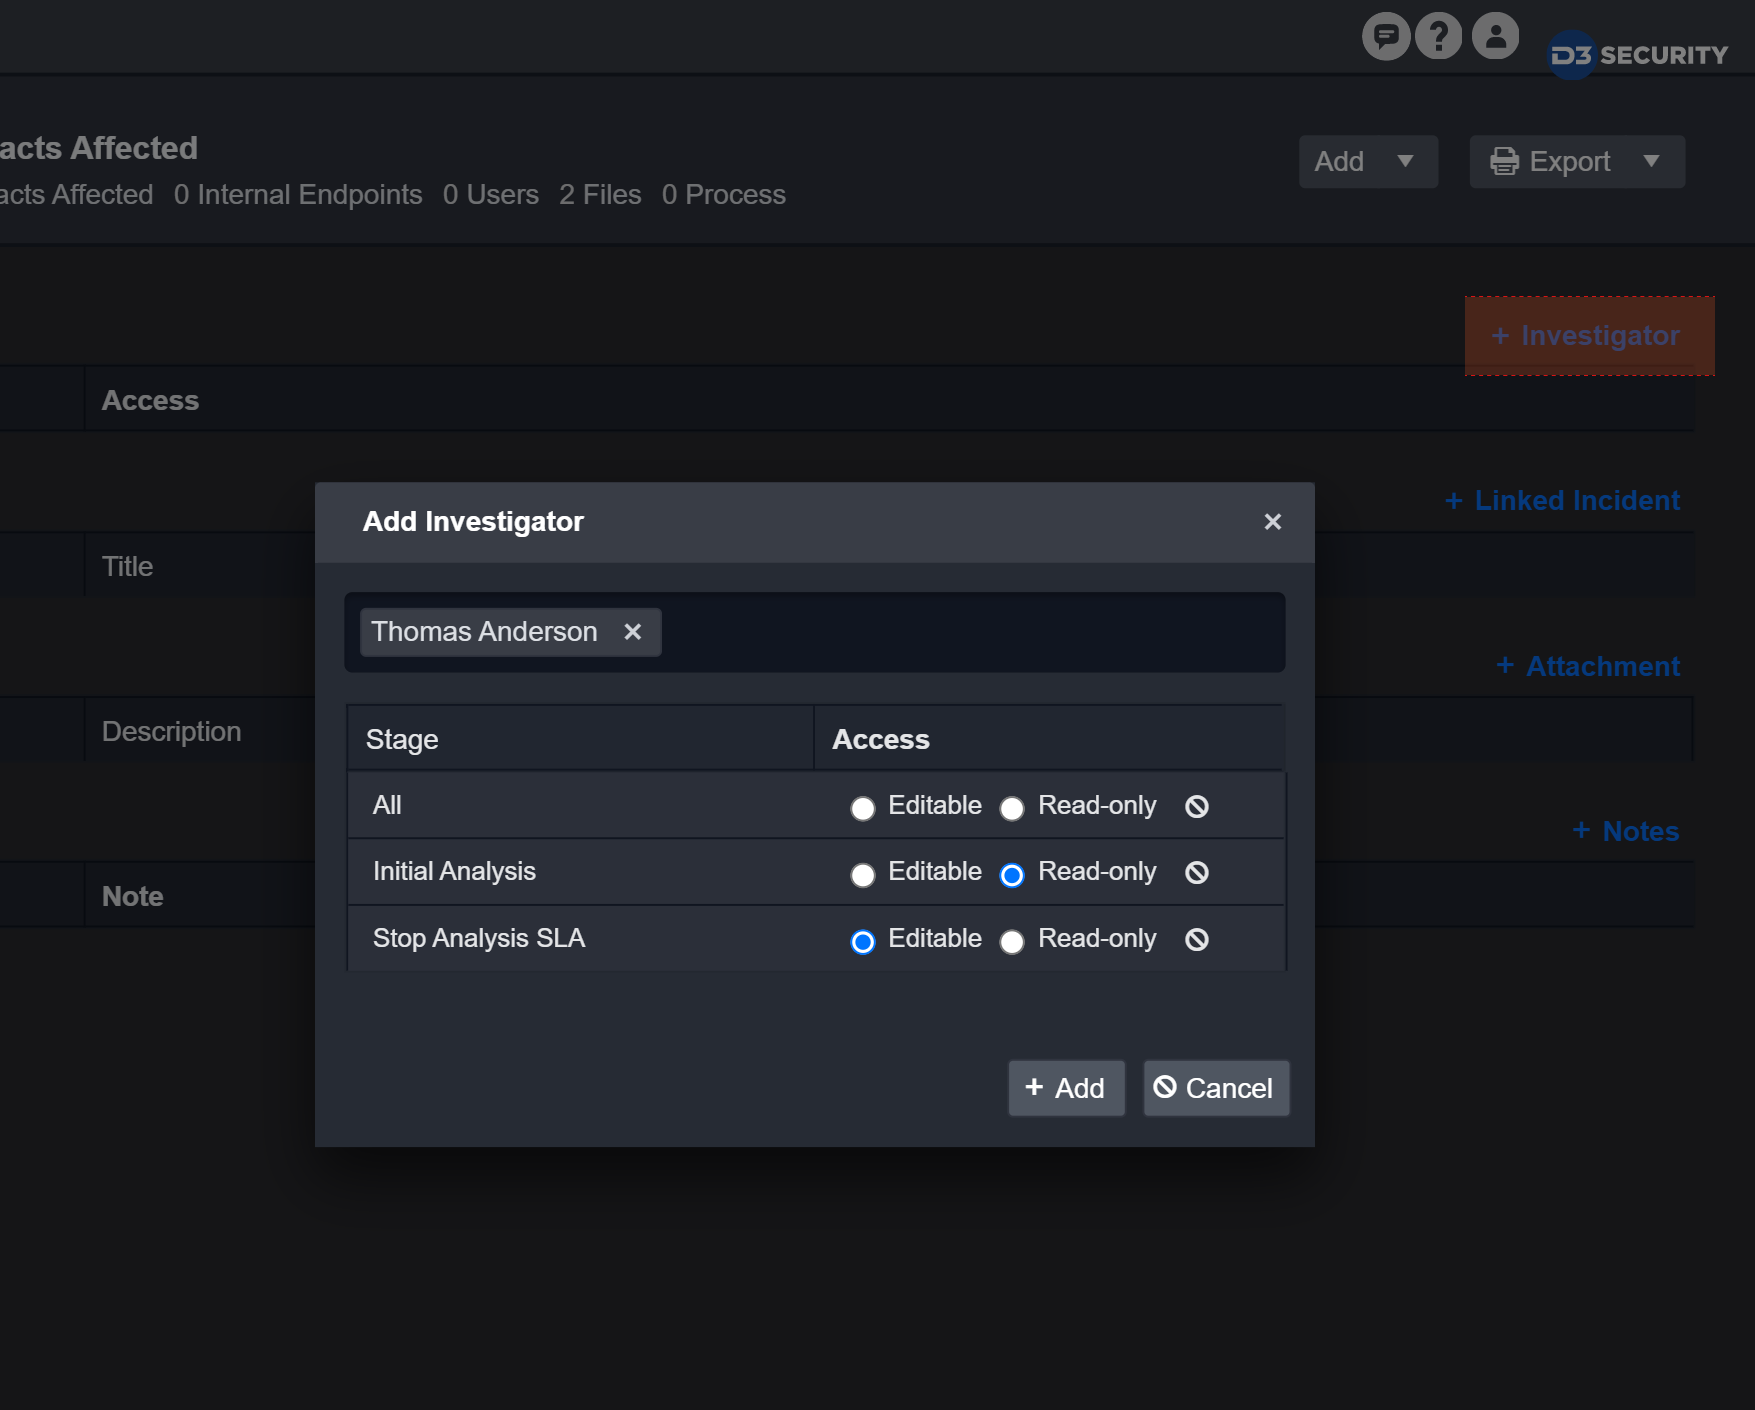
Access controls set at this level are incident-specific. Users with full access privileges to the incident type can be selected and added as an investigator from the incident overview page.
Once added, you can restrict the investigator to editable or read-only access to the various stages within the incident.
Level 3 - Playbook
You can define who can edit or have access to a connection. By default, the creator of the connection will be marked as the owner and be the only person that can use the connection. In order for other users to have access to the connection, the creator will have to provide a Viewer, Editor, or Owner role. Below are the permissions granted for each role:
Permissions Given | Viewer | Editor | Owner |
|---|---|---|---|
View Playbook details |  | | |
Edit Playbook Details | | | |
Set as a connection as the default for an action | | | |
Edit connection details | | | |
Change the user permissions | | ||
Clone connection | |
Reader Note
There must be at least one owner for each playbook. The last owner cannot be deleted or reassigned to the viewer/editor.
Level 4 - Playbook Task
The access controls at this level are applied to a specific Task within a specific Playbook Type. Within each Playbook Task, you can assign different Users, Groups, Roles, Owners, and Investigators from the Assigned To dropdown to action the Task.
Publishing
To use an Incident Playbook, you have to publish it to one or more Site(s). Only Live Playbooks can be Published to other sites for members of the Site to use.
To publish an Incident Playbook:
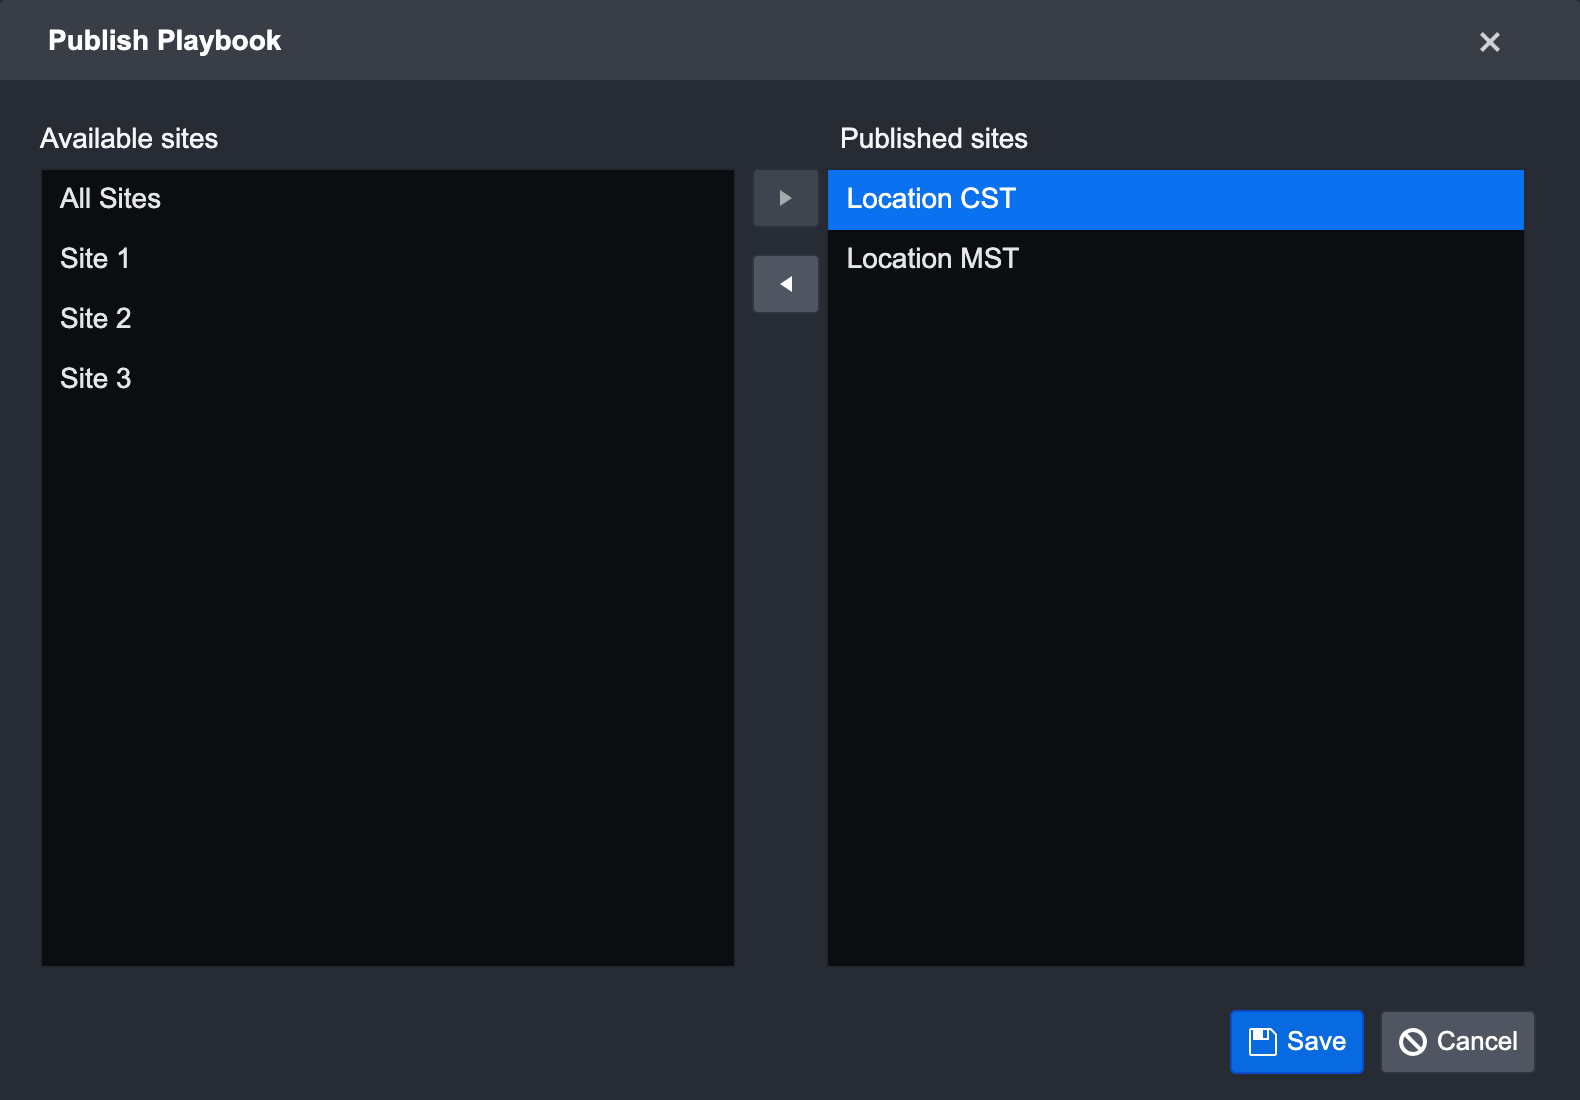
Click on the Publish button next to the Playbook Modes. The Publish Playbook window will appear.

Use the centre right and left arrow buttons to publish or remove sites between the list boxes. Hold the CTRL key to select multiple users from either list.
The left panel shows all the available sites that are not published
The right panel shows published sites.
Click Save to confirm.
A dropdown list of all published Playbooks will be available when you escalate an event to an incident. You can also assign multiple Playbooks to an Incident within the Incident Workspace.
Playbook Test
The incident playbooks allows you to test your workflow while you are editing it in Draft mode. You can use this feature to test the usability of your Playbook while you are building it. The Playbook editor offers testing at three different levels of your workflow, allowing you to locate and fix bugs in your workflow more easily and accurately.
You can test on these three levels:
Playbook Level
Task Level
Input Level
Playbook Level
You can test your entire incident playbook workflow to see if everything is working as intended by clicking on the Test ▶ button in the action bar. You then need to choose a site and an incident to run the test on in the pop-up window. The Playbook runs according to the control flow, from the source node on the left all the way to the rightmost node.
.png?inst-v=156e7329-33f8-4adb-969f-b1d01cda1134)
After your first test run, you might see various icon(s) appear in each Task card. These icons represent the current status of the Playbook task, and you can click on the icon(s) to view the Playbook Task Details in the pop-up window.
Task Status | Description |
|---|---|
 Run | This status is only available when you are testing a playbook. This allows you to test individual tasks to check if they’ve been configured correctly without the data from prerequisite tasks. |
 Queued | This status means the task is in a queue and waiting for its turn to run. |
 Done | The green checkmark means the task was successfully run. |
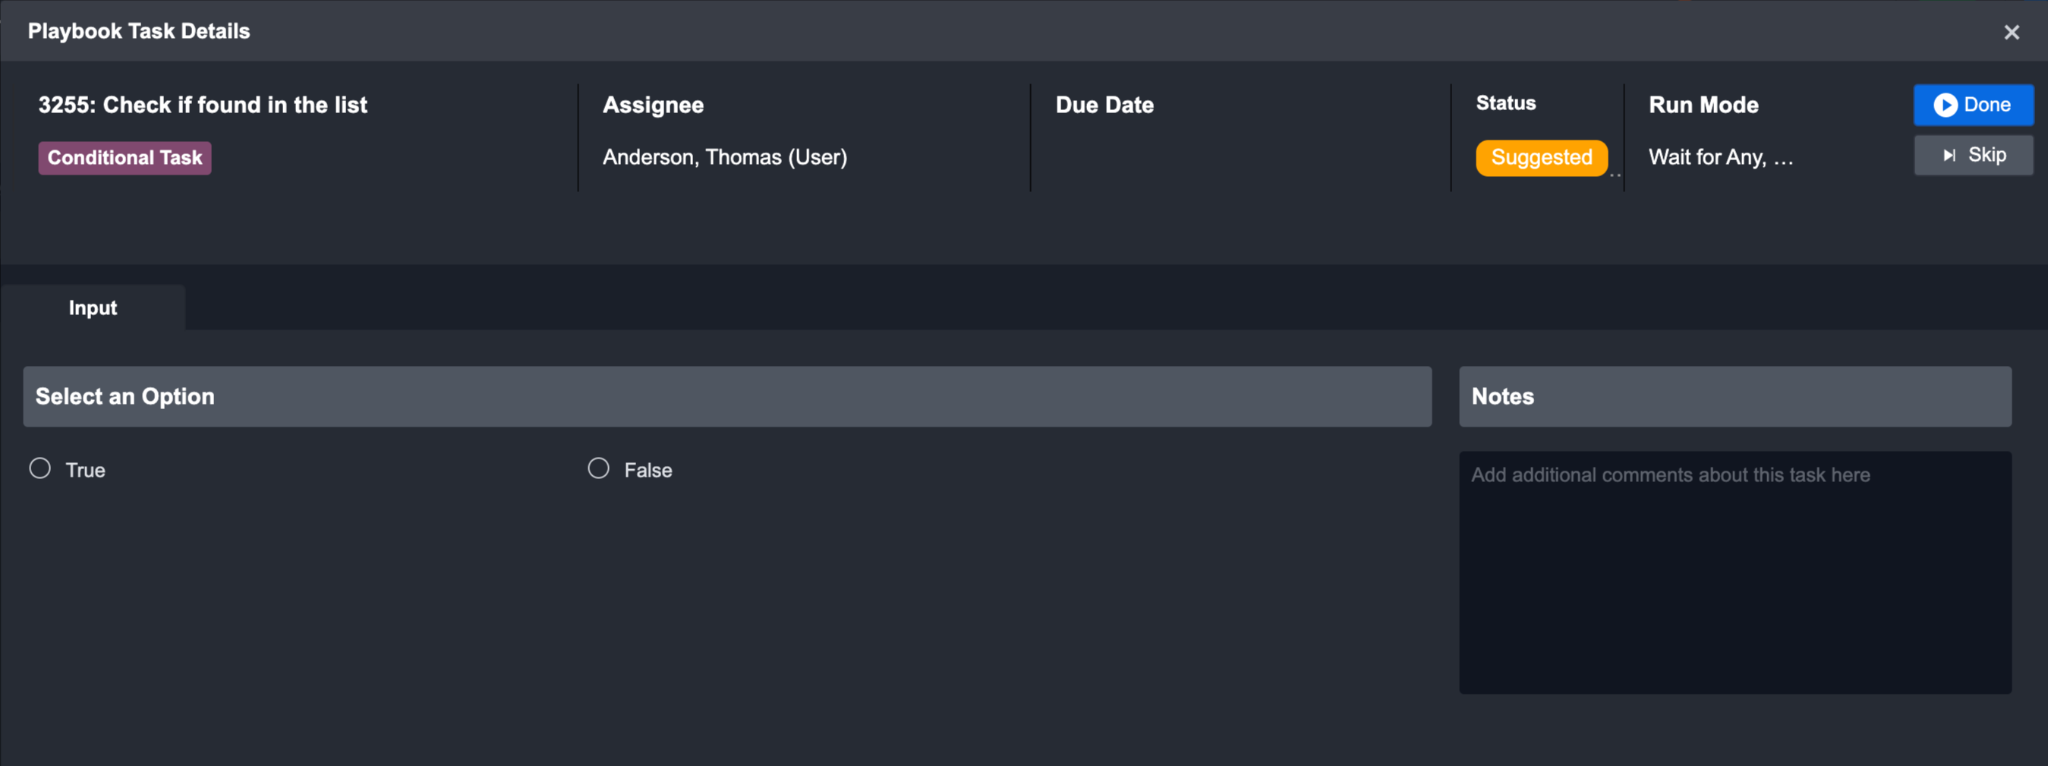
 Required  Suggested | Required tasks are represented by an asterisk and suggested tasks have a light bulb. Both of these statuses are referred to as a Pending Task. Required Tasks require your manual response, whereas this action is optional for Suggested Tasks. |
 Running | When you see this icon, it means the Task flow is currently being executed. |
 Skipped | The Suggested Task has been skipped, instead of being executed. |
 Error | Indicates that an error has occurred while the Task was running. You can rerun these Tasks after correcting the error. |
 Rerun | The icon appears when the task has been rerun. |
 Wait For Reply | This status appears when the Task is a nested Playbook and there are additional Tasks to be completed within this Task before it is updated as Done. |
You can click on the icons to view the task details and status. Within the pop-up window, the top panel highlights the Task Type, Assignee, Due Date, Status, Run Mode and action buttons of the playbook task. If not run, the first tab within this window presents the Input tab. You can review the contextual data in the Input tab, and update the input fields before running or skipping the Playbook Action. To run the task, click on the “Run/Done” button.
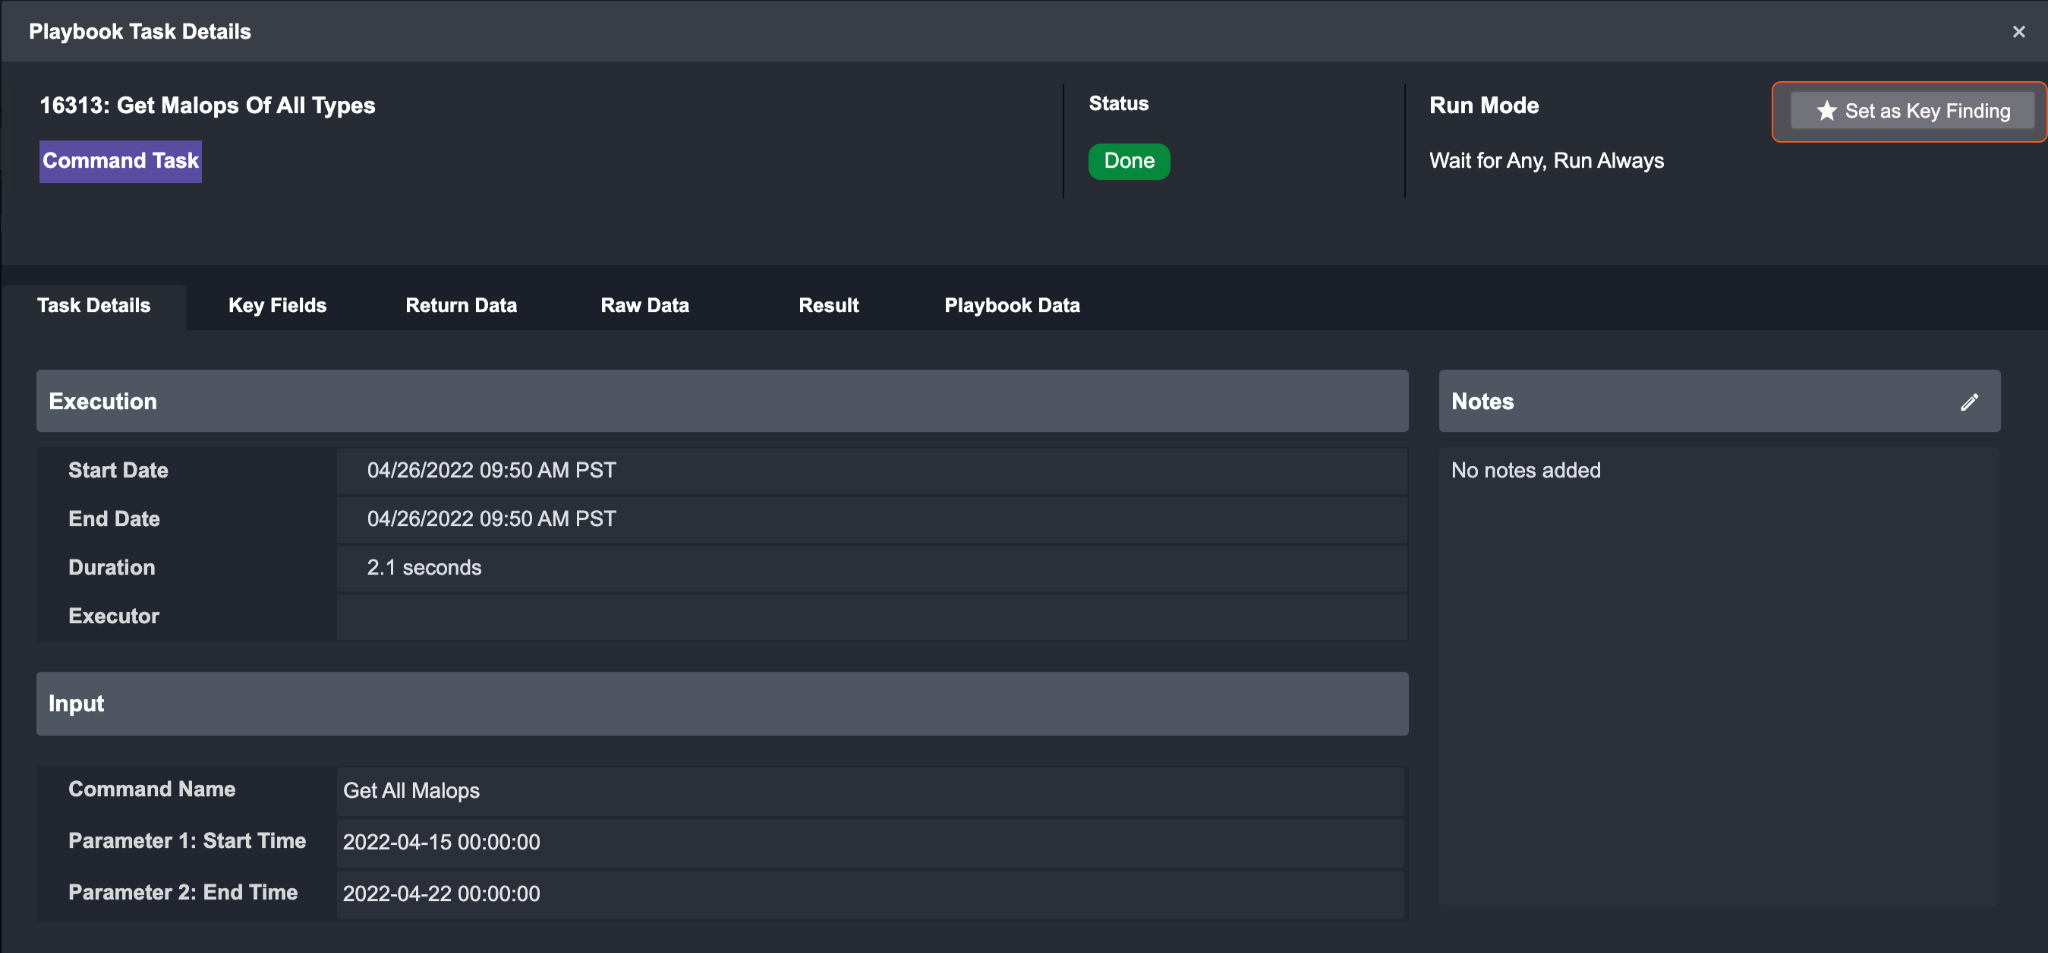
When you choose to skip a task, you can skip to the next task in the flow without having to run the previous task. After a Task has successfully run, additional tabs such as Task Details, Key Fields, Context Data, Return Data, Raw Data and Result will be available in the Playbook Task Details window. The information presented in these tabs will vary depending on the Task Type selected.
Reader Note
You can set a task result as Key Finding if it’s deemed important. All marked tasks appear in the Key Playbook Tasks under the Key Findings tab in Incident Workspace.
To test an incident playbook
Click on Test ▶.
You can select an incident to test your playbook.
Click on Run Test.
Task Level
On the task level, you can test a single task with specified input parameters and view the resulting output. Before testing at the task level, you will have to test the entire playbook at least once first to ensure there is data to test with. This can be done by clicking on ▶ Test button in the action bar. Testing a task can help you ensure that it is well configured before moving on to creating the next step of your workflow.
To test a task
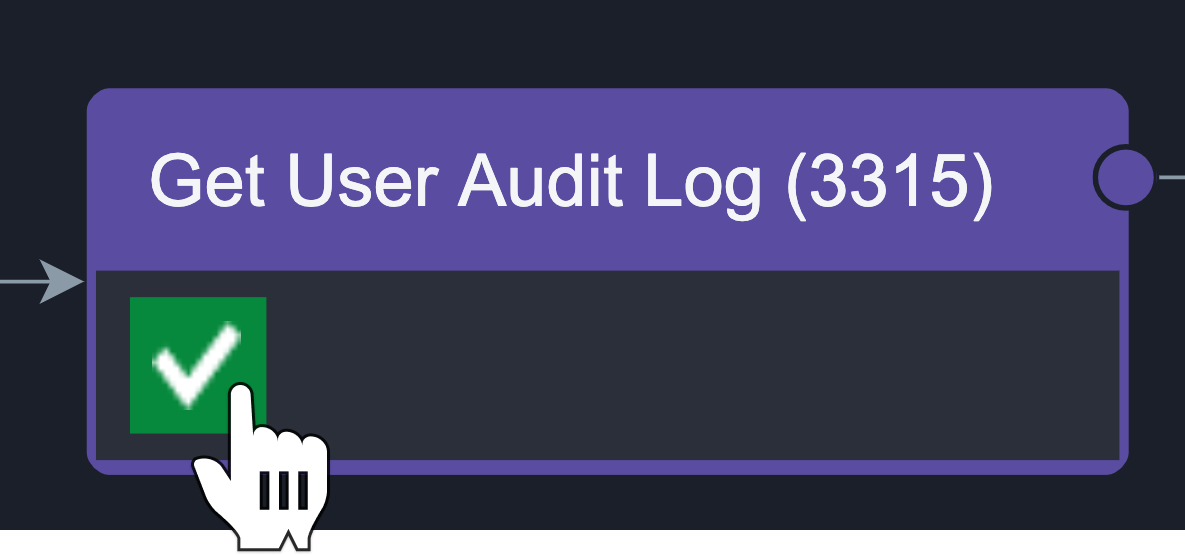
Click on the ✅ icon to check Playbook Task Details.
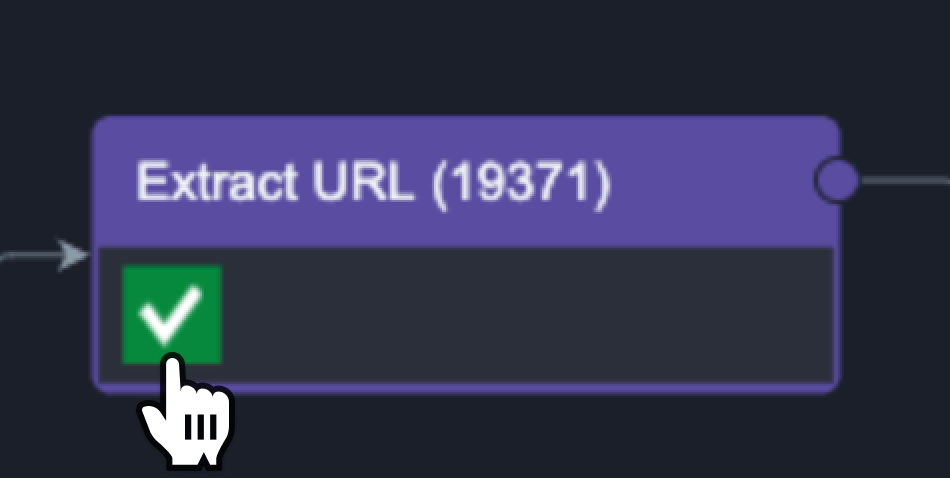
Click on the Rerun Button.
.png?inst-v=156e7329-33f8-4adb-969f-b1d01cda1134)
Input Level
On the Input level, you can test your inputs to make sure it satisfies the command parameters. Before testing at the input level, you will have to test the Playbook at least once first to ensure there is data to test with. Testing an input is especially useful when you are configuring a dynamic input - testing here can ensure the correct JSON path has been picked, or the correct data transformation has been applied.
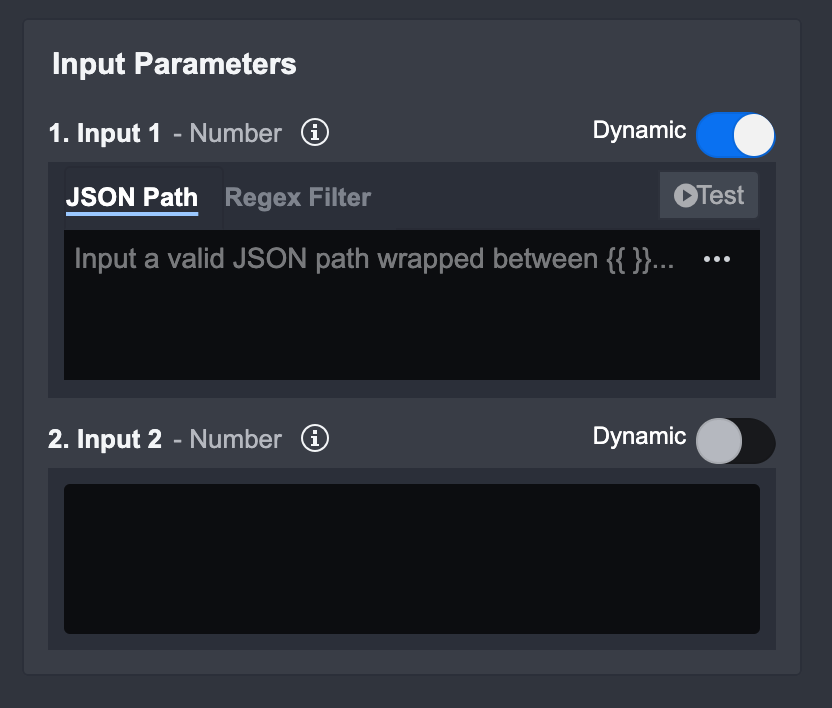
To test an Input in a Command Task
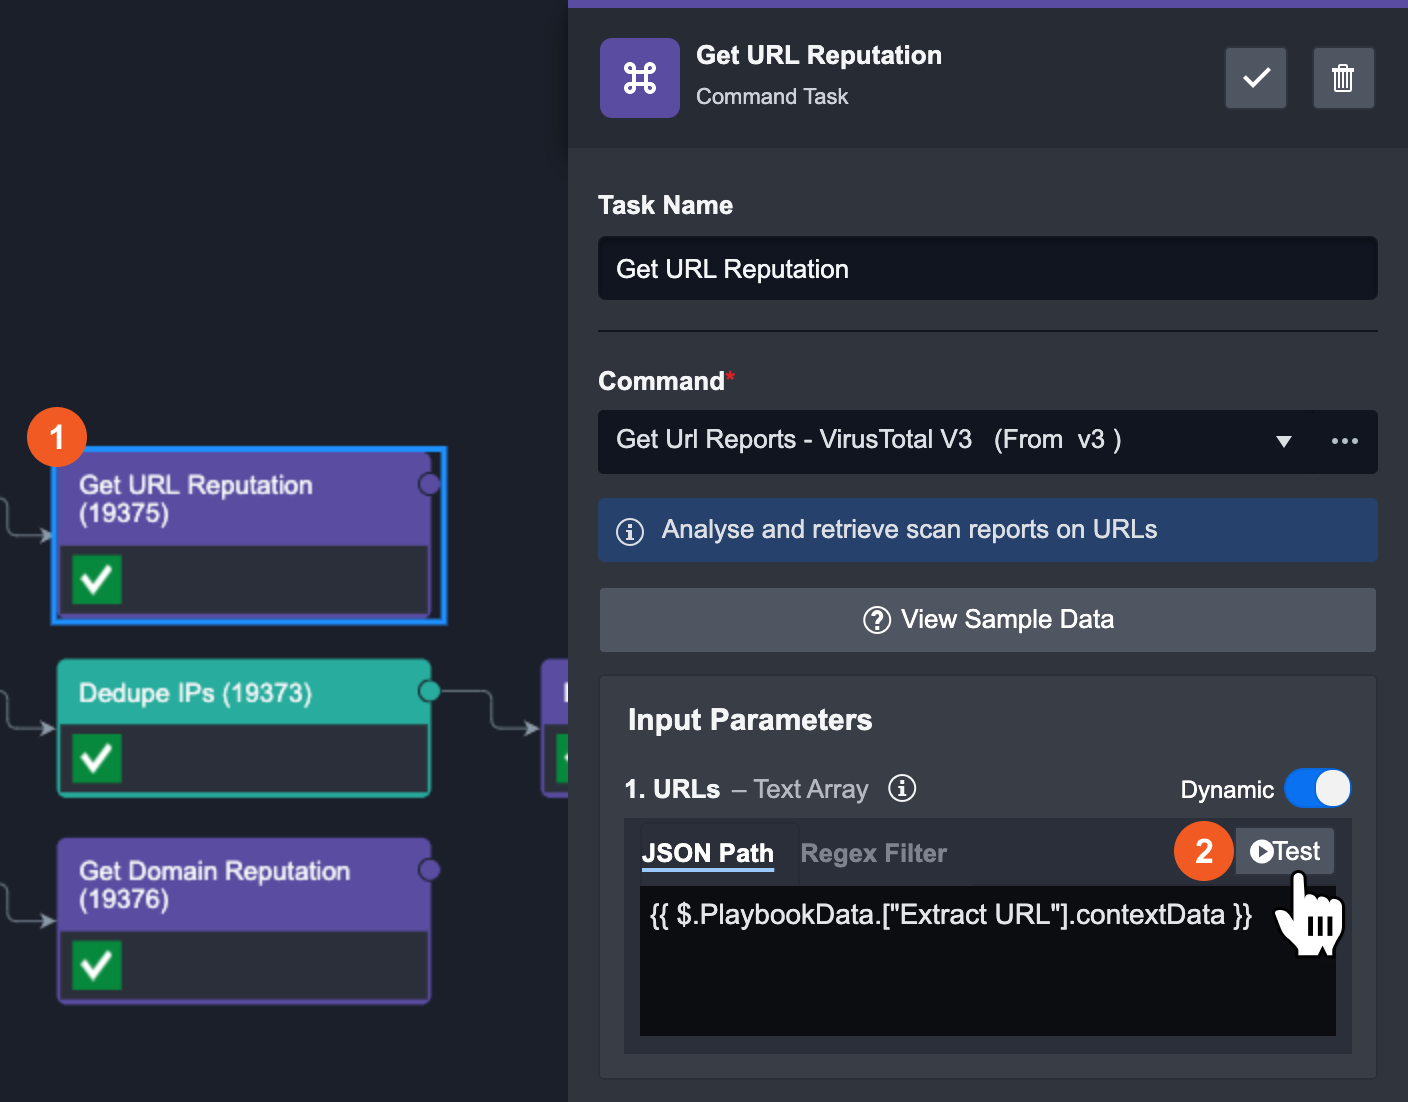
Select any Command Task.
Click on the Test button for the specific input you would like to test. Make sure the dynamic toggle is on, otherwise the Test button will not be visible.
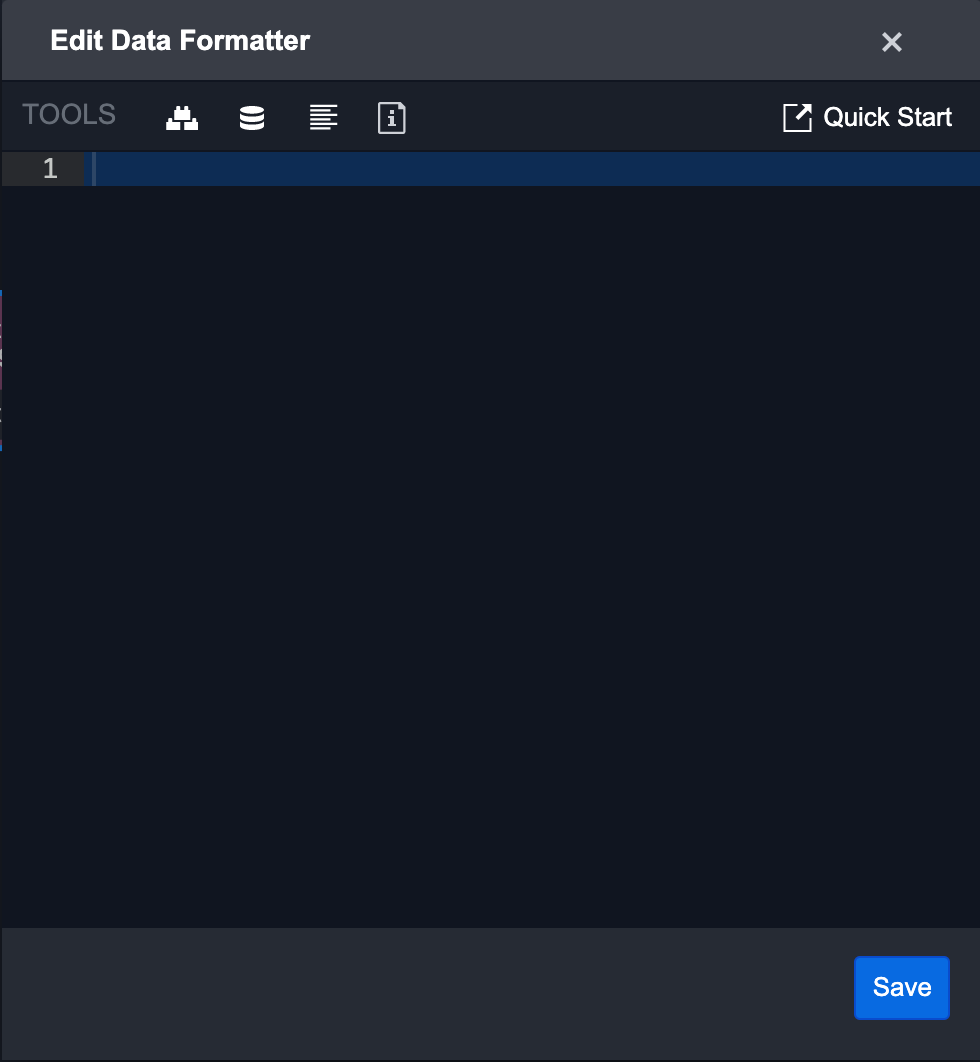
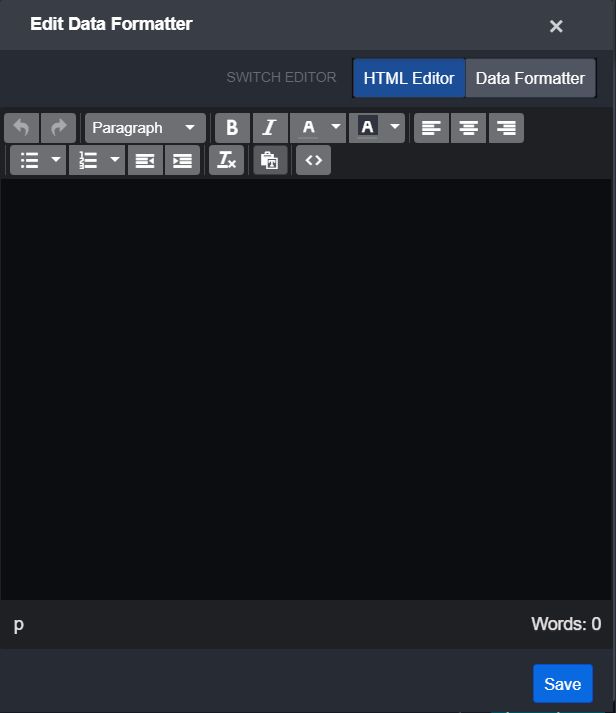
To test an Input in a Data Formatter Task
| 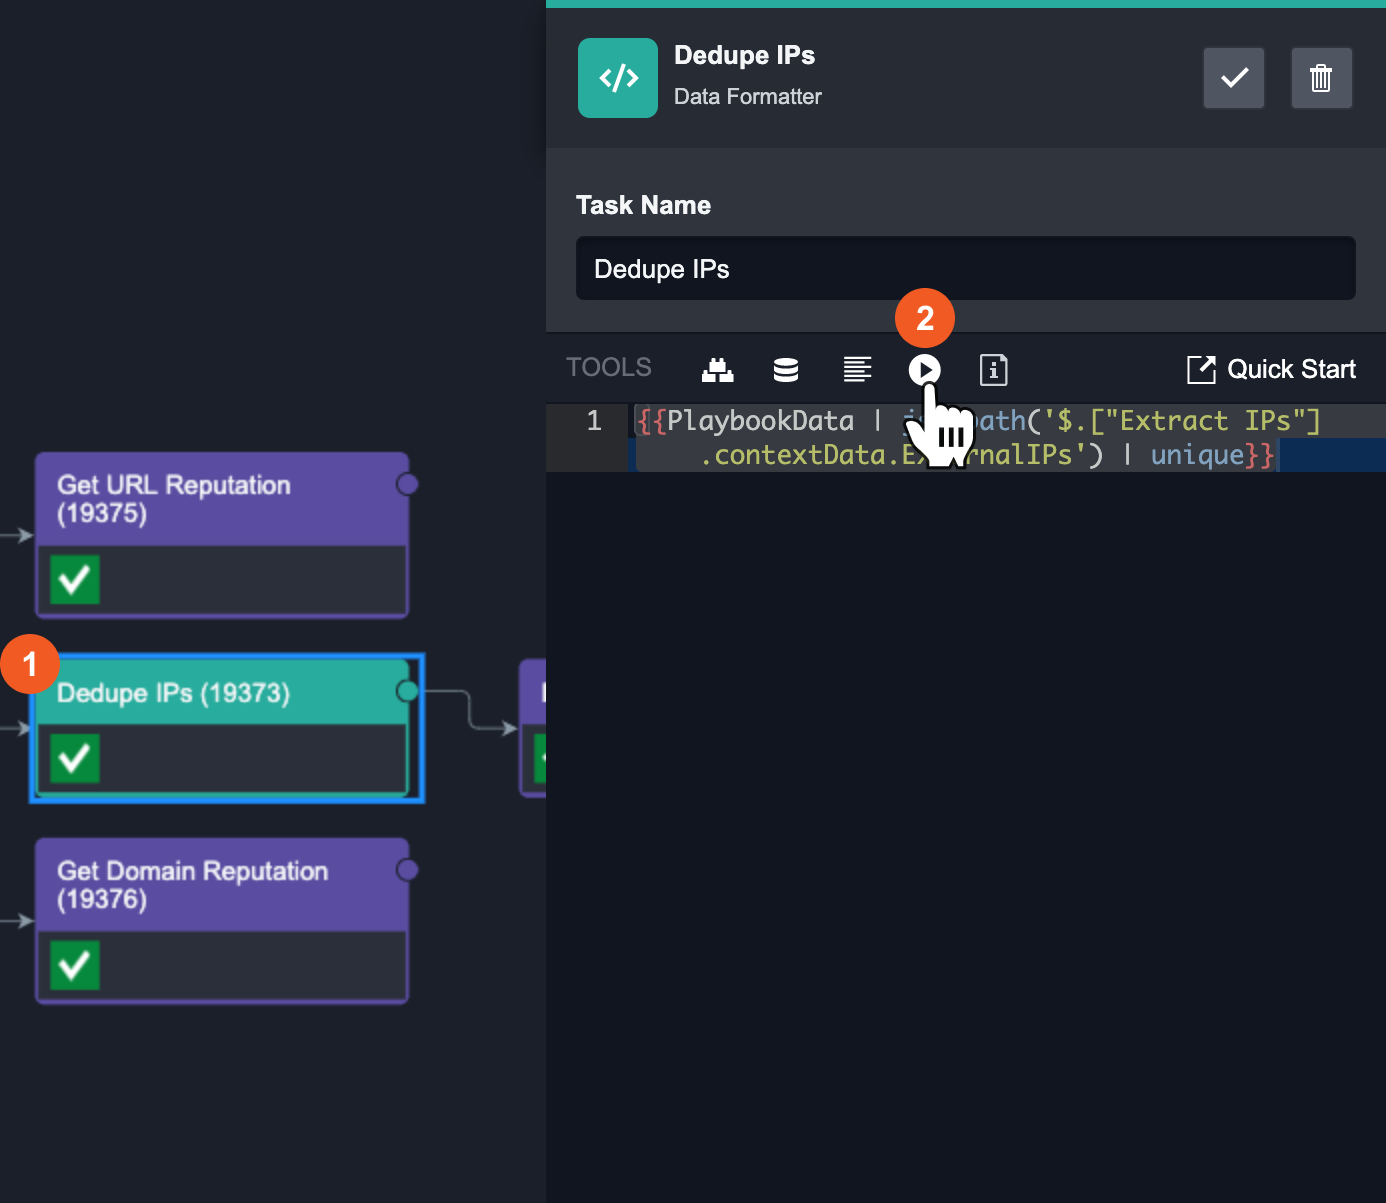 |
Tasks
Playbook Tasks are the building blocks of a playbook. Tasks take in input data, perform data processing, and return output data. These tasks are connected to each other using control flow, and data flows from left to right starting from the source node. There are 9 Playbook Tasks with which you can use to build or edit a Playbook:
Command Task
Interaction Task
Conditional Task
Data Formatter Task
Stage Task
SLA Task
REST API Task
Ongoing Surveillance Task
Unwind Task
Merge Task
To use a playbook task, simply drag and drop the task you want to use from the playbook side panel into the Main Editor. A new node will be created and connected to the preceding node via a line.
Task Data Flow
Each Task can take in input data, perform data processing, and return output data. You can link Tasks together in the Main Editor with arrows that represent data Control Flow. The following section will explain the data flow of Tasks.
Input
A Task can take in both static and dynamic inputs.
A static input means that the input is fixed and will not change. For example, in a Fetch Event Command Task, you can set a fixed start/end date for the Events you are fetching for. However, if your workflow requires a moving time window for the Fetch Event command to fetch from, you will need to use a dynamic input.
There are 5 types of dynamic input methods for a Task. They are:
Dynamic Input
Data Formatter
HTML Editor / Data Formatter
DateTime / Data Formatter
Dropdown
Dynamic Input
Dynamic Input is the most common input type in a Playbook - it allows for both static and dynamic data to be used as an input for a Task. This feature can help you transfer data from one Task to another in a Playbook and chain Tasks together.
Static Data: Enter in the values that match the data type into the text area
Dynamic Data: Enable the dynamic toggle and enter the corresponding JSON Path of the dynamic data. This JSON Path should point to a data source that is dynamically updated in the Playbook. Optionally, you can apply regular expressions on this data through the Regex Filter tab to filter the JSON data.
Data Formatter
Data Formatter input allows you to use formatted dynamic data as an input for a Task. It is similar to Dynamic Input - but in addition, the Data Formatter allows you to perform complex data transformation on the data with our library of Jinja filters. With this, you can customize and create very specific dynamic inputs for a Task. The Quick Start guide in the Data Formatter contains more information on how to use this feature.
HTML Editor / Data Formatter
As the name suggests, this input method is the combination of HTML and Data Formatter. This input type is the same as Data Formatter, with the added ability to switch between the Data Formatter editor and a HTML editor. This allows you to build customized HTML templates that contain formatted dynamic fields that update automatically.
Date / Time Input
Date / Time input allows you to select a specific Date and Time as a static input for a Task. If your workflow requires a dynamic Date/Time input, you have the option to use the Data Formatter to select and format a dynamic input as the Date/Time input for a Task.
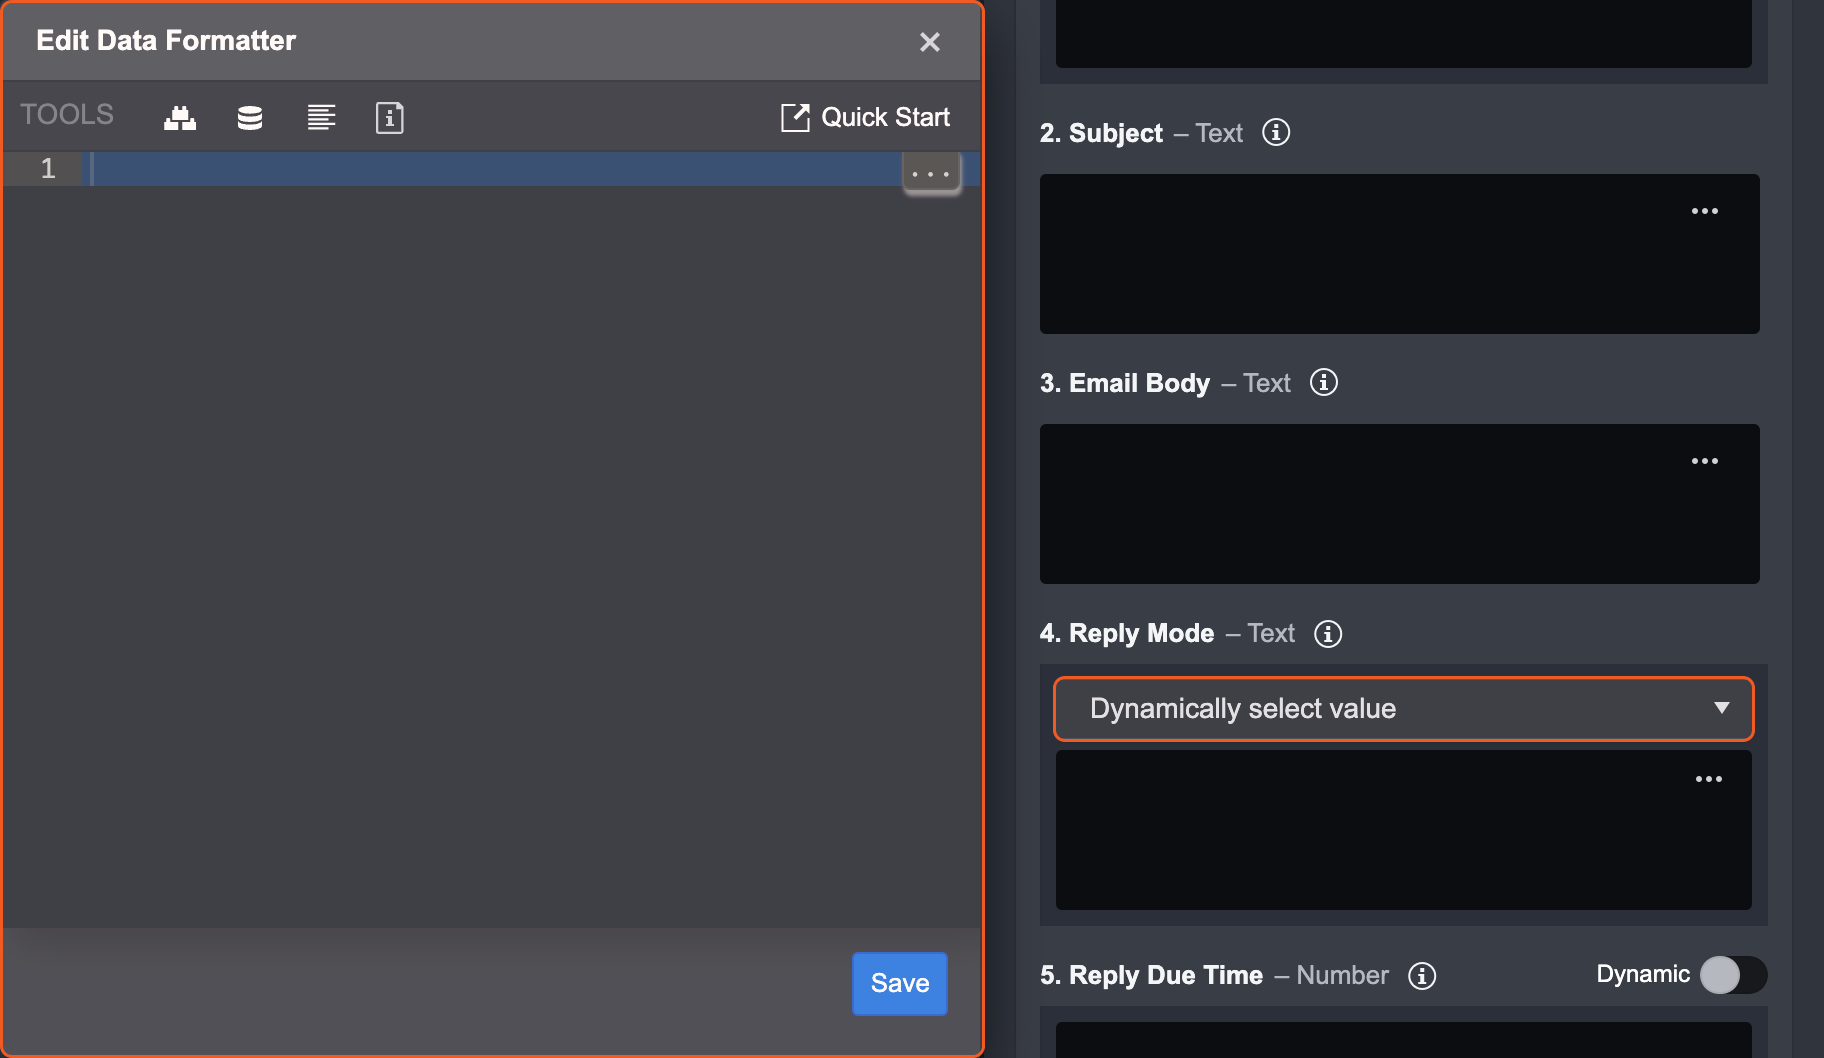
Dropdown Input
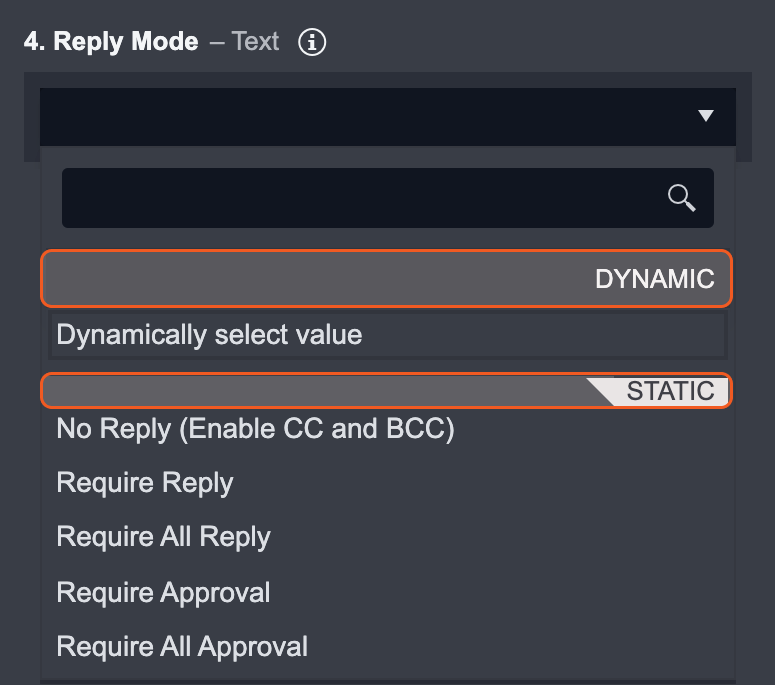
Static Data: Dropdown input allows you to select a value from a predefined list as an input for a Task.
Dynamic Data: You can define a JSON path or formatted data that outputs a value corresponding to one of the dropdown options. The playbook will dynamically select the matching value (from the JSON path or formatted data) in the dropdown when run.
Control Flow
All playbook tasks have an order of execution that determines which playbook task runs first, how often they run, whether they loop, etc. You can set a task to run if a condition is satisfied, thus creating branching flows; tasks can also run in a loop. The order of execution of playbook tasks is called a Control Flow.
There are a few types of Control Flow used in D3: sequencing, conditional branching, looping, wait for all, wait for any, and nesting.
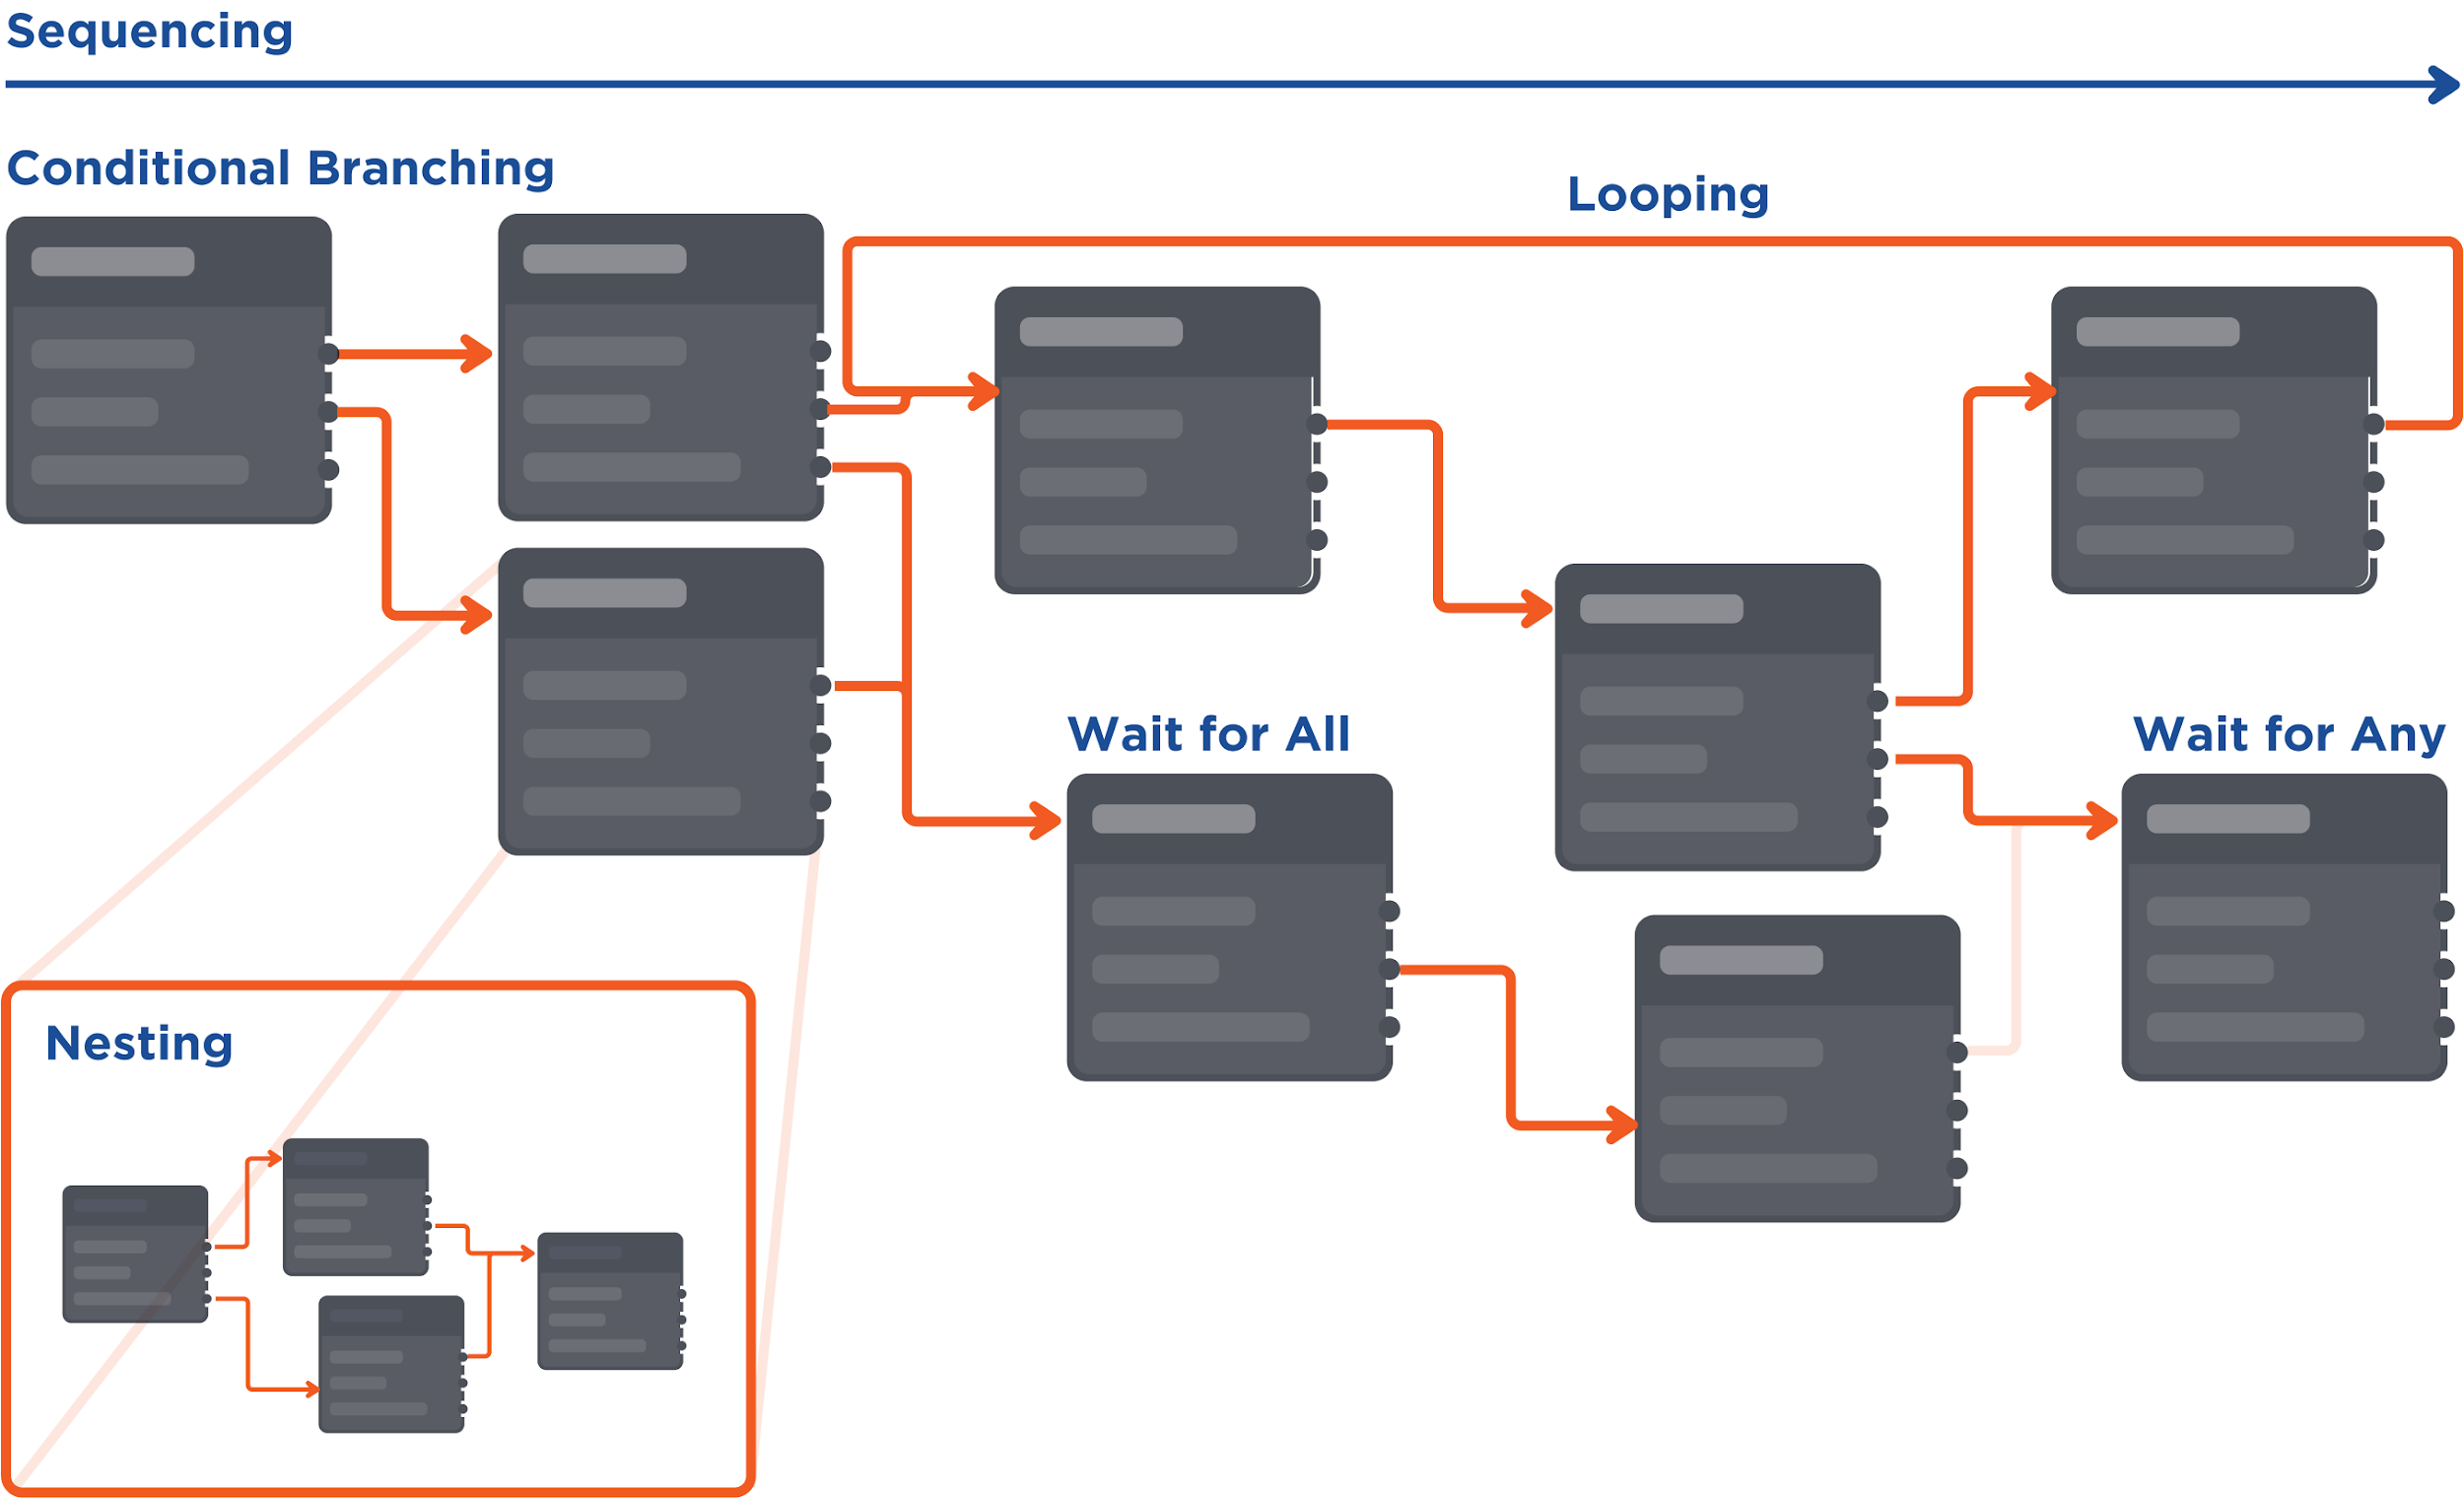
Control Flows are represented by a directional line within the playbook. A playbook task will be triggered to run after the directly preceding task finished running. All playbook tasks can only be triggered and run once, except for when you set tasks to run in a loop.
There are a few examples of different types of Control Flow that are often used in D3:
Control Flow Type | Example |
|---|---|
SequencingIn the Playbook View, Playbook Tasks are executed from left to right. Any Task that has completed is marked as Done. 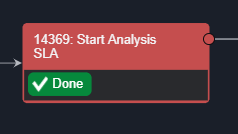 | Initial Analysis has a forward arrow that links to Start Analysis. From Start Analysis, two arrows branch out to 2 different Tasks. 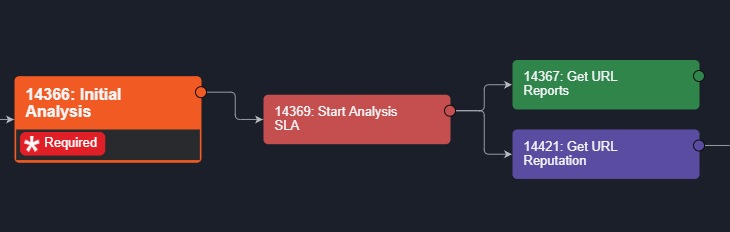 Once the Initial Analysis has been executed, the following Tasks are triggered to run. 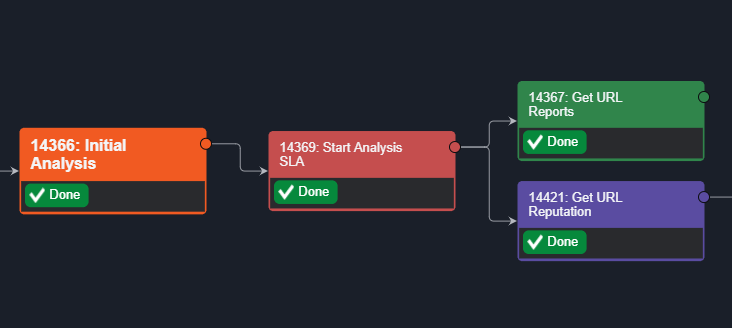 |
Wait for AllTasks from different branches can be connected, and converge to one single Task. When you set that converged Task as Wait For All, it will only run when all the preceding Tasks connected to it have finished running. | When the Stage Task (Summary) is set as Wait for All, all three preceding tasks will need to be completed for the Summary Stage Task to run. |
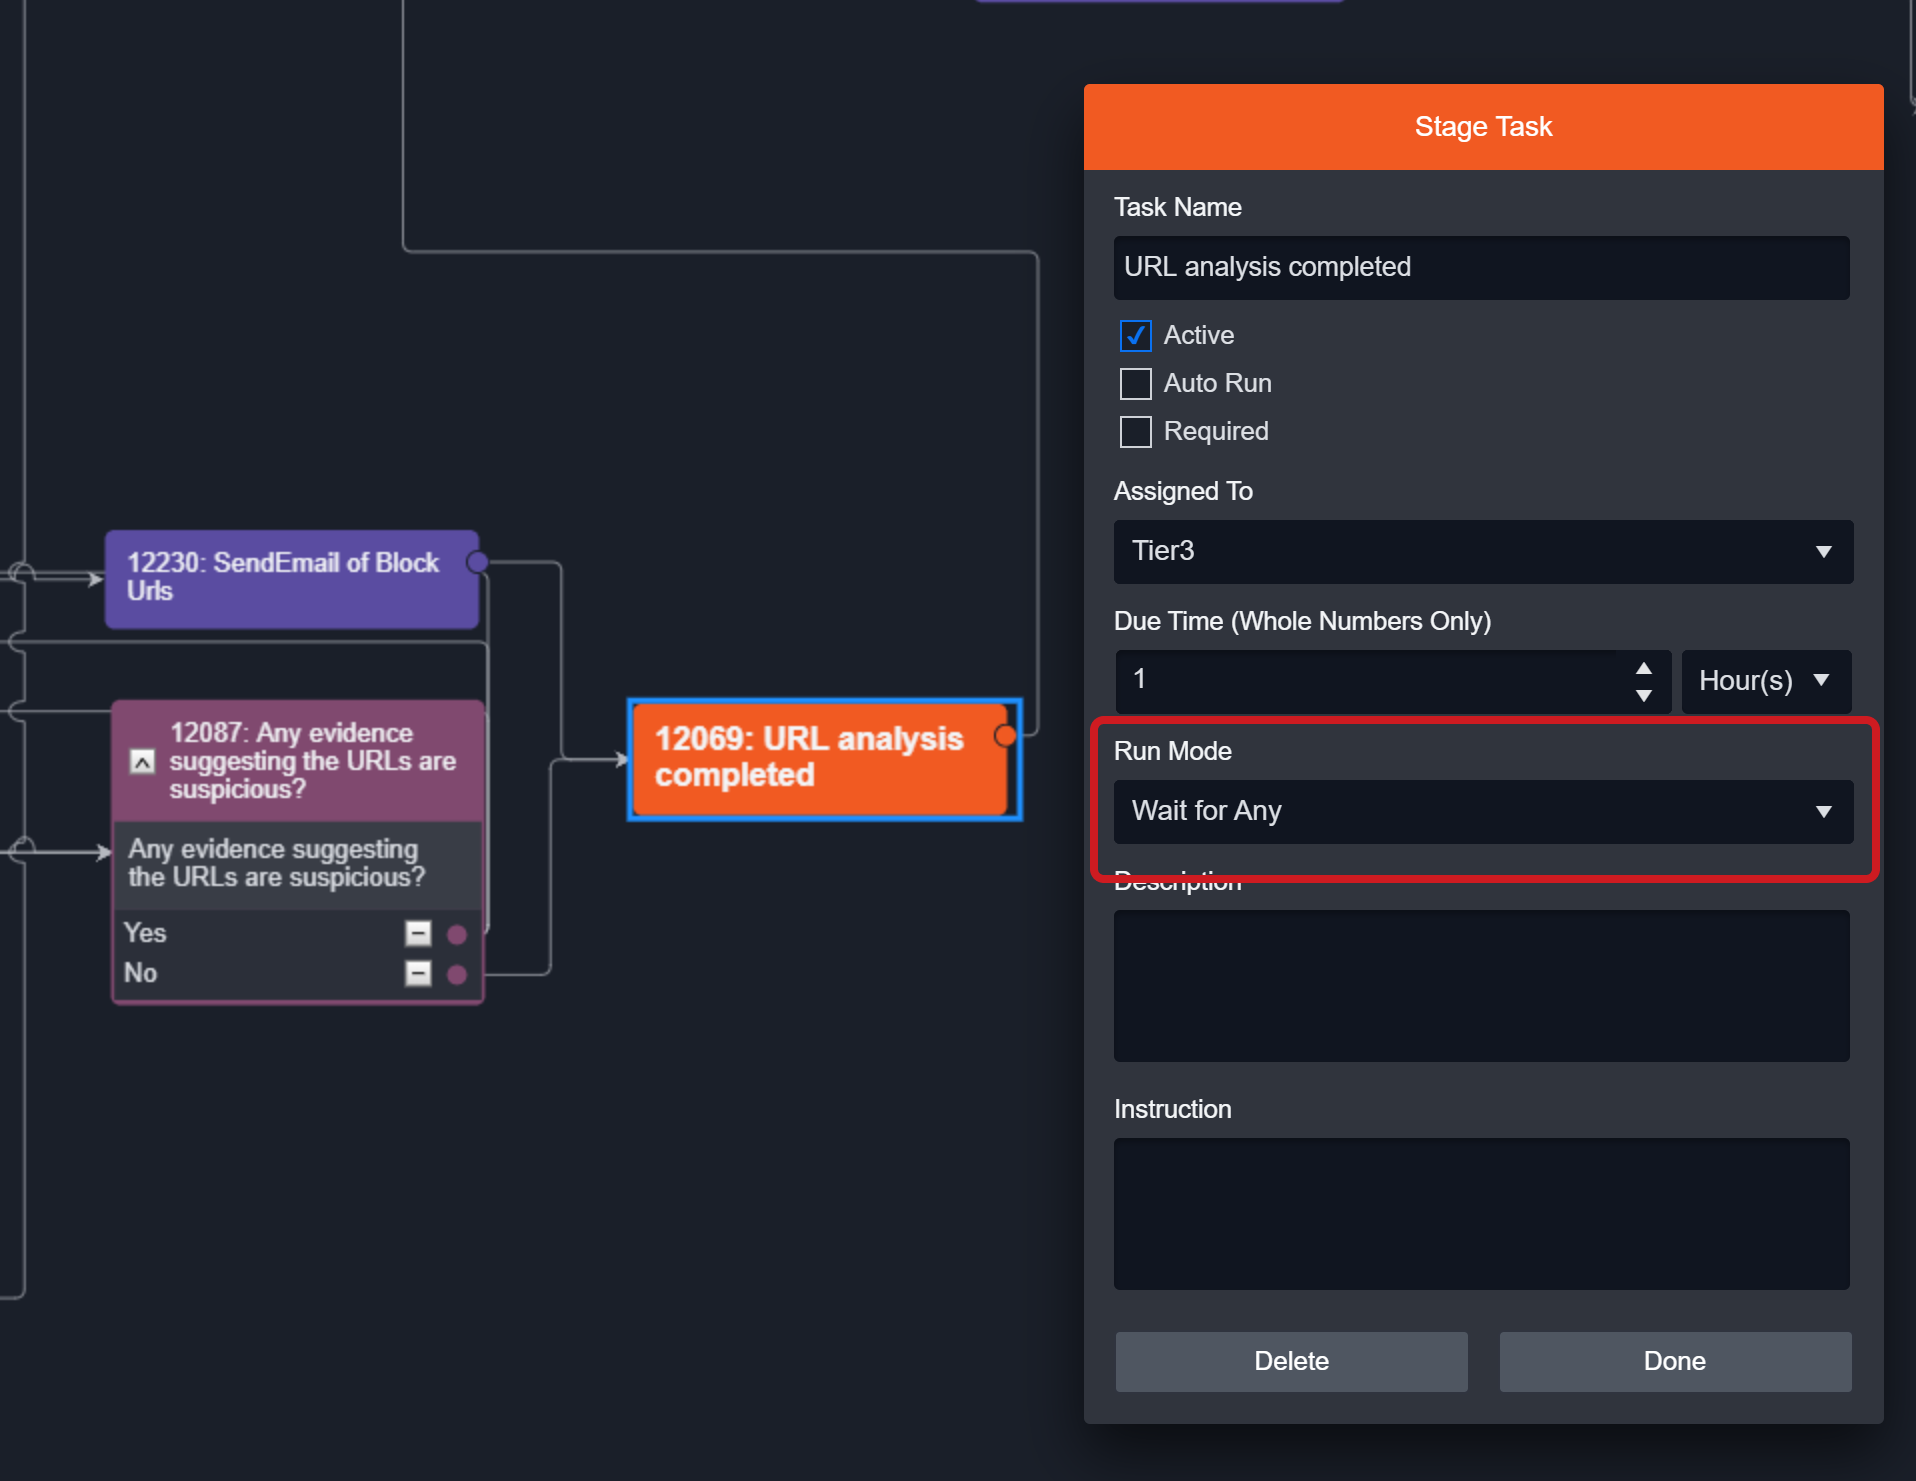
Wait for AnyWhen you set that converged Task as Wait For Any, it can run when any one of the preceding Tasks connected to it has finished running. You can set a Task to either option: Wait for Any, Run Once Wait for Any, Run Always | The “URL analysis completed” Task is set to Wait for Any. When either of its two preceding tasks is completed, the “URL analysis completed” Task will be triggered. |
Conditional BranchingThis flow is created when you set up options or conditions in the Conditional Task. Satisfying each option will trigger a flow accordingly, allowing you to create multiple branches from one original Task. | The Conditional Task “Has Source IP addresses” shows a branching workflow based on a simple True or False logic. When an option is selected, the following task(s) will be triggered. For example, if option True is satisfied, the task Init Source IP counter will be triggered. 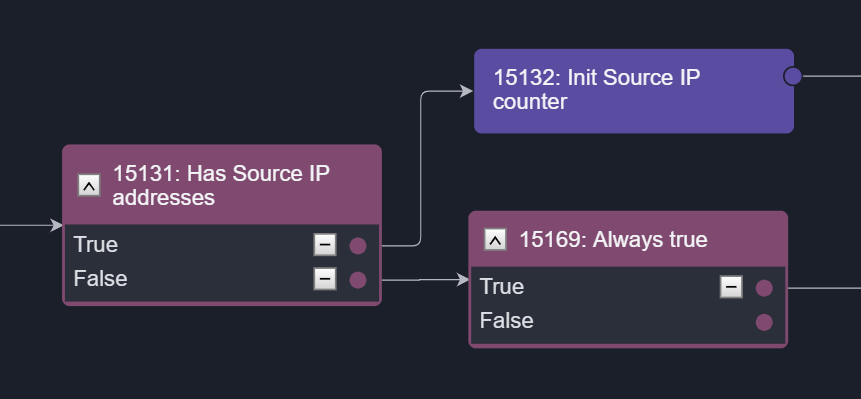 |
Condition-Controlled LoopsAn option that is branched out from a Conditional Task can be linked back to a preceding task, creating a loop that runs until a condition is met. A limit can be set for the number of loops that can be run in a Playbook to avoid infinite loops. | In the example below, the Delay Execution for 1 minute and Check Status Tasks will be repeated until the option in Check if Search is completed is True. 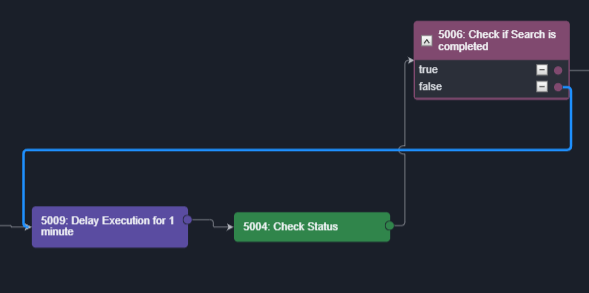 |
NestingA command that uses the Codeless Playbook Implementation method can be reused as a nested Command Task in another playbook. By nesting commands, you can organize and divide large playbooks into smaller and more manageable commands. Nested playbooks are differentiated from normal command tasks by the link icon that appears on the task node. Click this icon to access the underlying Playbook workflow. | The example below shows an Incident Playbook using a nested Command with Playbook. 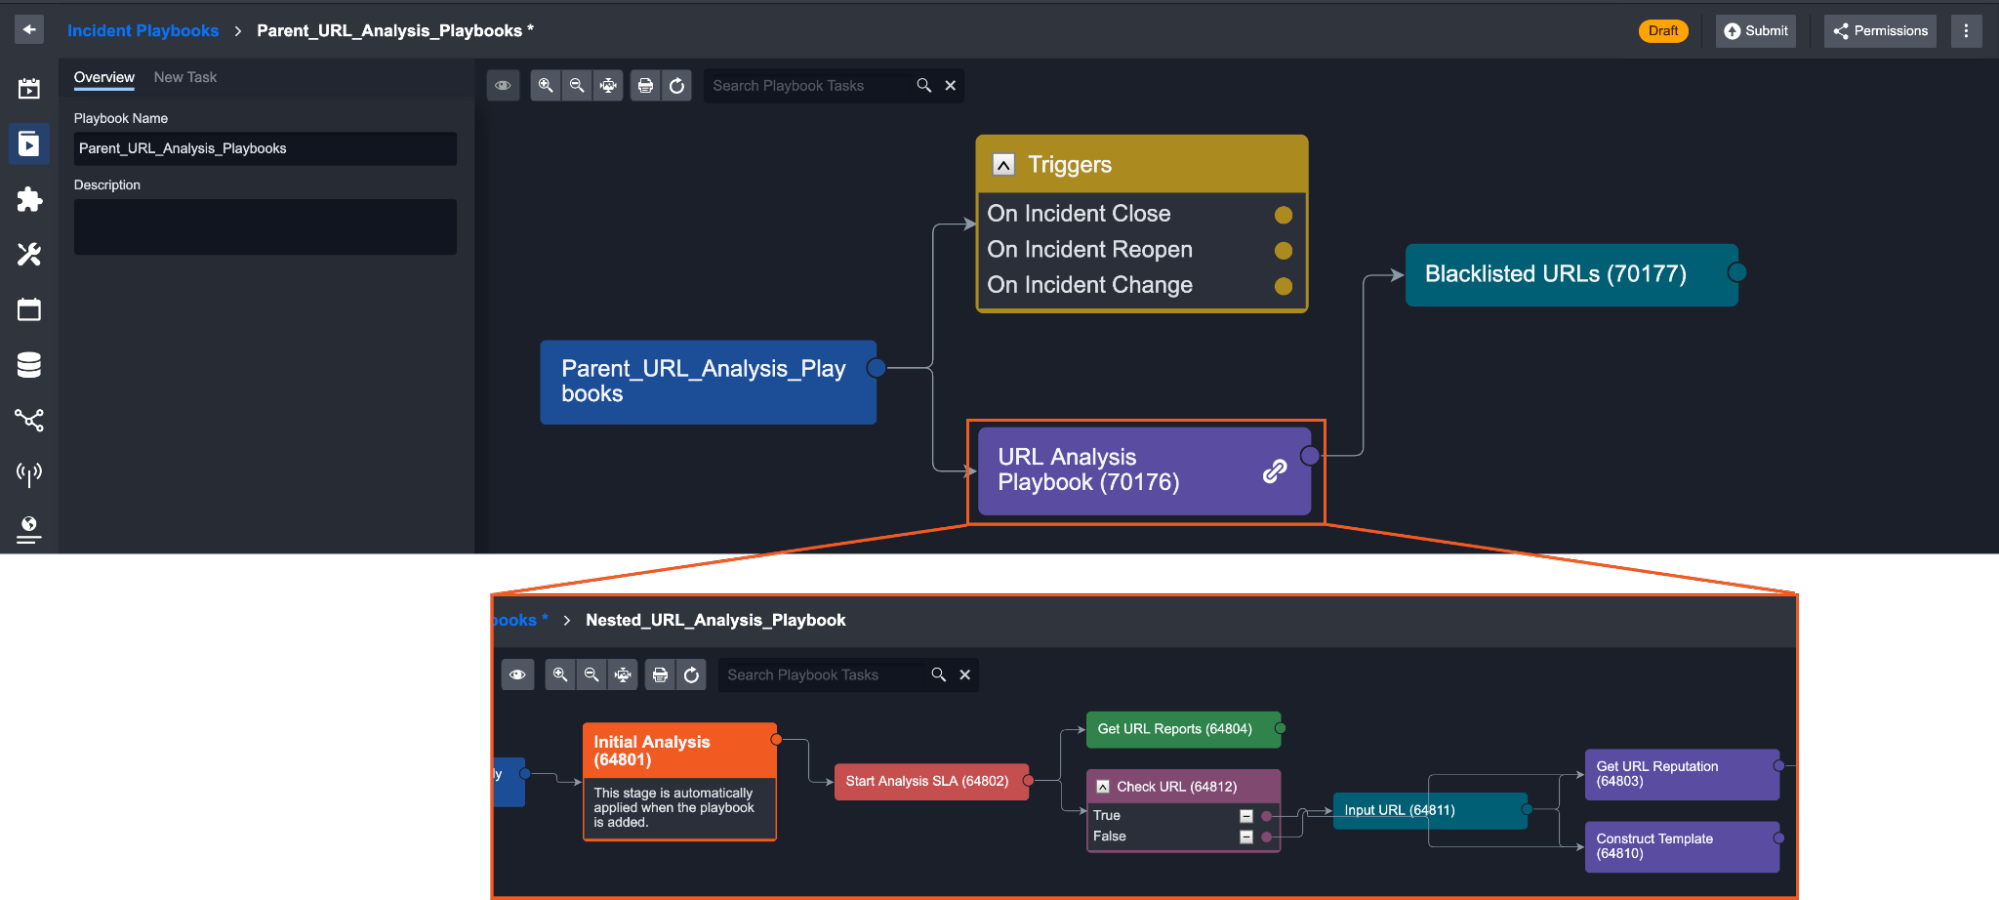 |
Task Options
Every task has a few options for its run, to ensure the smooth configuration of the playbook. This can include: Active, Auto Run, Required, Stop on Error, and Long Run.
Active | Activate or deactivate the task |
|---|---|
Auto Run | This Task will proceed automatically after the run of the previous task. When Auto-run is checked, the Required, Assigned To and Due Time fields will be hidden. |
Required | The task will be required to be manually executed by an assigned user or group of users. Required Tasks will appear in the Pending Tasks tab of the Investigation Dashboard |
Stop on Error | Stop the playbook run if this task returns an error. Stop on error is a good option for debugging your playbook. If you plan to re-submit your playbook, you can replace and re-run the new playbook on existing incident playbooks that have stopped. This can be done in the Incident Workspace. |
Long Run | Improves the performance of parallel processes of playbook tasks. Recommended only for resource-intensive tasks. Reader Note The Long Run checkbox is only available to Python-implemented commands. Long Run-enabled playbook tasks are exempted from taking up quota in the resource pool – improving the performance of parallel computing in a playbook. If this setting is not enabled, the Python task will default to a runtime of 10 minutes, after which the process will be stopped. By default, there is no runtime limit if this setting is enabled. It is recommended to only enable this feature when necessary, i.e., for resource-intensive tasks. |
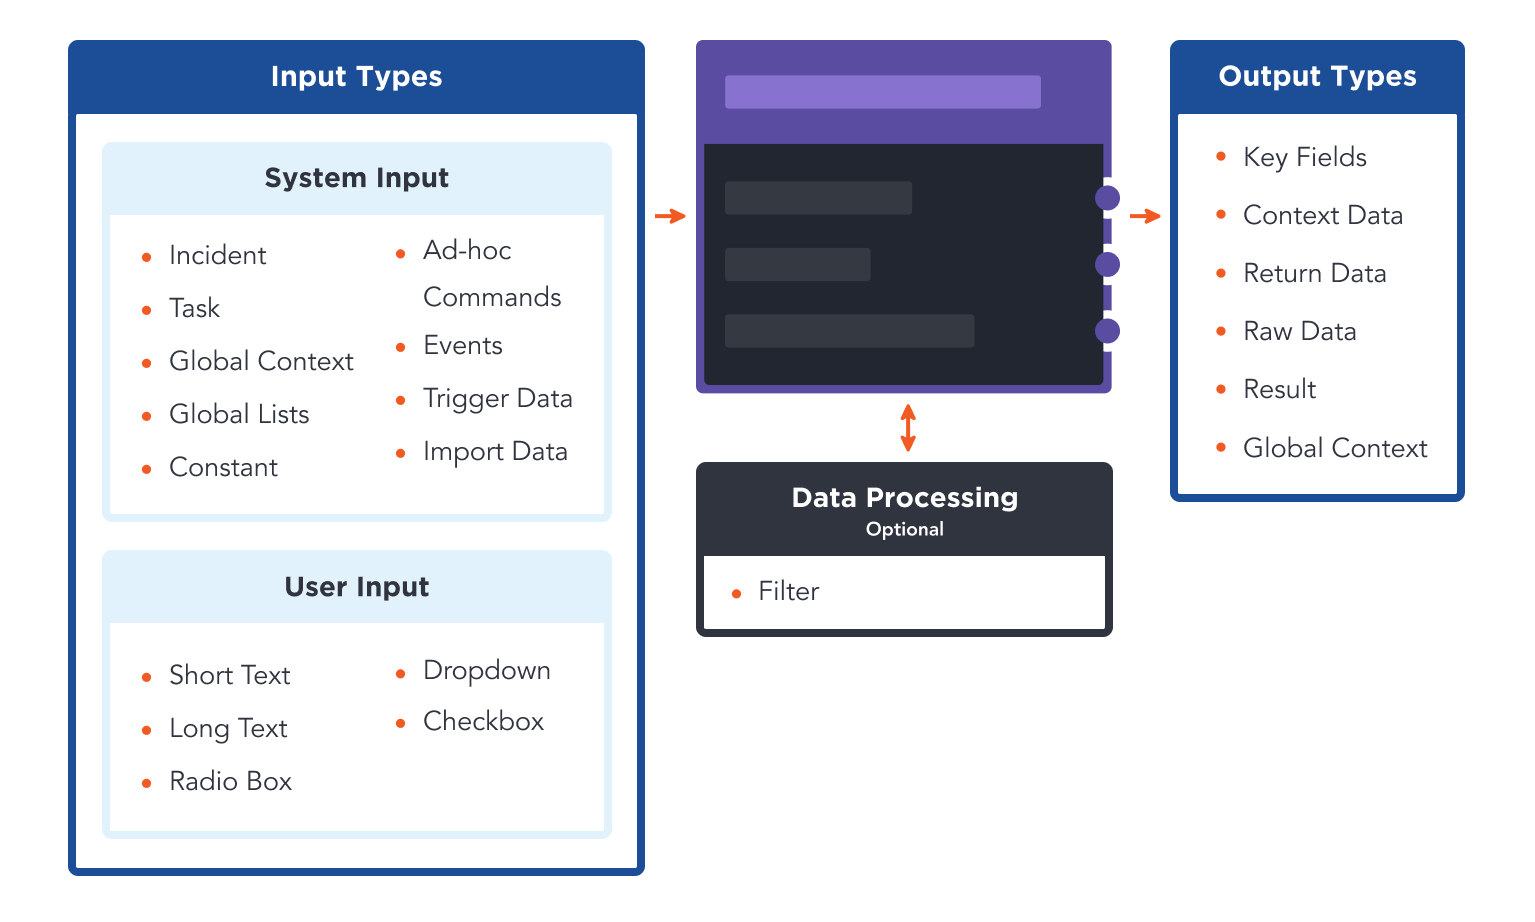
Output
There are five types of task output. The output of each task in runtime is yielded in the formats: Output Data, Context Data, Result, Return, and Raw Data. If the playbook task encounters an error, there will also be an Error tab. After running a playbook, you can click on each task to view the task output details.
Key Fields The key pieces of information that are extracted from the output data. | 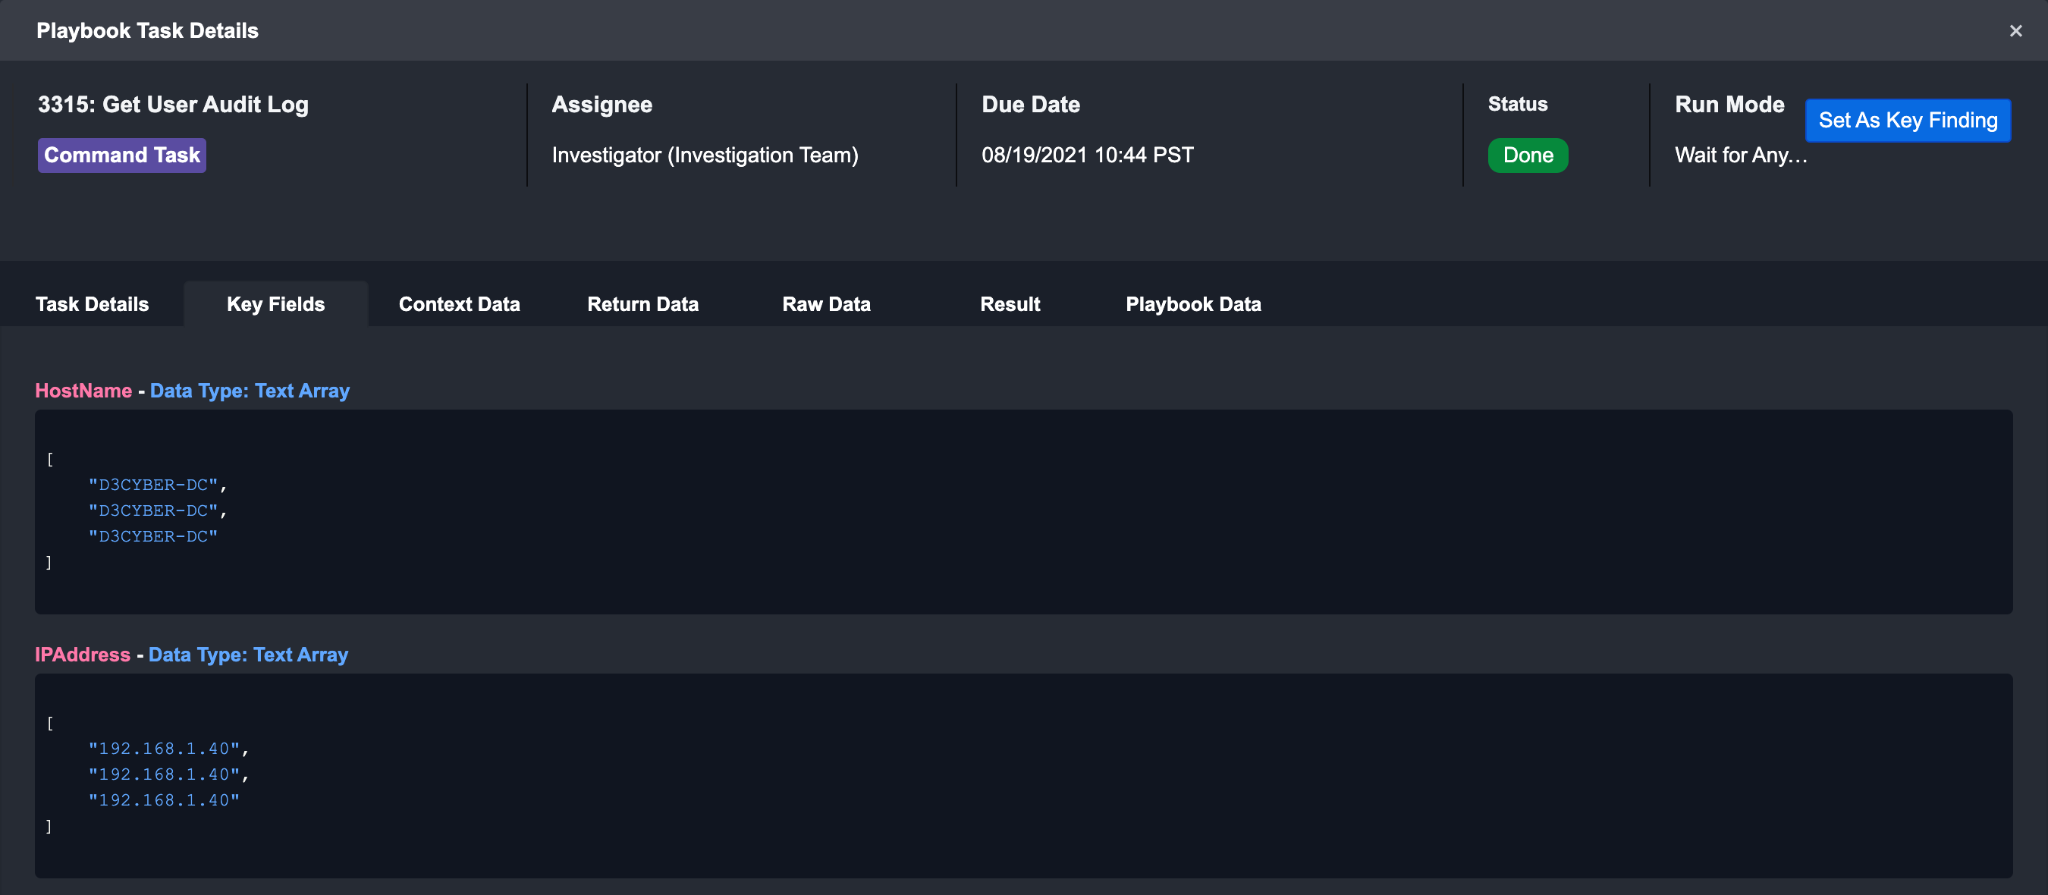 |
Context Data Context data is the raw data that has been formatted into a structured JSON object format, which can then be stored in the Playbook for data sharing | 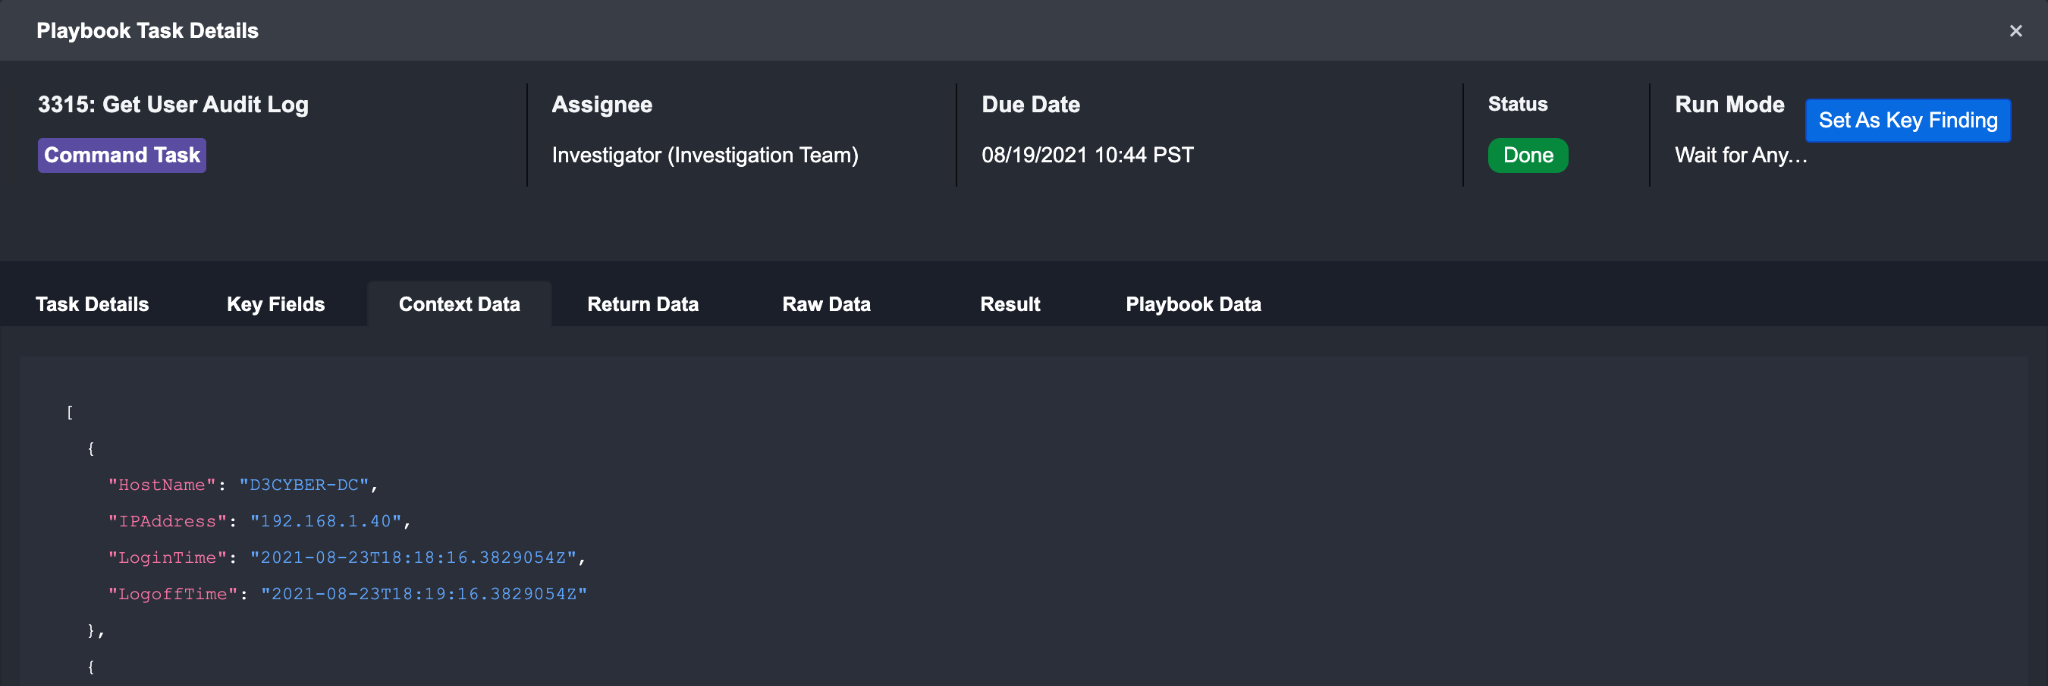 |
Return Data Return data shows the success/failure status of a Task for Integration Commands. For transformation and condition Commands, the Return data is specified with corresponding output data types. | 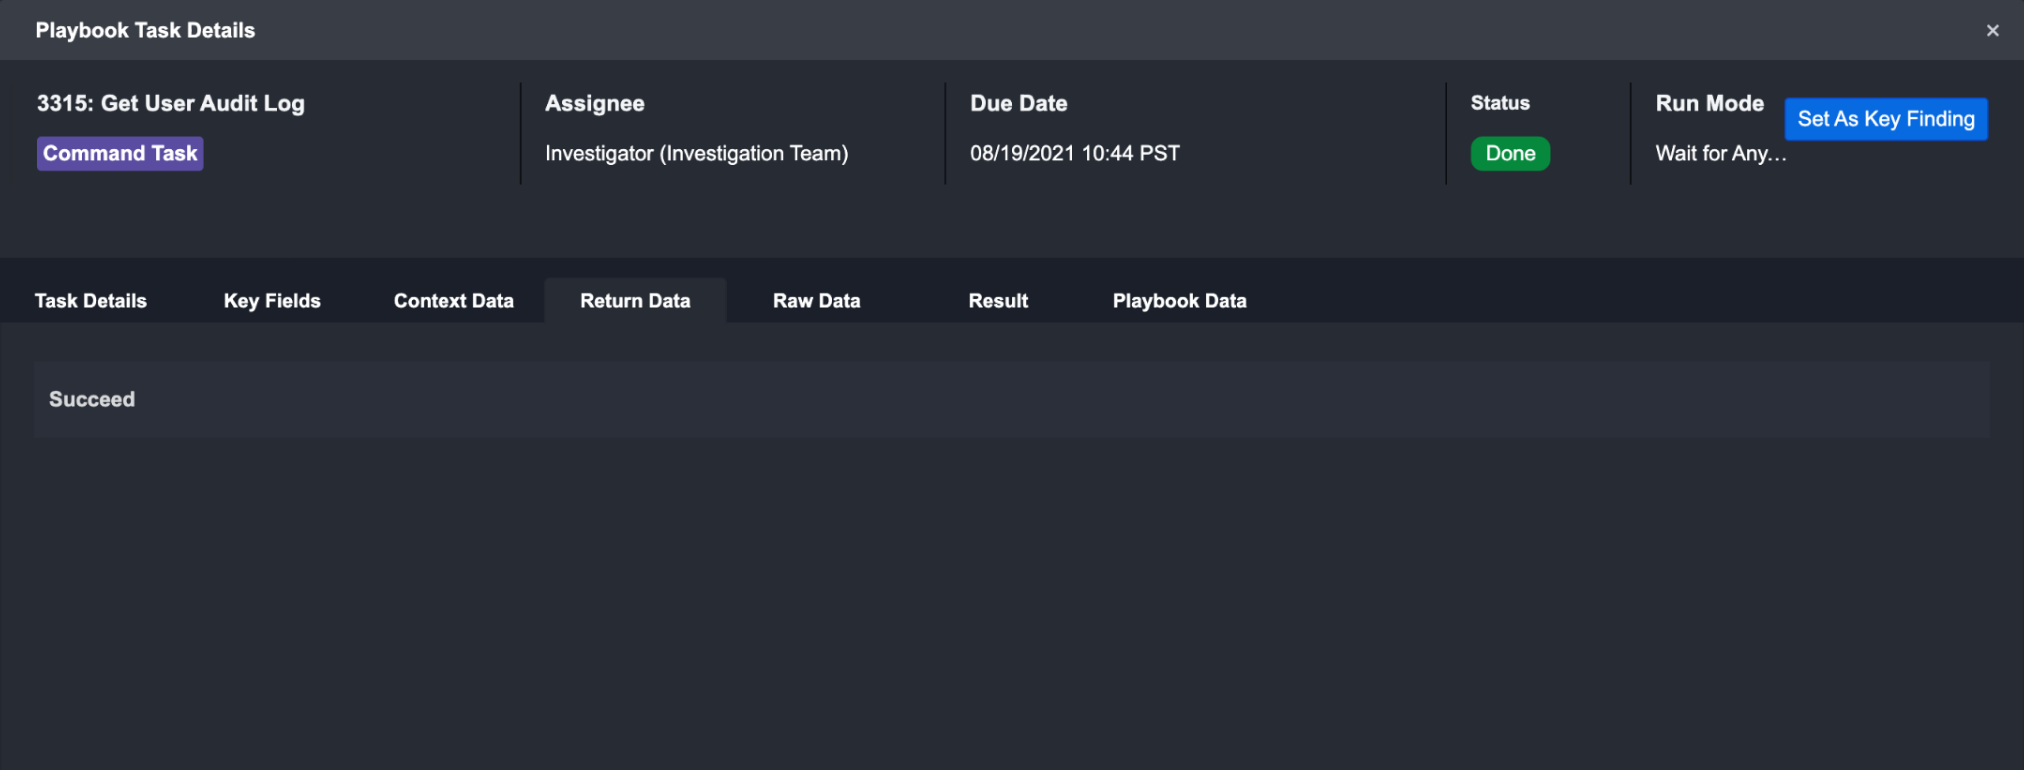 |
Raw Data Raw data shows the unformatted and raw information of external events provided by third-party vendors. | 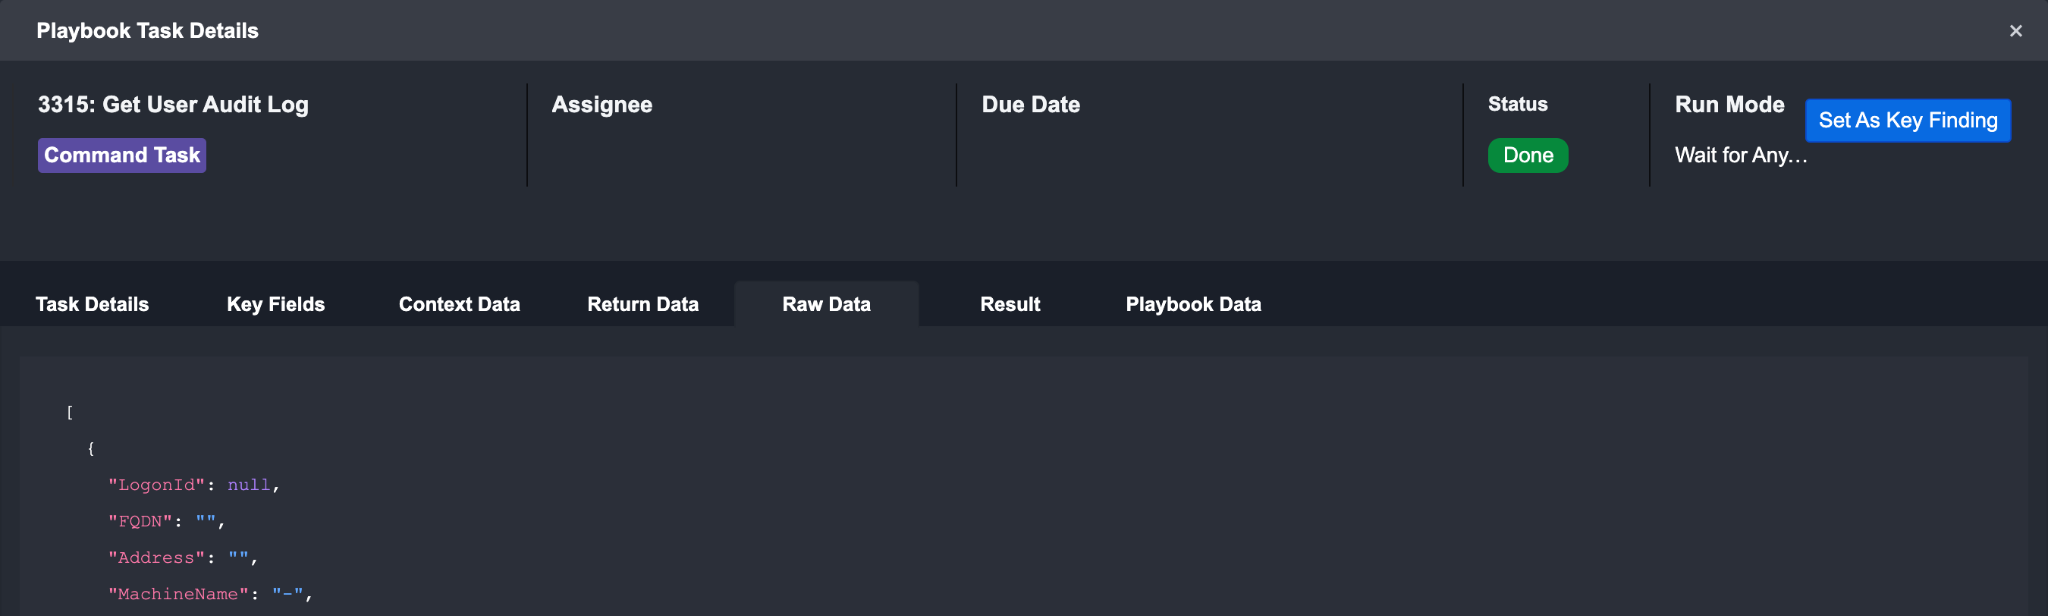 |
Result Result data is formatted in a reader-friendly HTML table. | 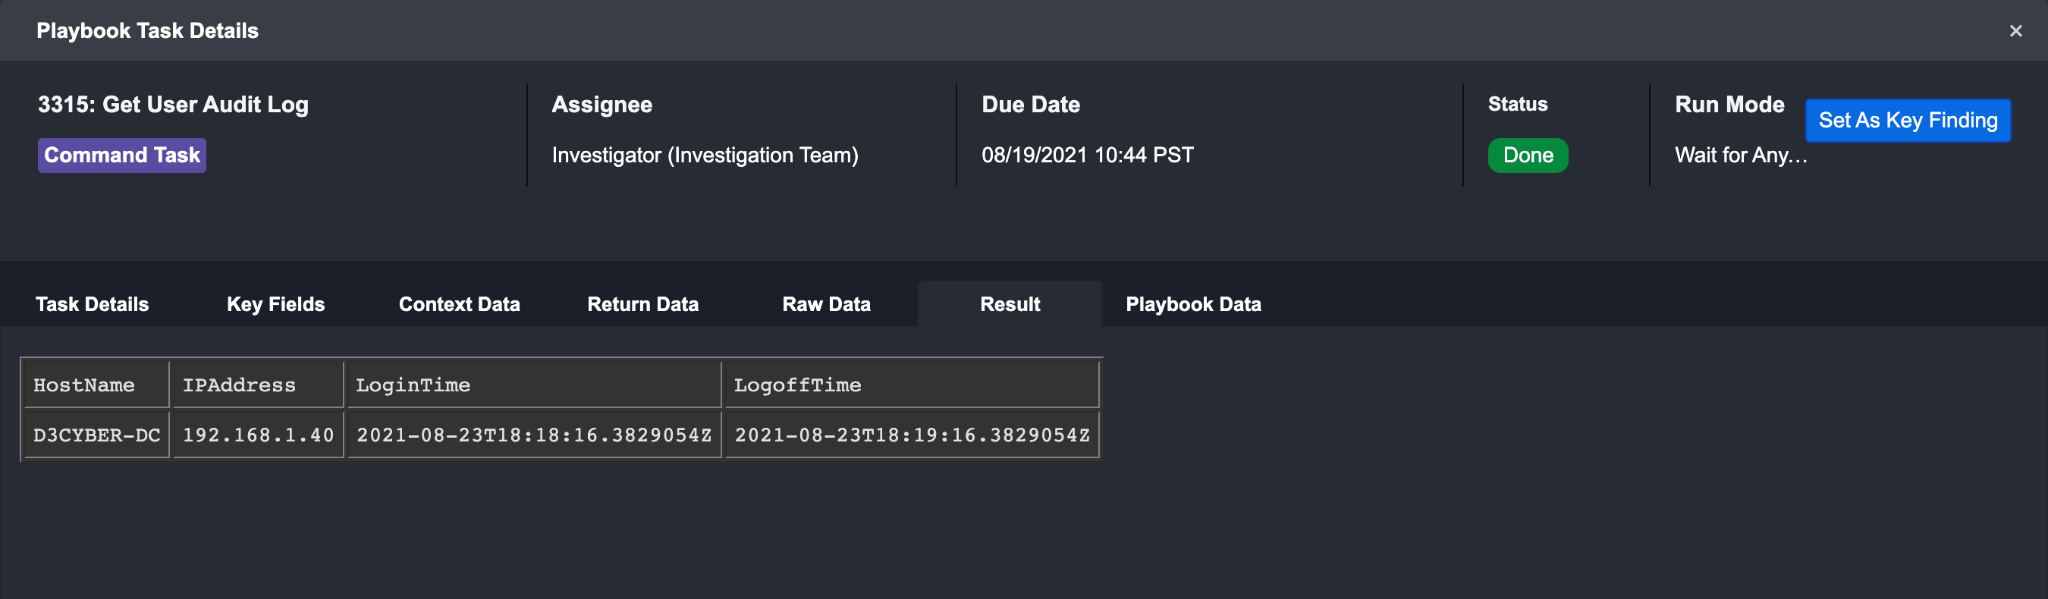 |
Error Data Error data of each task can be retrieved as an input of an error-handling Task. | 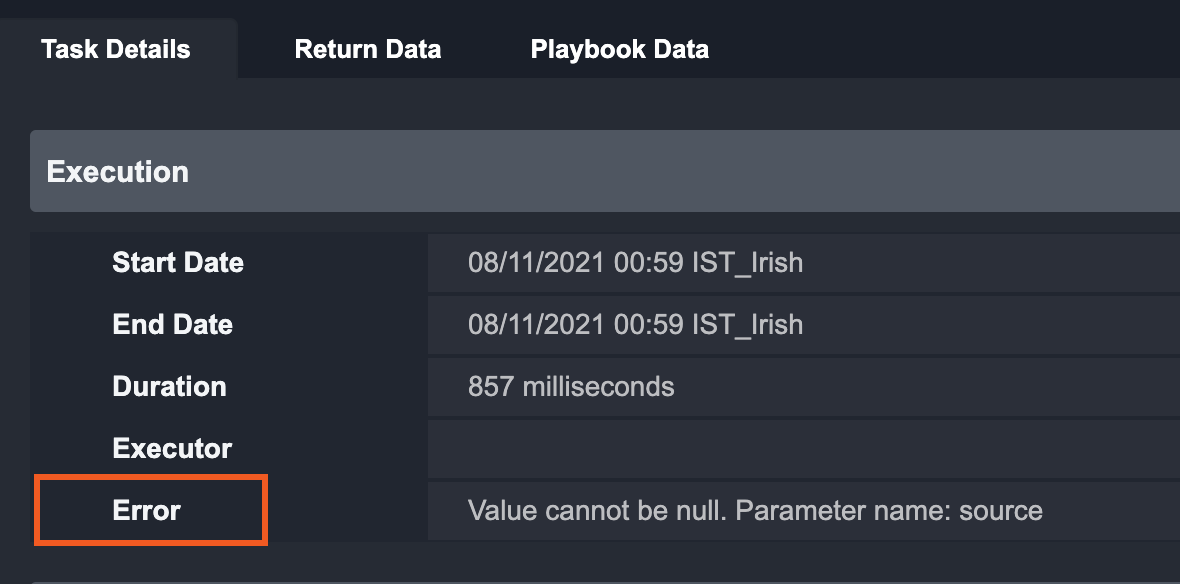 |
Task Types
As mentioned above, there are 9 different types of tasks that you can use in playbooks. Each task has its own unique function and use case, which we will discuss below.

Command Task
Command task is one of the most important task types in D3 SOAR. The command task allows you to utilize D3’s library of built-in commands and 2000+ integration commands to perform tasks including data processing, data transformation, system actions and much more. It is essential to every playbook as it connects our system with third-party integrations.
Our system has four different types of commands:
Third-party integration commands
System Commands
Utility Commands
Cyber Commands
In addition to the built-in commands, you can build your own custom commands with Python or D3’s Codeless Playbook Editor.
All Command Tasks have the following basic elements:
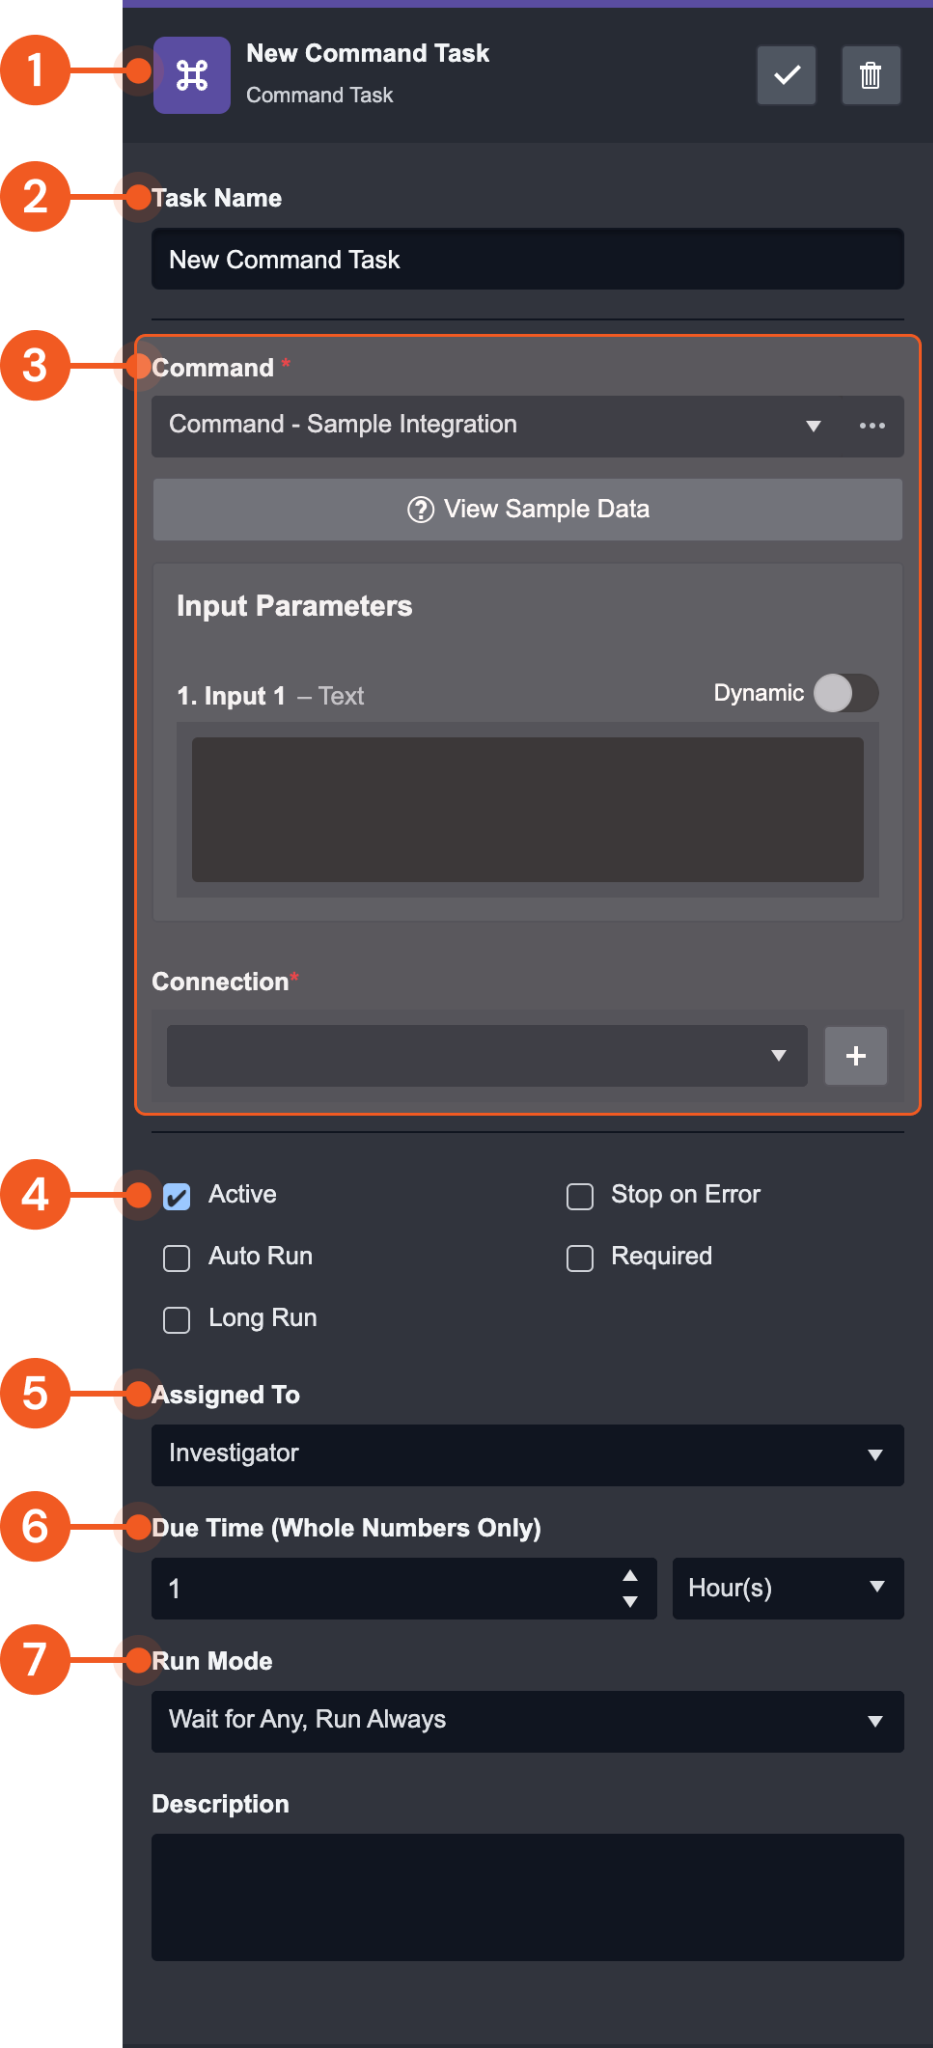
Task Info & Action Bar: Displays the Task’s name, type, and actions you can take (Save or Delete).
Task Name
Task Specific Panel: Displays task-specific controls. This area changes depending on what type of Task you selected. In this case, it shows the Command inputs because the Command Task is selected.
Run Checkboxes:
Active: Activate this Task.
Stop on Error: Stops the playbook run if this task returns an error
Auto-run: Trigger the Task to run automatically.
When Auto-run is checked, the Required, Assigned To and Due Time fields will be hidden.Required: The task will be required to be manually executed by an assigned user or group of users.
Required Tasks will appear in the Pending Tasks tab of the Investigation Dashboard.Long Run: Improves the performance of parallel processes of playbook tasks. Recommended only for resource-intensive tasks.
Assigned To: Assign a User, Role or Group to execute the Task.
Due Time: Define the time period for the Task to be executed. Tasks that haven’t been executed after this time period become overdue.
Run Mode: Select from the dropdown list with 2 main types of Control Flows:
Wait for Any, Run Always / Once
Wait for All
Reader Note
The Long Run checkbox is only available to Python-implemented commands. Long Run-enabled playbook tasks are exempted from taking up quota in the resource pool – improving the performance of parallel computing in a playbook. If this setting is not enabled, the Python task will default to a runtime of 10 minutes, after which the process will be stopped. By default, there is no runtime limit if this setting is enabled. It is recommended to only enable this feature when necessary, i.e., for resource-intensive tasks.
Types of Commands
Command Type | Details | Examples |
Integration Commands | Commands available from third-party providers | - Get URL Report - VirusTotal - Get IP Risk Score - Maxmind - Create Ticket - ServiceNow - Block URLs - Palo Alto Firewall - Query DataDog Events - DataDog |
Basic Utility | Commands that enable simple processing on the following data types: Text Number Boolean DateTime Text Array Number Array Boolean Array DateTime Array JSON Array JSON Object File File Array | - Append Text |
Cyber Utility | Commands that perform cyber-specific data processing. | - Extract Artifacts From Excel File |
System Utility | Predefined Commands that perform actions on system objects. | - Close Incident |
Nesting
A playbook functioning as a custom command with inputs and outputs which can be used in one or many other playbooks is called a nested playbook. It is very common that many playbooks share one or more the same small segments of the workflow. In order to reduce the repetitive configuration of the workflows, nested playbooks can be configured to accommodate the need for reusability of playbooks. One of these use cases is IP enrichment across multiple threat intelligence tools.
To create a nested Playbook
The following steps demonstrate the process of creating a sample nested playbook for IP enrichment:
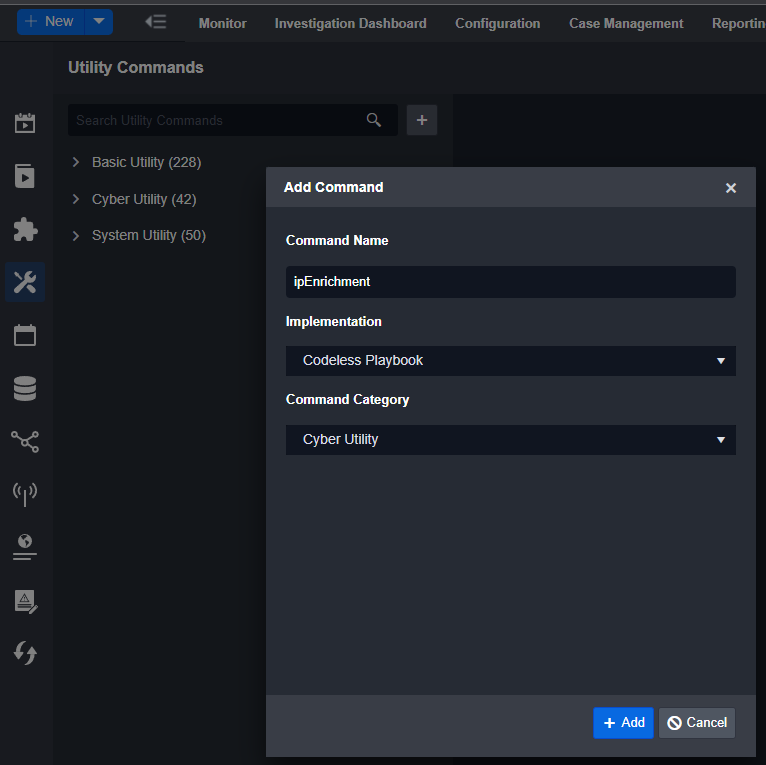
Step 1: Create a New Utility Command
Navigate to Configurations > Utility Command
Add a new command by clicking on +
Fill in the following details:
Command Name
ipEnrichmentImplementation
Codeless PlaybookCommand Category
Cyber Utility
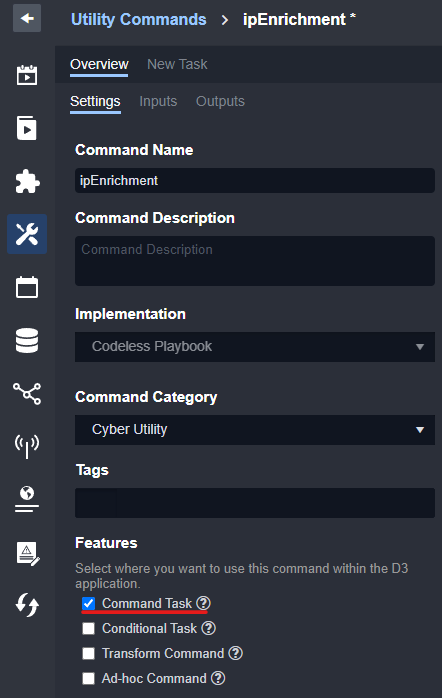
Step 2: Configure Command Setting, Inputs and Outputs
Ensure that Command Task under Features is selected to make it available for use as a Playbook command
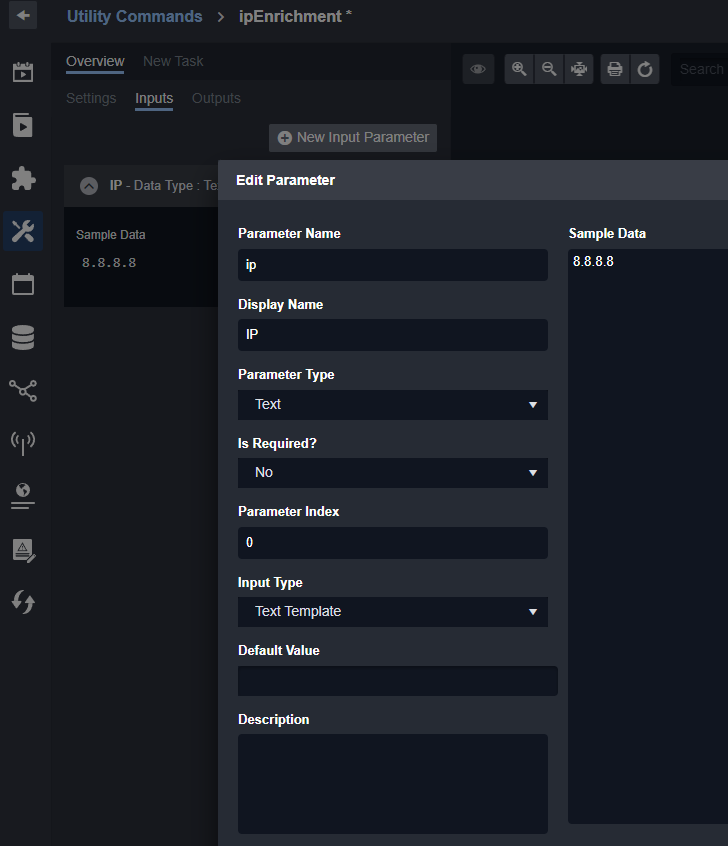
Navigate to Overview > Inputs tab, and add a new Input Parameter. Configure the fields as shown below:
Parameter Name
IpDisplay Name
IPParameter Type
TextIs Required?
NoParameter Index
0Input Type
Text TemplateDefault Value
(Leave empty)Description
(Leave empty)Sample Data
8.8.8.8
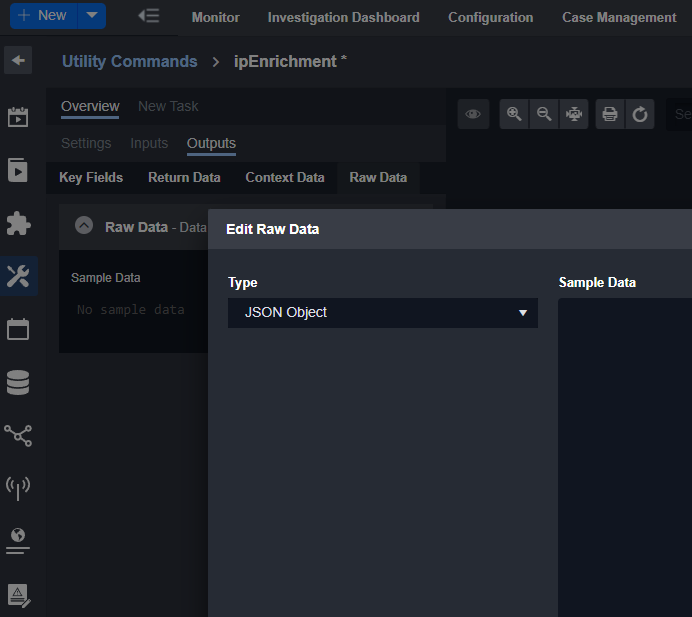
Navigate to Overview > Outputs tab, and select the Raw Data sub-tab
Change the Type to JSON Object
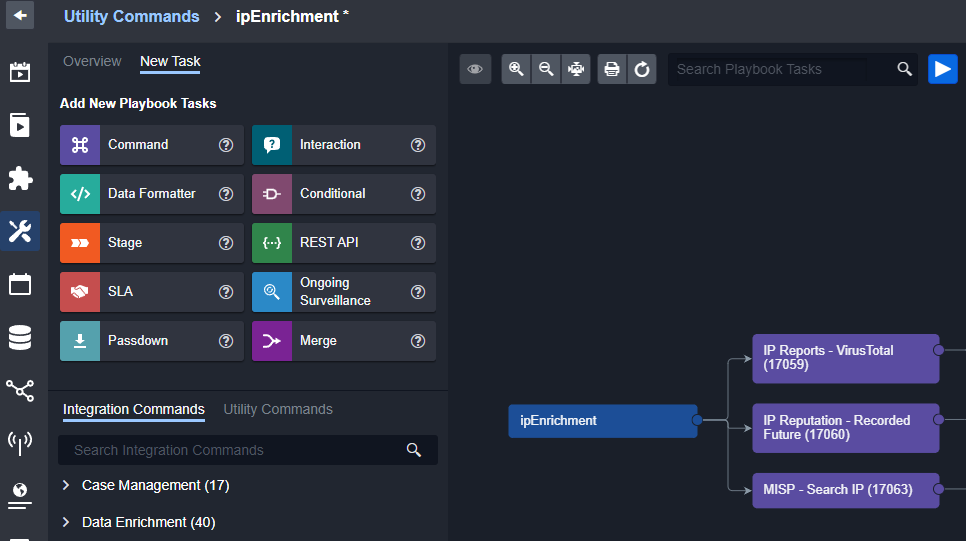
Step 3: Configure Playbook
Click on the New Task tab
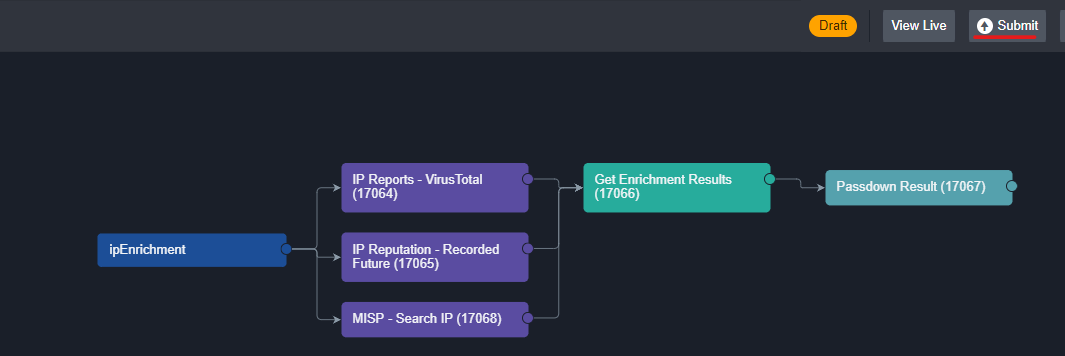
In the Playbook editor, drag and drop 3 commands tasks connecting to first node, and name the commands:
IP Reports - VirusTotal
IP Reputation - Recorded Future
MISP - Search IP
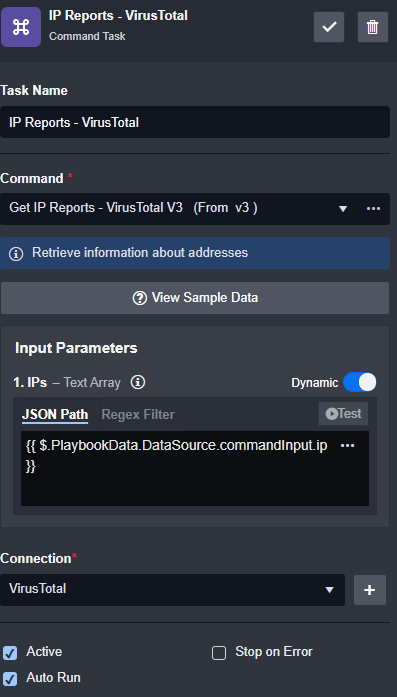
Within each command’s input parameter, choose corresponding connection, make it “Active” and “Auto Run”, and enable “Dynamic” JSON Path to {{ $.PlaybookData.DataSource.commandInput.ip }}
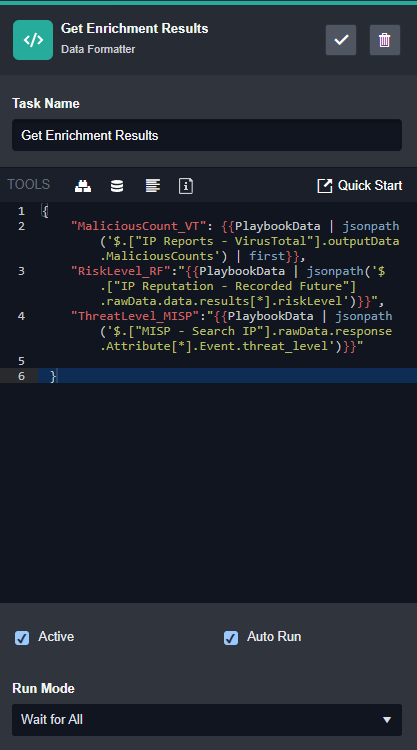
Add a Data Formatter task to consolidate the result as shown below, and ensure the “Run Mode” is set to “Wait for All”. This will ensure that this Data Formatter task only executes once the three previous commands finish execution.
CODE{ "MaliciousCount_VT": {{PlaybookData | jsonpath ('$.["IP Reports - VirusTotal"].outputData.MaliciousCounts') | first}}, "RiskLevel_RF": "{{PlaybookData | jsonpath ('$.["IP Reputation - Recorded Future"].rawData.data.results[*].risklevel')}}", "ThreatLevel_MISP": "{{PlaybookData | jsonpath ('$.["MISP - Search IP"].rawData.response.Attribute[*].Event.threat_level')}}" }
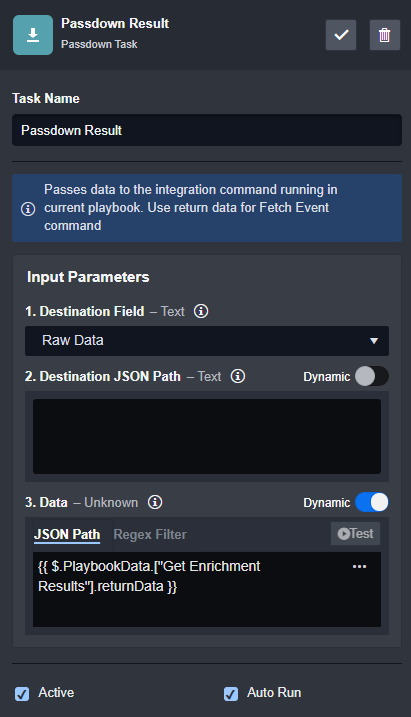
Add a passdown command to the end of the playbook to set the output parameter Raw Data in Step 1 with content that has been constructed in the previous step. Note: The Passdown task type is only available in the Event Playbook.
Step 4: Publish and use the Playbook
Click on Submit to commit and publish the Playbook command
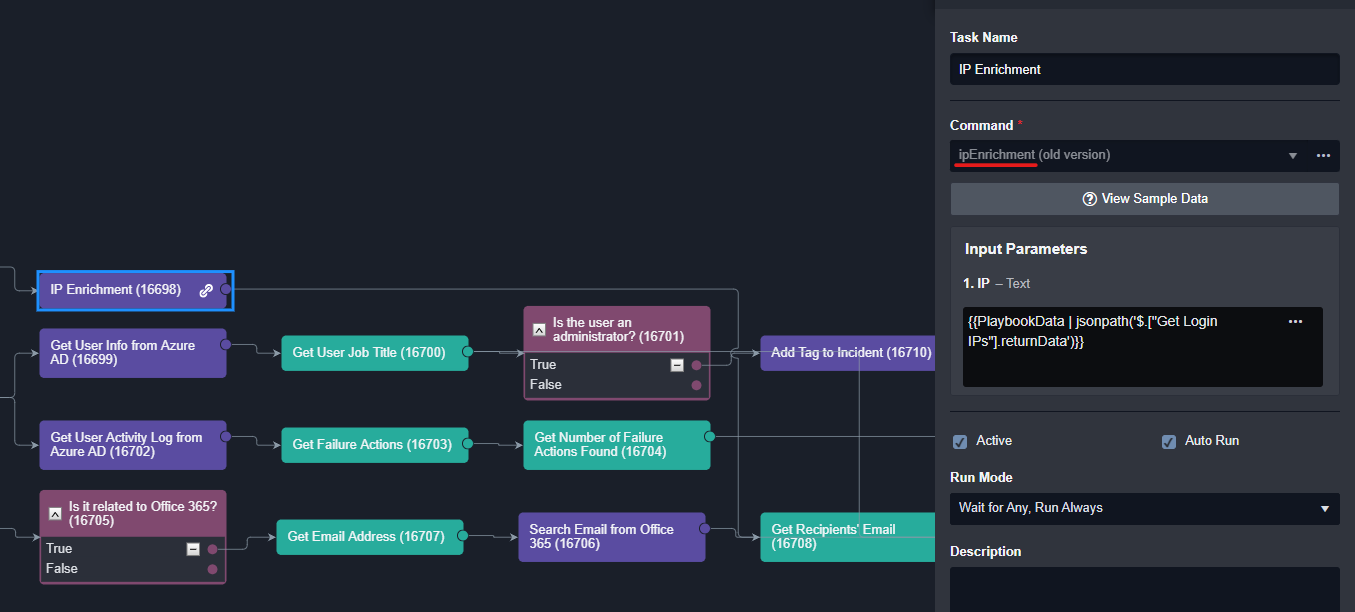
In other Playbooks (event/incident), you can now use this new command within a command task. The link sign 🔗 on the command playbook indicates that this command is using a nested playbook.
Data Formatter Task

The Data Formatter Task lets you perform complex data transformations to playbook data. You can use D3’s built-in data filter to format and select specific playbook data and view the resulting output. The resulting reformatted output can be used as inputs for subsequent playbook tasks.
The example below demonstrates how you can add a data formatter to an event playbook to clean up URL data output from a preceding task. We will create a script in data formatter that removes duplicate URLs and ensures each URL is in a standardized format.
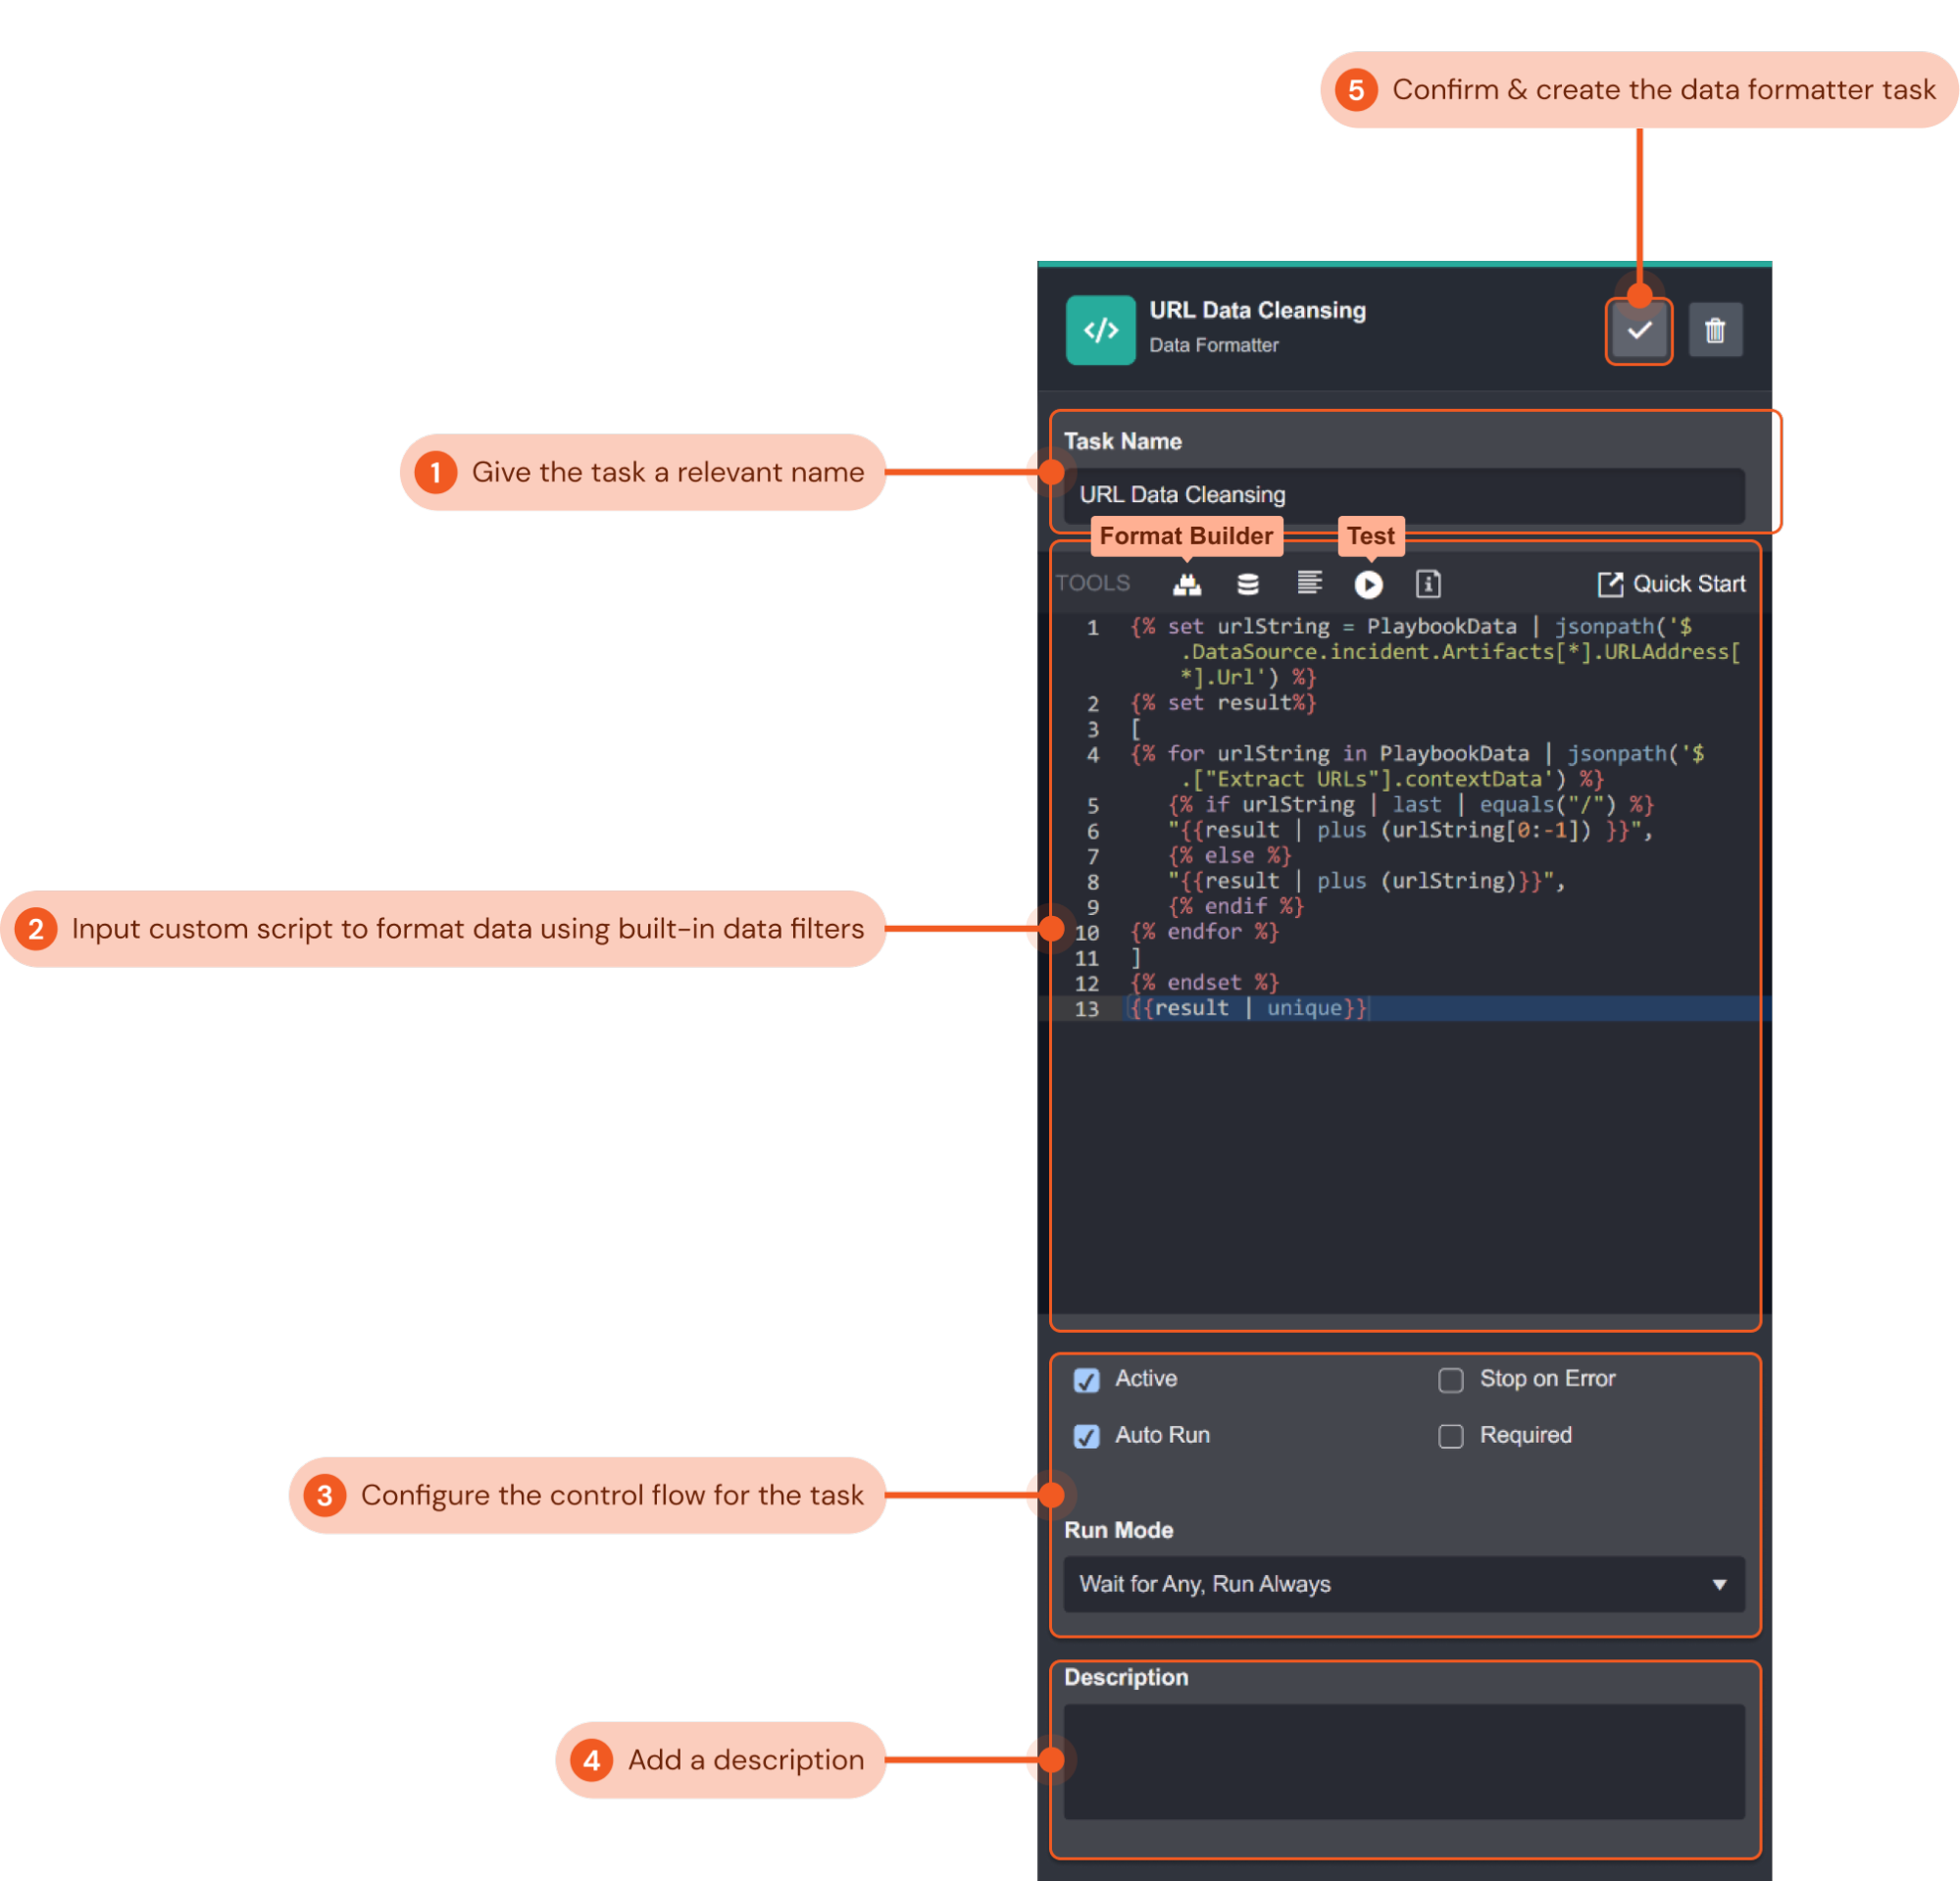
Give the task a relevant name that indicates what it does. In this example, we will name the task “URL Data Cleansing”.
Input a custom Jinja script to select and format data. You can use the format builder to help you build a script by selecting the data source and filters you would like to use. Refer to the Quick Start guide for in-depth documentation on the available filters. In the following example, the script that cleanses the raw data and parses it into a JSON array:
CODE{% set urlString = PlaybookData | jsonpath('$.DataSource.incident.Artifacts[*].URLAddress[*].Url') %} {% set result%} [ {% for urlString in PlaybookData | jsonpath('$.["Extract URLs"].contextData') %} {% if urlString | last | equals("/") %} "{{result | plus (urlString[0:-1]) }}", {% else %} "{{result | plus (urlString)}}", {% endif %} {% endfor %} ] {% endset %} {{result | unique}}You can click Test to run and view your script’s output. The Data Formatter Output pop-up displays a bug log to help you troubleshoot if necessary. For our example, the output data was:
CODE[ "http://amazon.com", "http://google.com", "http://abc.com", "http://xmr.pool.minergate.com" ]Configure the control flow for the command task. Use the tick boxes to configure if the command task is active, if it will auto run, and if it will stop when an error occurs. The dropdown menu lets you select the control flow for the task. Refer to Task Data Flow for more details. The configurations in this example ensure the command task is active, and will always auto-run when its preceding tasks have been completed.
Include a description for the data formatter task for future playbook editing reference if desired. We have not included one for this example.
Click the gray check mark button to confirm and create the command task.
Done!
Reader Note
In Jinja, data surrounded by double curly brackets
{{and}}indicate that it is dynamic data. When you use the format builder to select a data path for dynamic data, double curly brackets will surround the selected path by default. An example of input data for a Data Formatter task created with the format builder may look like this:JSON{ "Title":{{PlaybookData | jsonpath('$.["Sample Data"].returnData.Title')}}, "Description":{{PlaybookData | jsonpath('$.["Sample Data"].returnData.Description')}} }Due to the nature of Jinja’s formatting, input data with multiple sets of double curly brackets will be processed separately. This has caused some users’ input data to be formatted incorrectly by the Data Formatter. In the screenshot below, you can see that the output data is in a text format rather than a JSON format.
Instead, it is recommended to place just one set of double curly brackets around the entire input JSON data:
JSON{{ { "Title":PlaybookData | jsonpath('$.["Sample Data"].returnData.Title'), "Description":PlaybookData | jsonpath('$.["Sample Data"].returnData.Description') } }}The corrected input JSON object will output a properly formatted JSON object as shown in the screenshot below.
Success
Using a data formatter task in the event playbook editor, you have added a script that checks if a URL ends with /, and if so, removes / and checks for duplicate URLs. You have configured the data formatter task so that it will automatically run in the playbook as soon as the preceding playbook tasks have successfully run.
Stage Task

The Stage Task lets you create checkpoints into a playbook’s workflow to organize playbooks. Stage tasks split the playbooks into different stages for easier management of workflows. Analysts can also use stage tasks to assign investigators to the incident.
In this example, we will create a stage task in an incident playbook to signify the data enrichment stage of the playbook workflow.
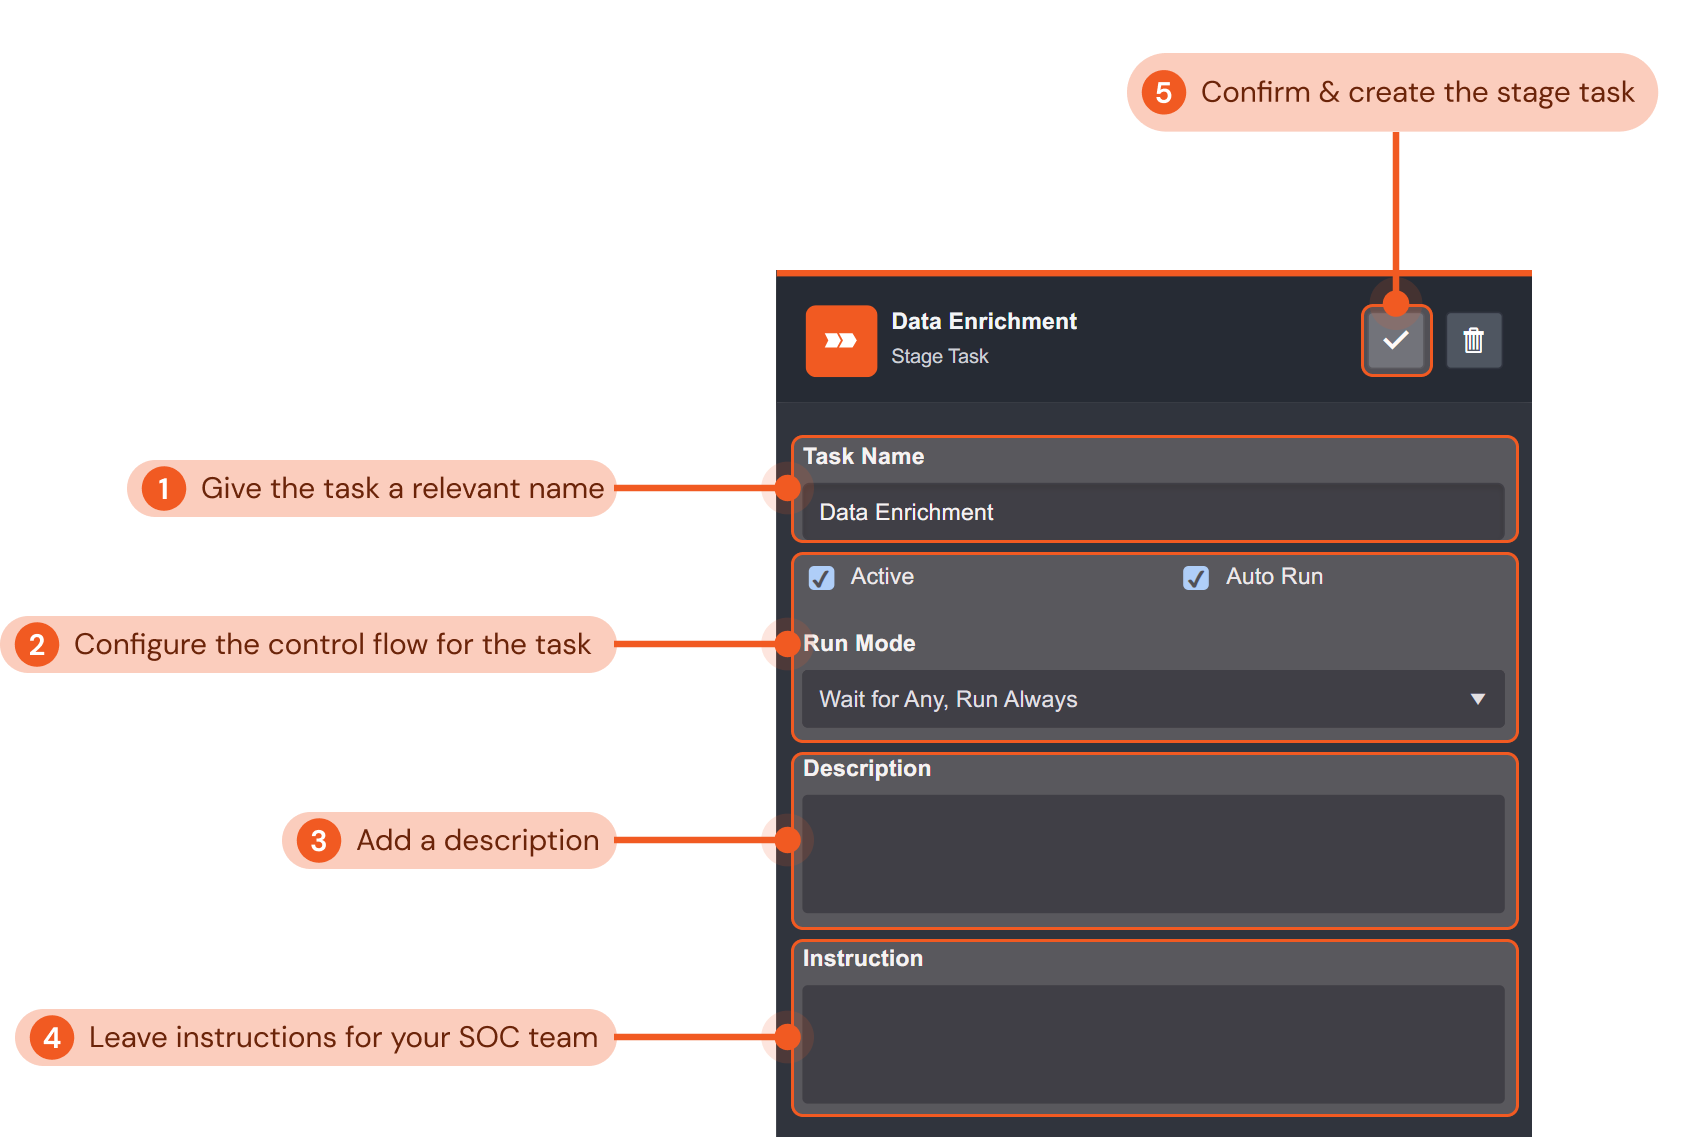
Give the stage task a relevant name that indicates the corresponding stage of your playbook’s workflow. In this example, we will name the stage task “Data Enrichment”.
Configure the control flow for the stage task. Use the tick boxes to configure if the stage task is active and if it will autorun. The dropdown menu lets you select the control flow for the task. Refer to Task Data Flow for more details. The configurations in this example ensure the command task is active, and will always auto-run when its preceding tasks have been completed.
Include a description for the stage task for future playbook editing reference if desired. We have not included one for this example.
Click the gray check mark button to confirm and create the command task.
Done!
Success
Using a stage task in the event playbook editor, you have organized your playbook by indicating the data enrichment stage of the playbook workflow. You have configured the stage task so that it will automatically run in the playbook as soon as the preceding playbook tasks have successfully run.
SLA Task

The SLA Task lets you set precise service-level agreement (SLA) for all tasks in the incident response lifecycle. This task facilitates the reporting and monitoring of your team’s compliance with SLA guidelines. Click here for a short how-to video on creating an SLA task.
In this example, we use an SLA Task to measure how long it takes the playbook to complete the escalation stage. This functionality is commonly used by SOC teams to ensure incidents are resolved and handled within a reasonable time frame per SLAs.
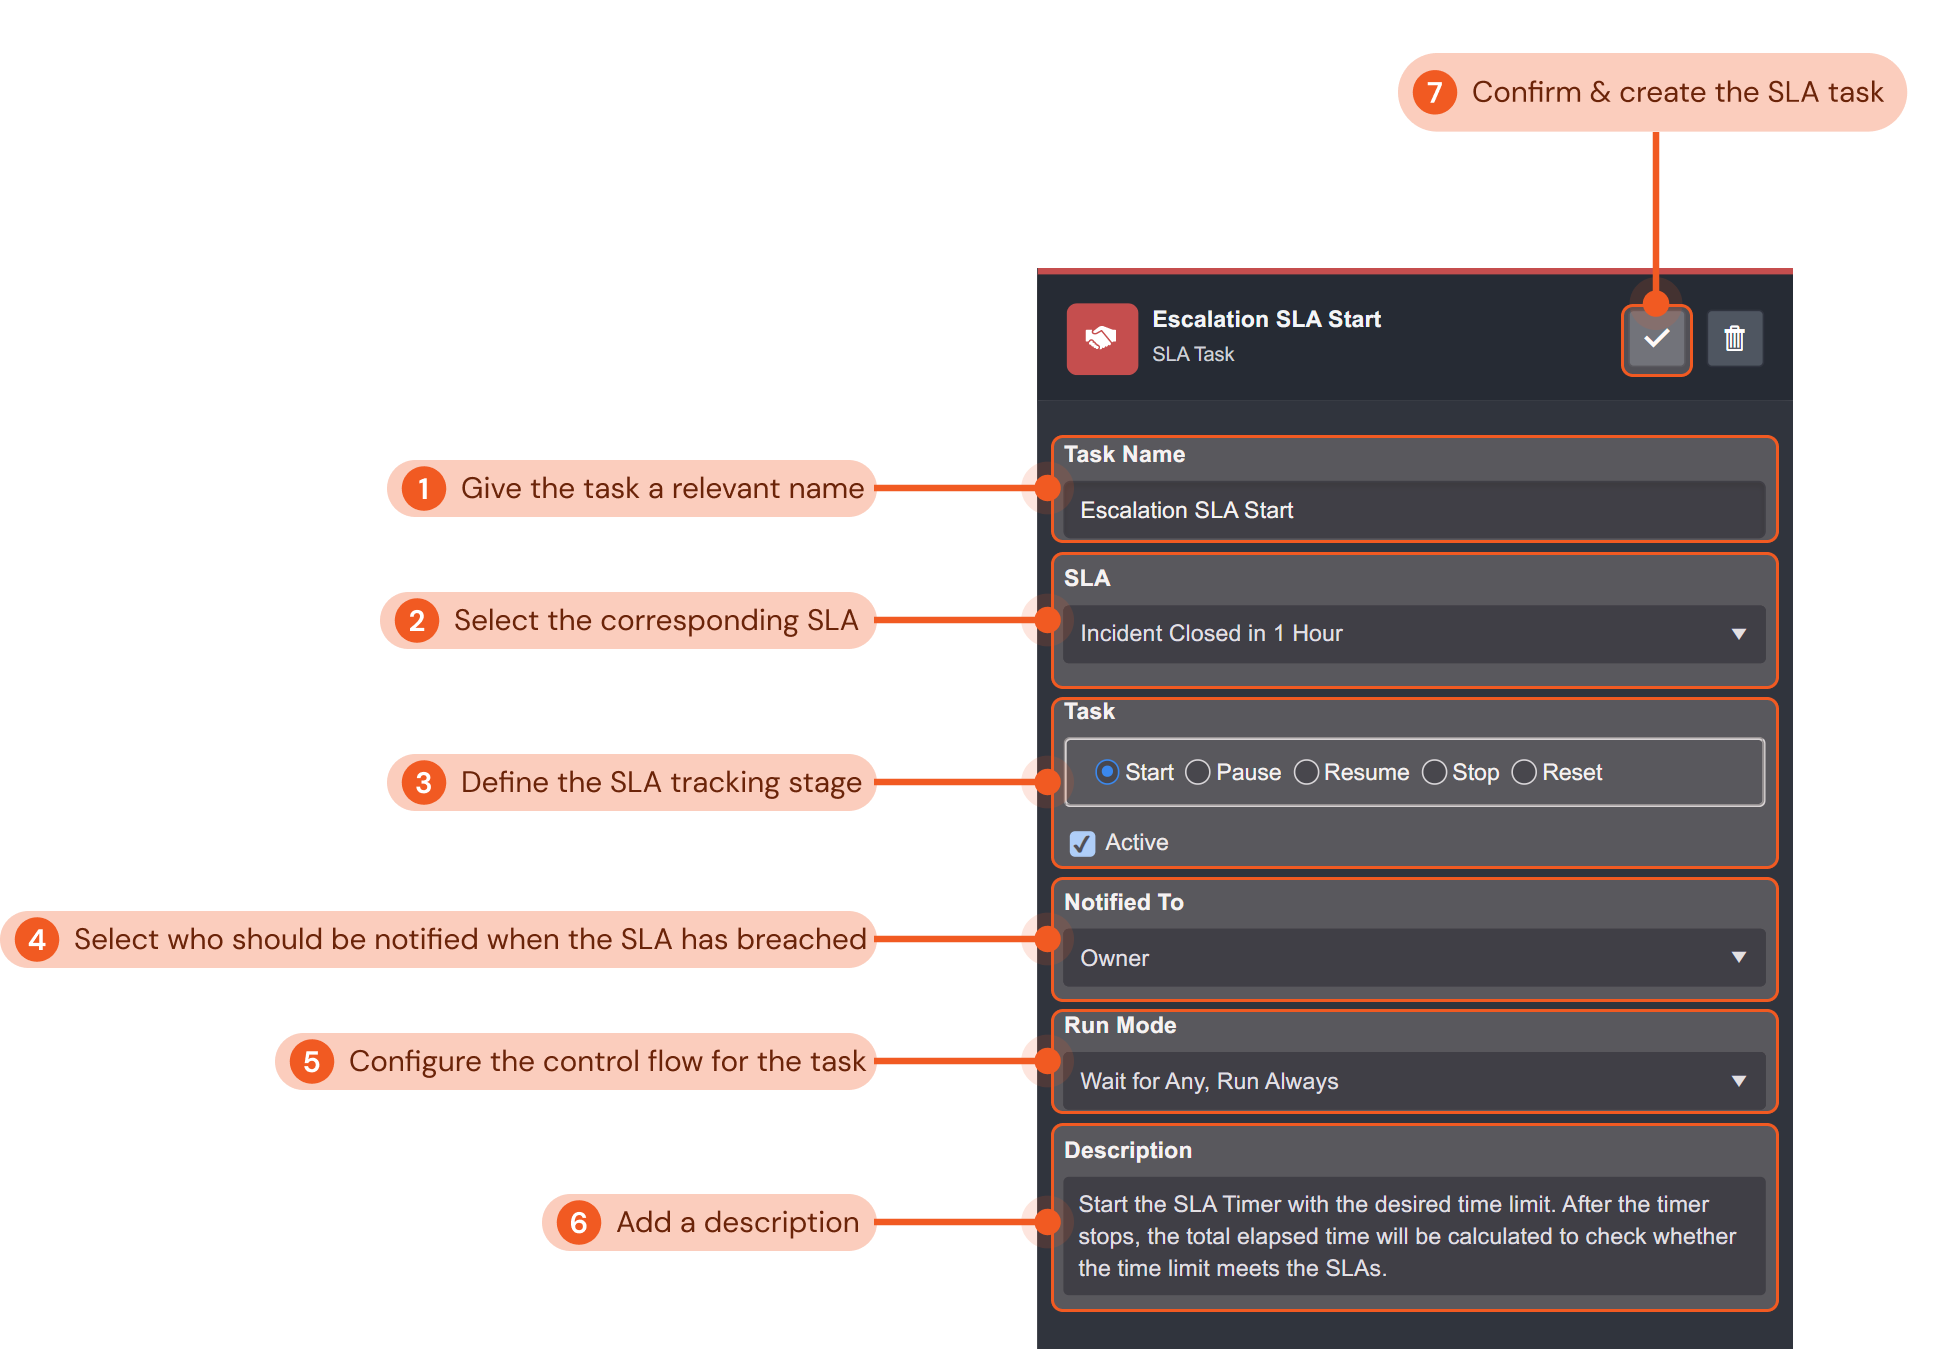
Give the task a relevant name that indicates the SLA agreement. In this example, we will name the task “Escalation SLA Start”.
Select the SLA agreement for this task using the dropdown menu. Configured SLAs will be available to select. You can add custom SLAs in the settings module of D3 SOAR. For this example, we will select Incident Closed in 1 Hour. This means that the time limit to respond to an incident is one hour.
Define the SLA tracking stage for the task. With this configuration, you can select whether you want to start, pause, resume, stop or reset the SLA tracking task. For this particular SLA task in the example, we are adding the SLA task to start tracking when an escalation has started. We would need to add a Stop SLA task in the playbook to define when the SLA tracking will stop.
Select who should be notified when the SLA is breached using the dropdown menu. Investigation teams, groups, users, and roles will be available to select. For our example, we will notify the Owner of the task.
Configure the control flow for the SLA task. Use the tick boxes to configure if the stage task is active and if it will autorun. The dropdown menu lets you select the control flow for the task. Refer to Task Data Flow for more details. The configurations in this example ensure the SLA task is active, and will always auto-run when its preceding tasks have been completed.
Include a description for the SLA task for future playbook editing reference if desired. A brief description of the SLA is included in the example shown.
Click the gray check mark button to confirm and create the command task.
Done!
Success
Using an SLA task in the event playbook editor, you have added a task that will start a timer and notify the user if the response time of an event is within the 15-minute limit per the SLA in the example. You have configured the SLA task so that it will automatically run in the playbook as soon as the preceding playbook tasks have successfully run.
Conditional Task

The Conditional Task allows you to set up different possible paths a playbook workflow may go through depending on how the output of a preceding task runs through a logical test.
In this example, the Conditional Task checks which option a user has selected in an automated email sent by the D3 SOAR system inquiring if he/she has clicked on any malicious links.
Give the task a relevant name that describes the conditional task. In this example, we will name the task “Did the User click on the Link?”.
Use the tick boxes to set whether the task is active and automated. Both boxes are checked in this example so that the task is active and will auto-run.
Select the condition type for the task (i.e. input or command). For the input condition type, you can build a custom Python script with the built-in data formatter to define the workflow for the conditionals. You can also select the command condition type, which allows you to use D3’s library of built-in and integration commands to define the workflow for the conditionals.
Configure the control flow for the conditional task. The dropdown menu lets you select the control flow for the task. Refer to Task Data Flow for more details. The configurations in this example ensure the conditional task will always auto-run when its preceding tasks have been completed.
Include a description for the conditional task for future playbook editing reference if desired. We have not included one for this example.
Add conditionals for the task. Conditionals correspond to the output data of the preceding playbook task. You can also change the order of the conditional options you have added. A common set of conditions is true and false, which we have used in this example.
Click the gray check mark button to confirm and create the command task.
Done!
Reader Note
In this example, the command condition type was selected to use the Contains Text command to check if the input text (from the preceding task’s dynamic output data) contains the specified text. Subsequent playbook tasks can then be added to each corresponding conditional option.
Success
Using a conditional task in the incident playbook editor, you have added a task that checks which option the user has selected in the automated email sent by the D3 SOAR system inquiring if he/she has clicked on any malicious links by using the Contains Text command. You have configured the conditional task so that it will automatically run in the playbook as soon as the preceding playbook tasks have successfully run. Subsequent tasks can then be added to each configured conditional option (i.e., true and false).
Interaction Task

The Interaction Task is typically used to add a point of manual human processing into your playbook. With the Interaction Task, you can incorporate questions, prompts or notes to guide your SOC team’s decision-making process throughout an incident response. Unlike other playbook tasks, an interaction task cannot be automated, as its purpose is to facilitate manual response in incident response.
In this example, we will create an interaction task to prompt the investigator to manually select from a list of potentially malicious IP addresses from the dynamic output data of a preceding playbook task to block.
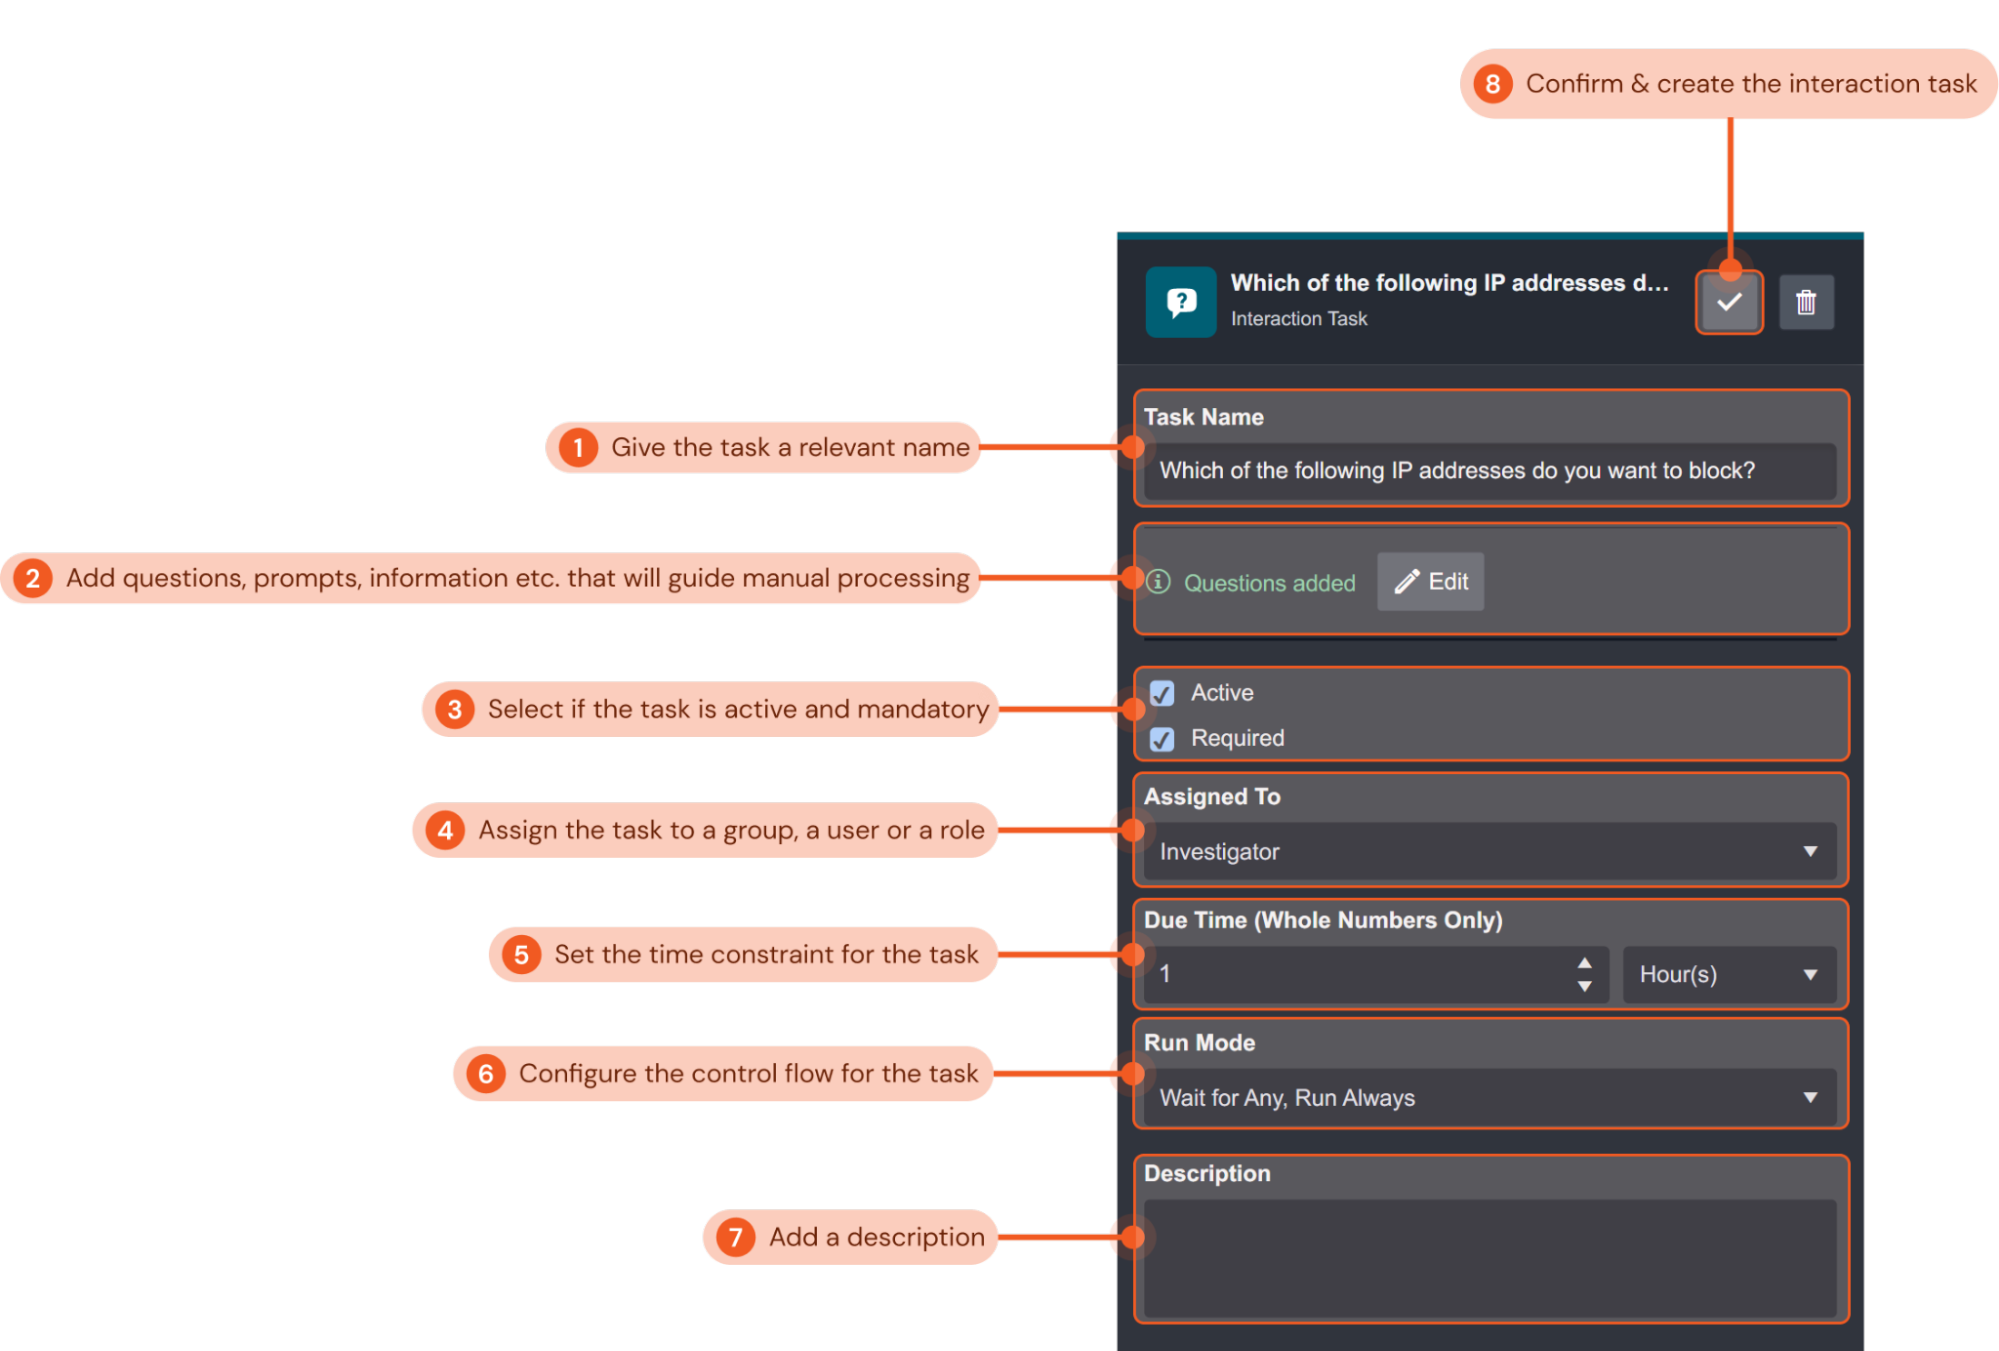
Give the task a relevant name that describes the interaction task. In this example, we will name the task “Which of the following IP addresses do you want to block?”.
Add questions, prompts, information etc. that will guide the investigator’s manual processing of the task. You can use the JSON path picker to select output data and use the Regex filter to filter the JSON data. For this example, we added a question asking the investigator which IP address to manually block from the preceding playbook task’s output dynamic data of some potentially malicious IP.
Configure whether the interaction task is active and a required task. Both tick boxes are checked in our example so that the interaction task is both active and required.
Assign the group, user or role responsible for processing the interaction task. We have assigned the task to the investigator for this example.
Set the time constraint for the assignee to process the task. This setting can be used to align with any SLA requirements of your organization or use case. Here, we have set the time limit to process the interaction task to one hour.
Configure the control flow for the interaction task. The dropdown menu lets you select the control flow for the task. Refer to Task Data Flow for more details. The configurations in this example ensure the interaction task will always auto-run when its preceding tasks have been completed.
Include a description for the command task for future playbook editing reference if desired. We have not included one for this example.
Click the gray check mark button to confirm and create the command task.
Done!
Success
Using an interaction task in the incident playbook editor, you have added a task that will prompt an investigator on your SOC team to manually process and block IP addresses from a list of malicious IPs from the dynamic output data of a preceding playbook task. The task configured will be active and required, and must be processed within an hour. You have configured the interaction task so that it will automatically run in the playbook as soon as the preceding playbook tasks have successfully run.
Merge Task

The Merge Task lets you take in data from all preceding connected playbook tasks and combine the data based on specified conditions. Tasks that are connected after the merge task can then reuse the combined data.
In this example, we will create a merge task to combine data after an Unwind Task that deconstructed an array field from some JSON data of the risk levels of a list of IPs. The subsequent task after the Unwind Task queried the IP addresses using an integration command task. Since there was more than one data point, multiple instances of the query command task were configured to run. The merge task will now combine the data output of the different instances for use in later playbook tasks.
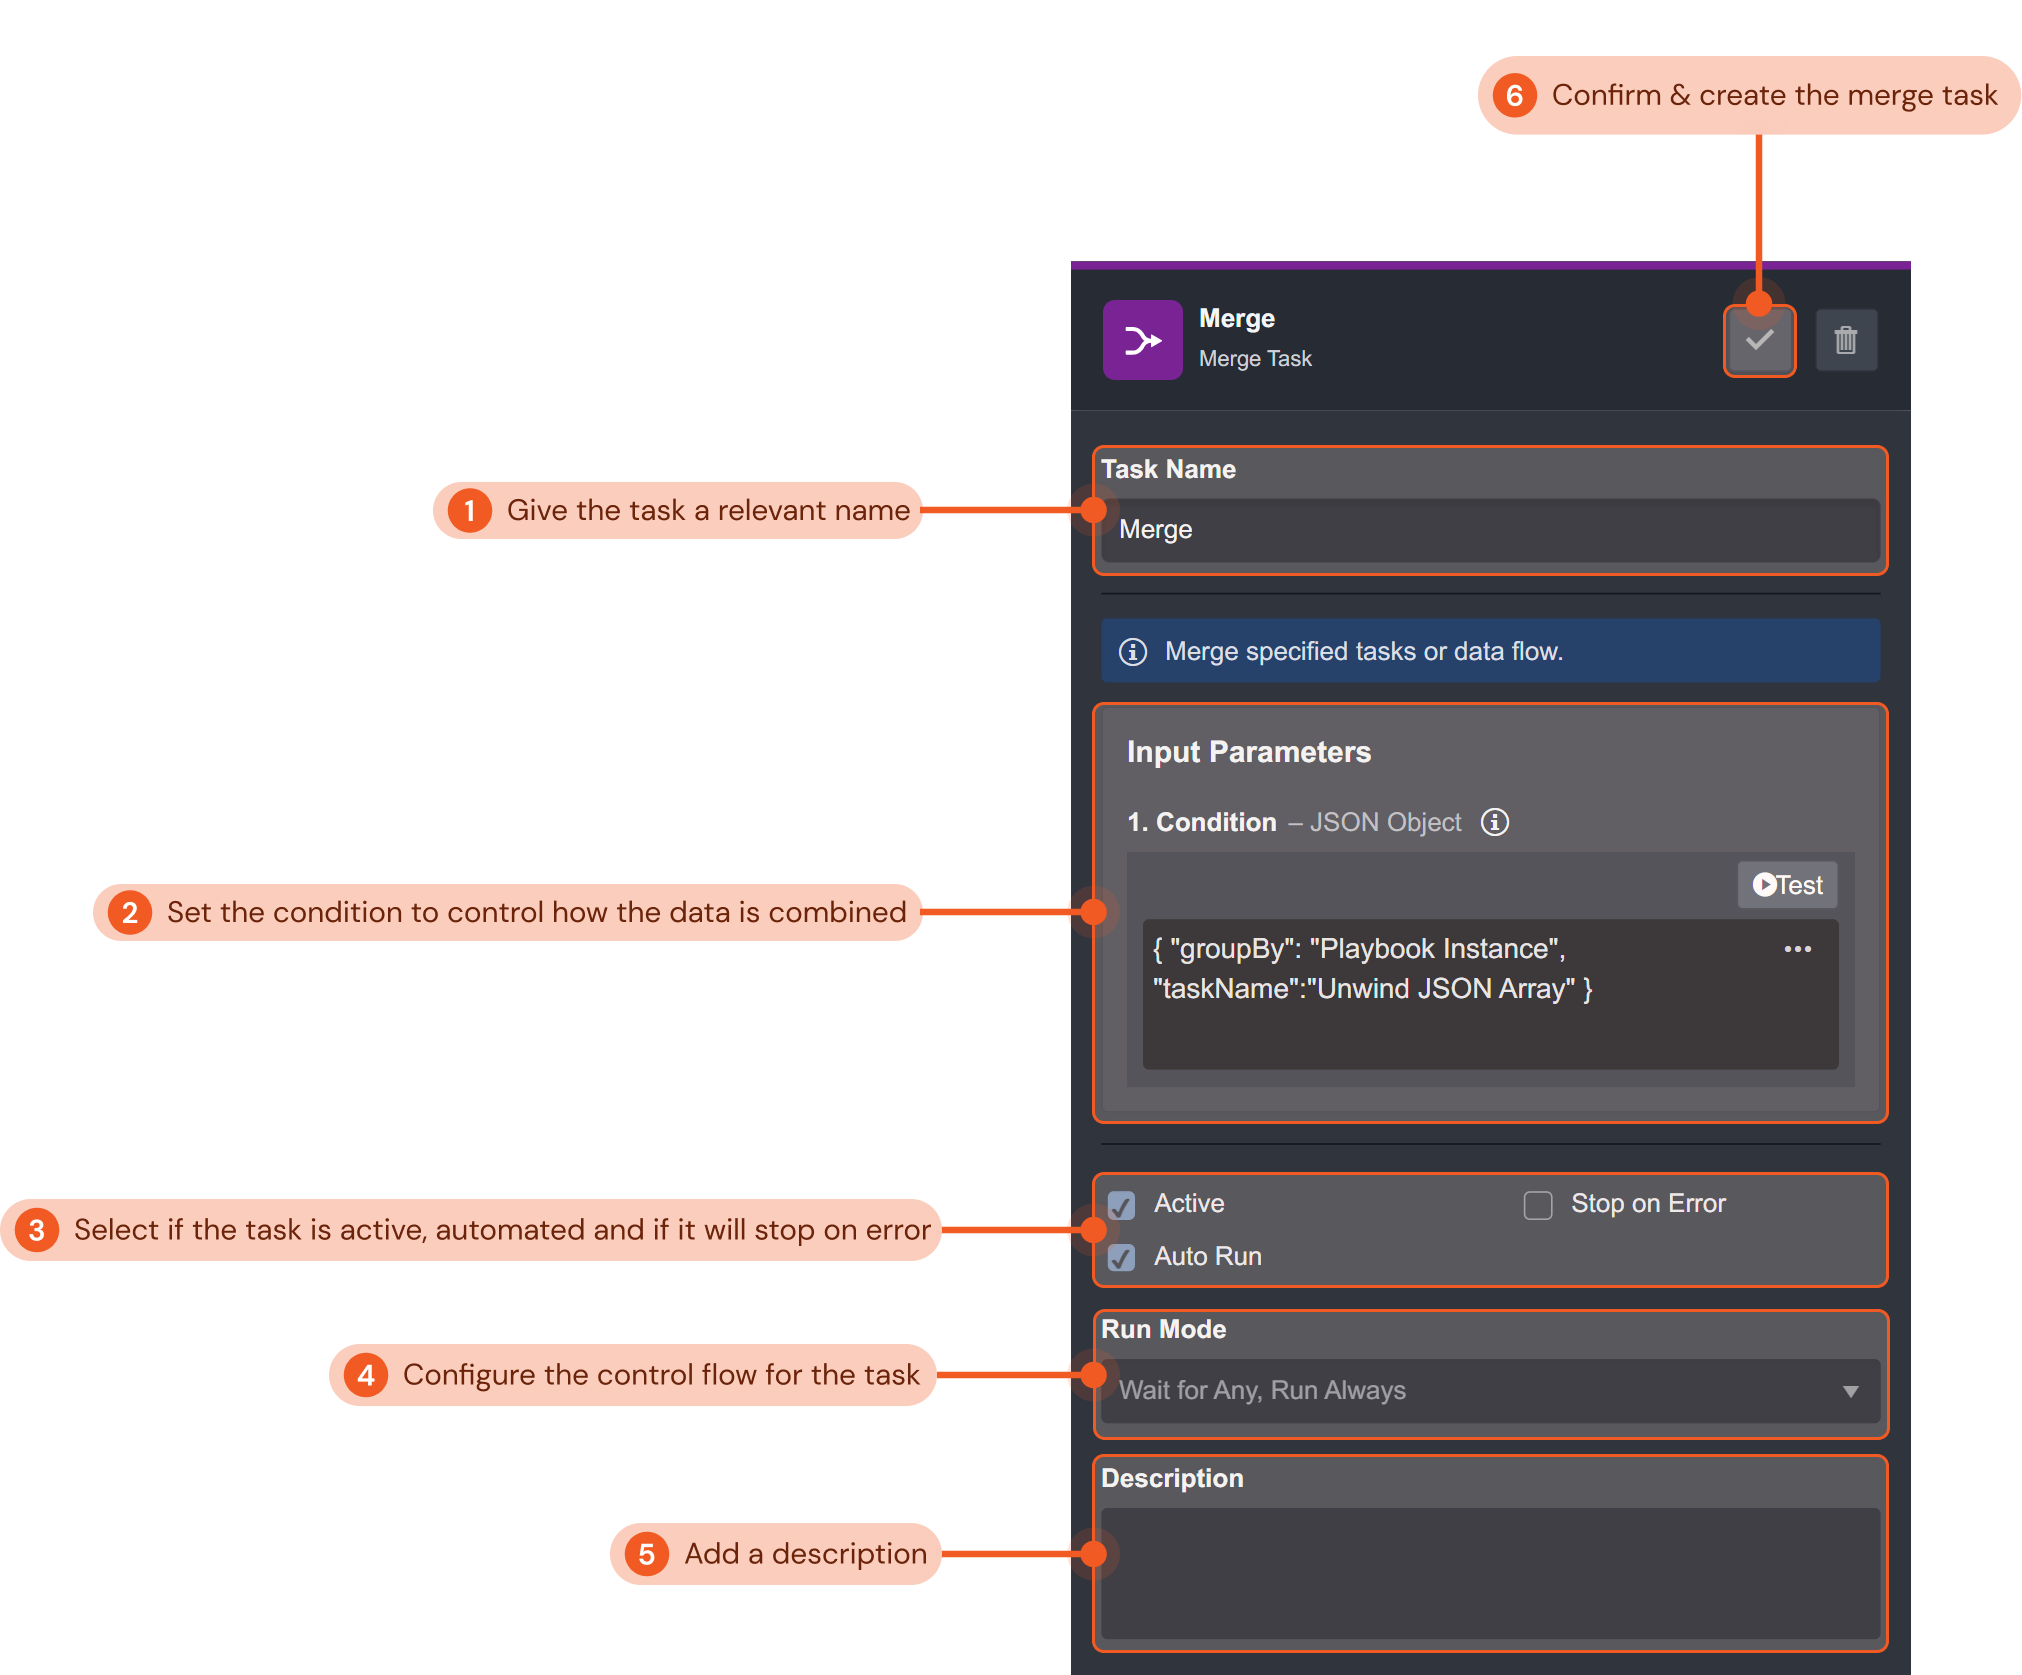
Give the task a relevant name. In this example, we will name the task “Merge”.
Set the condition to control how the data is combined. There are four conditions you can configure to control how data is combined: by playbook instance, by task name, by task instance, or by a specified JSON path. For this example, we will combine the data by playbook instance.
Use the tick boxes to configure if the task is active, if it is automated, and if it will stop on error. Active and Auto Run are selected for this example.
Configure the control flow for the merge task. The dropdown menu lets you select the control flow for the task. Refer to Task Data Flow for more details. The configurations in this example ensure the interaction task will always auto-run when its preceding tasks have been completed.
Include a description for the command task for future playbook editing reference if desired. We have not included one for this example.
Click the gray check mark button to confirm and create the command task.
Done!
Success
Using a merge task in the event playbook editor, you have added a task that will combine the dynamic data output of multiple instances of a preceding playbook task. The combined data can be used for subsequent playbook tasks. The task configured will be active and automated, and will automatically run in the playbook as soon as the preceding playbook tasks have successfully run.
REST API Task
The REST API Task lets you use REST APIs to send a request to a web service to retrieve or modify data in your playbooks. You can use the five HTTP methods for CRUD (create, retrieve, update and delete) operations.
In this example, we will create a REST API task to send a webhook event to D3 SOAR with the POST method in order to create a new event entry.
Give the task a relevant name that describes the REST API task. In this example, we will name the task “Send Webhook Event”.
Configure the input parameters to use the REST API. This includes the request URL, the HTTP method, the request header and the body data for the request. In this example, the following values for the input parameters were configured:
URL:
CODE{{PlaybookData | jsonpath('$.["Construct Webhook URL"].returnData')|trim}}The request URL is selected using the format builder to select the data from a previous playbook task.
Method:
POST
We will use the POST request method to perform a create operation for a new event.Header:
CODE{"d3key":"d3test"}The key-value pair is used for the API authorization.
Body:
CODE{% set result %} { "eventtype":"Suspicious Email", "username": "user1", "sourceip": "192.168.87.104", "hostname": "D3cyber7ce", "email": "demo@d3soar.com", "domain": "www.google.com", "destinationip": "8.8.8.8", "sha256": "8b2e701e91101955c73865589a4c72999aeabc11043f712e05fdb1c17c4ab19a", "timestamp": "{{'today' | date('YYYY/MM/DD HH:mm:ss')}}" } {%endset%}{{result|trim}}The body contains the JSON object data we want to POST into D3 SOAR.
Use the tick boxes to configure if the task is active, if it is automated, and if it will stop on error. Active and Auto Run are selected for this example.
Use the tick boxes to set whether the task is active and automated. Both boxes are checked in this example so that the task is active and will auto-run.
Include a description for the command task for future playbook editing reference if desired. We have not included one for this example.
Click the gray check mark button to confirm and create the command task.
Done!
Success
Using a REST API task in the event playbook editor, you have added a task that will use a REST API to perform a create operation of an event into D3 SOAR. You have configured the REST API task so that it will automatically run in the playbook as soon as the preceding playbook tasks have successfully run.
Ongoing Surveillance Task

You can set up additional conditions and correlations in the Ongoing Surveillance Task to conduct a deeper analysis and ingest Events on a periodical basis.
Unwind Task

The Unwind Task deconstructs an array of JSON object(s) into individual objects. More specifically, it deconstructs an array field from the specified JSON data and creates output(s) for each object of the array. Each returned object contains two parts: the root fields of the original JSON data and one object from the array. An instance is created for each returned object.
In most use cases, if a command input can only accept one item at a time, we use the unwind task to repeat the command task to handle the loop of an array. The unwind task is often used in conjunction with a merge task to re-combine the data based on specified conditions.