.png)
Investigation Dashboard
The Investigation Dashboard is the landing page for all Events, Incidents, Pending Tasks, Artifacts and Playbook Errors that are created or ingested into D3 SOAR.
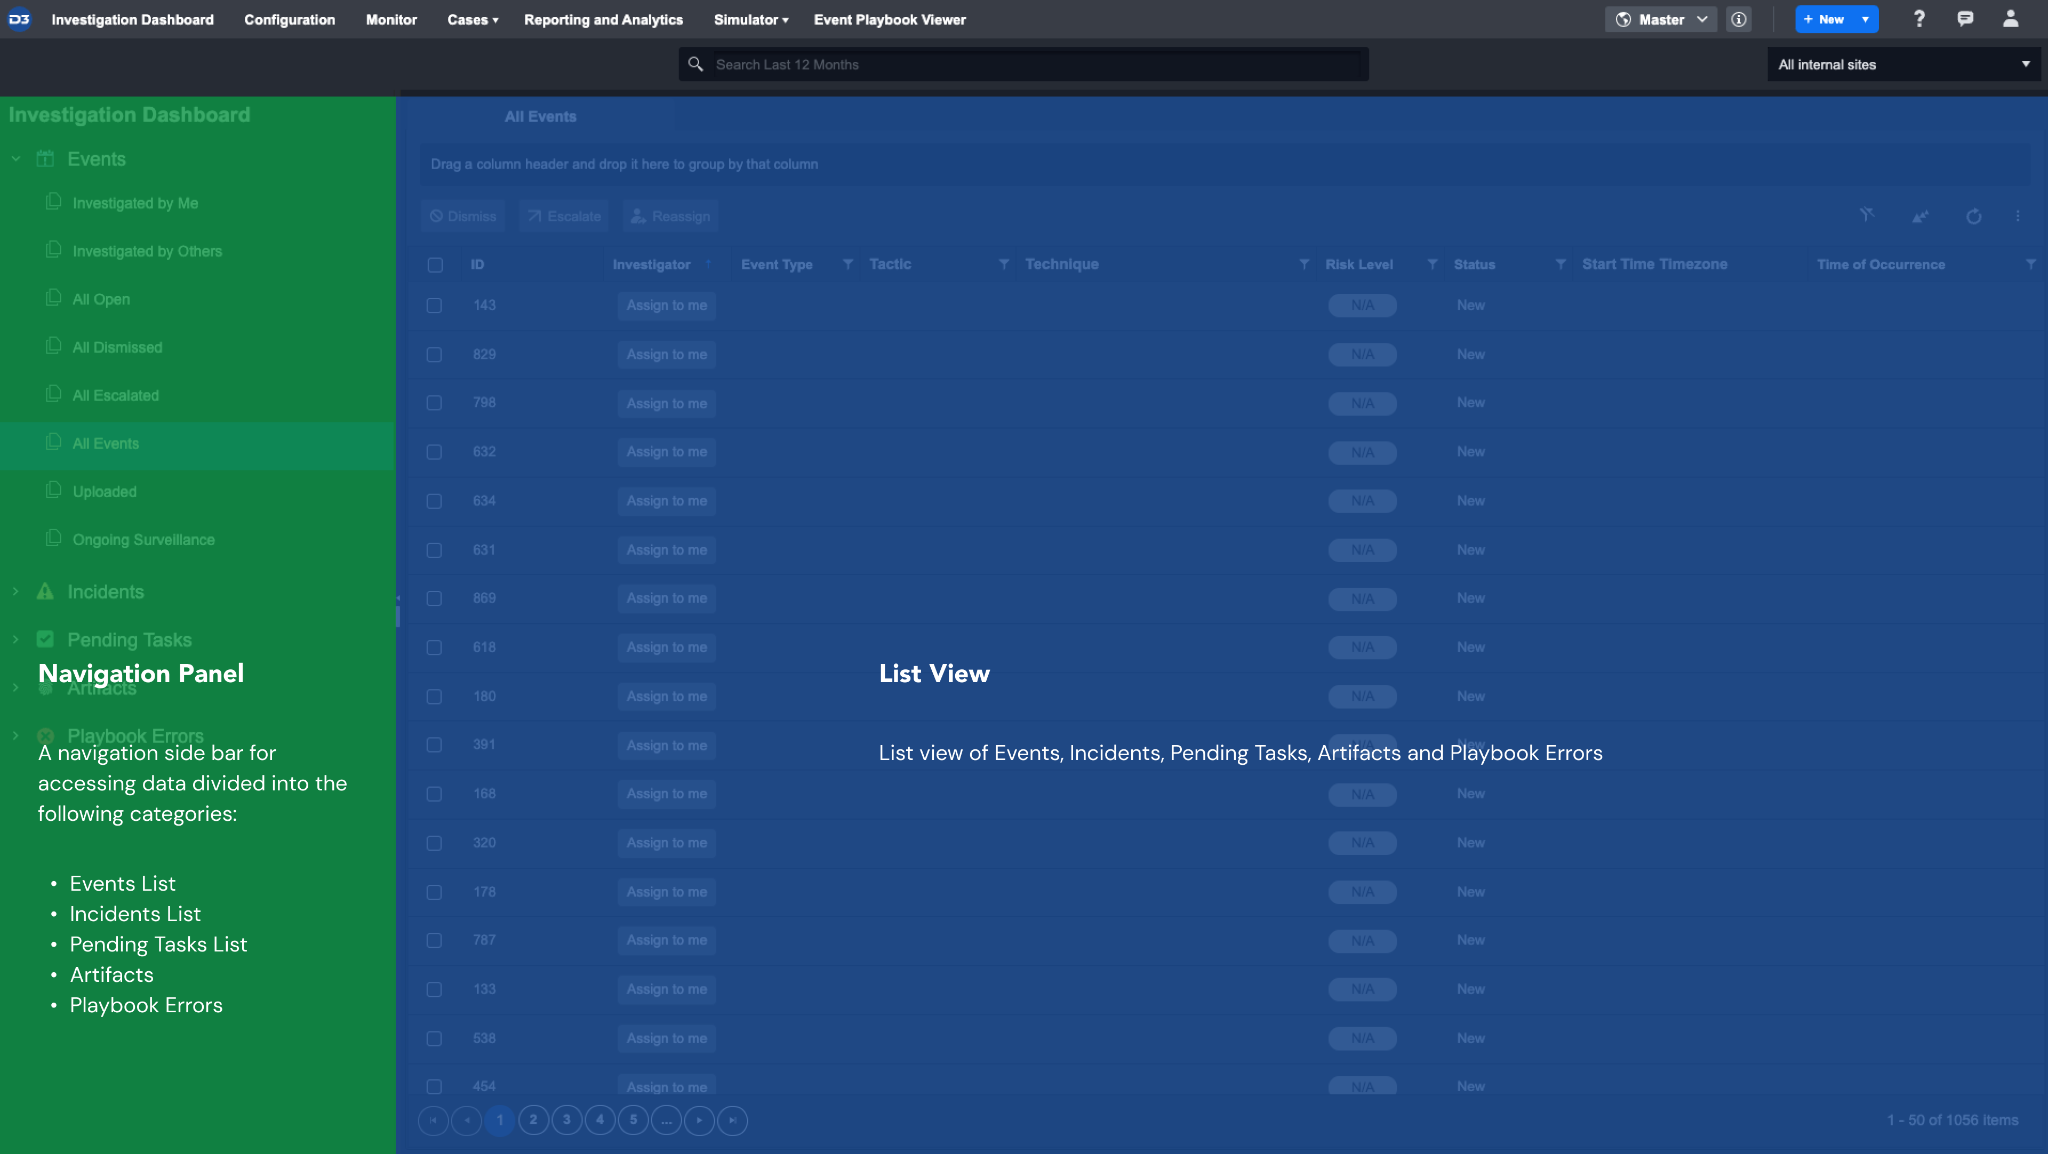
Navigation Panel
The left navigation panel in the Investigation Dashboard provides access to different types of data within the system. Under each data type, there are built-in triages to help with your investigation. There are five different data types that you will find in the Investigation Dashboard:
Events: Events ingested into the system from different data sources
Incidents: Includes incidents ingested from a data source or incidents that are escalated from one or more events
Pending Tasks: Playbook tasks that are assigned to an investigator and require manual execution
Artifacts: Artifact entities that have been ingested
Playbook Errors: Playbook Errors that occurred during a run
List View
This is the main list view of the Investigation Dashboard displaying data according to the selected data type in the navigation panel. These features built into the Investigation Dashboard help you navigate the dashboard more easily:
Customizing the List View
Creating a Triage
Investigation Dashboard Search
Customizing the List View
In the List View, you can filter, sort, or group events, incidents, pending tasks, and playbook errors to display information based on specified criteria.

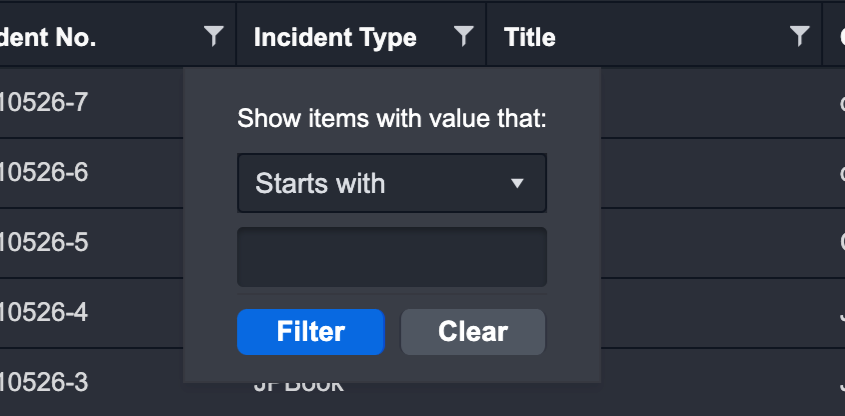
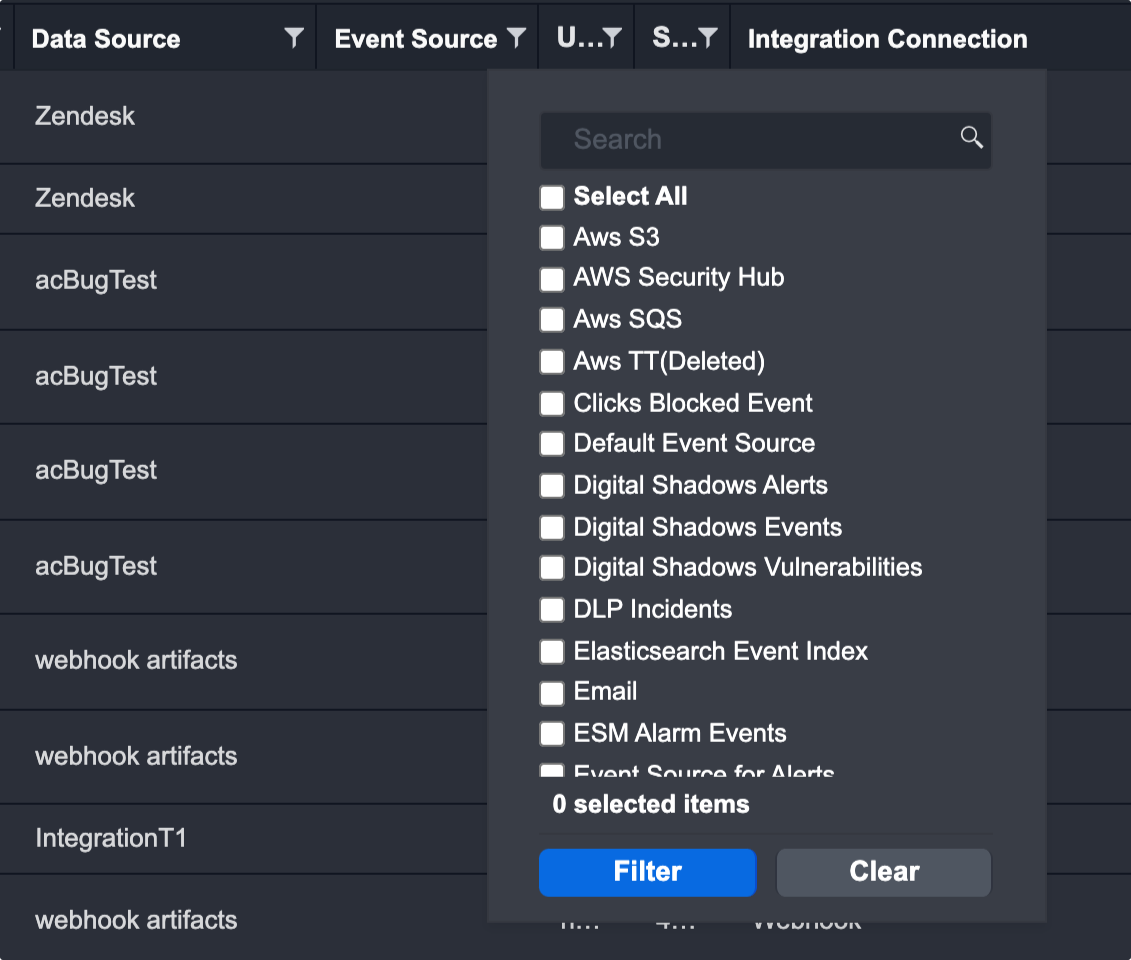
Filter
You can click on the Filter icon in the header cells or drag column headers to the grouping banner located above the column headers to view the items with your preferred way of sorting.

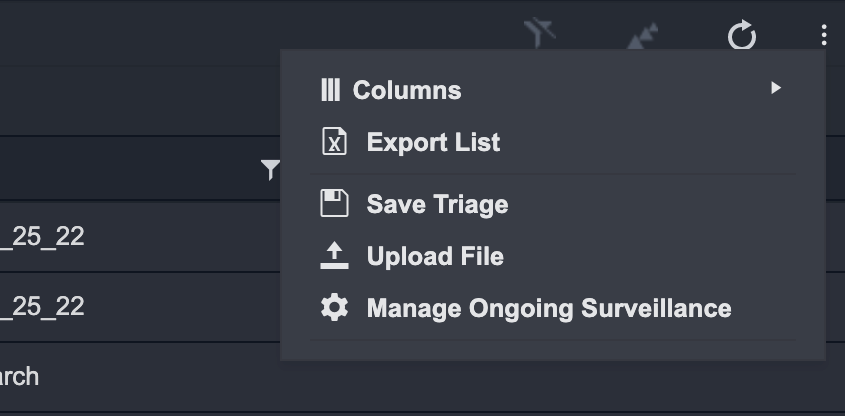
Columns
You can select which columns to show in the List View by navigating to the Columns option within the ⋮ icon (located in the top right corner of the list view).
Upload File
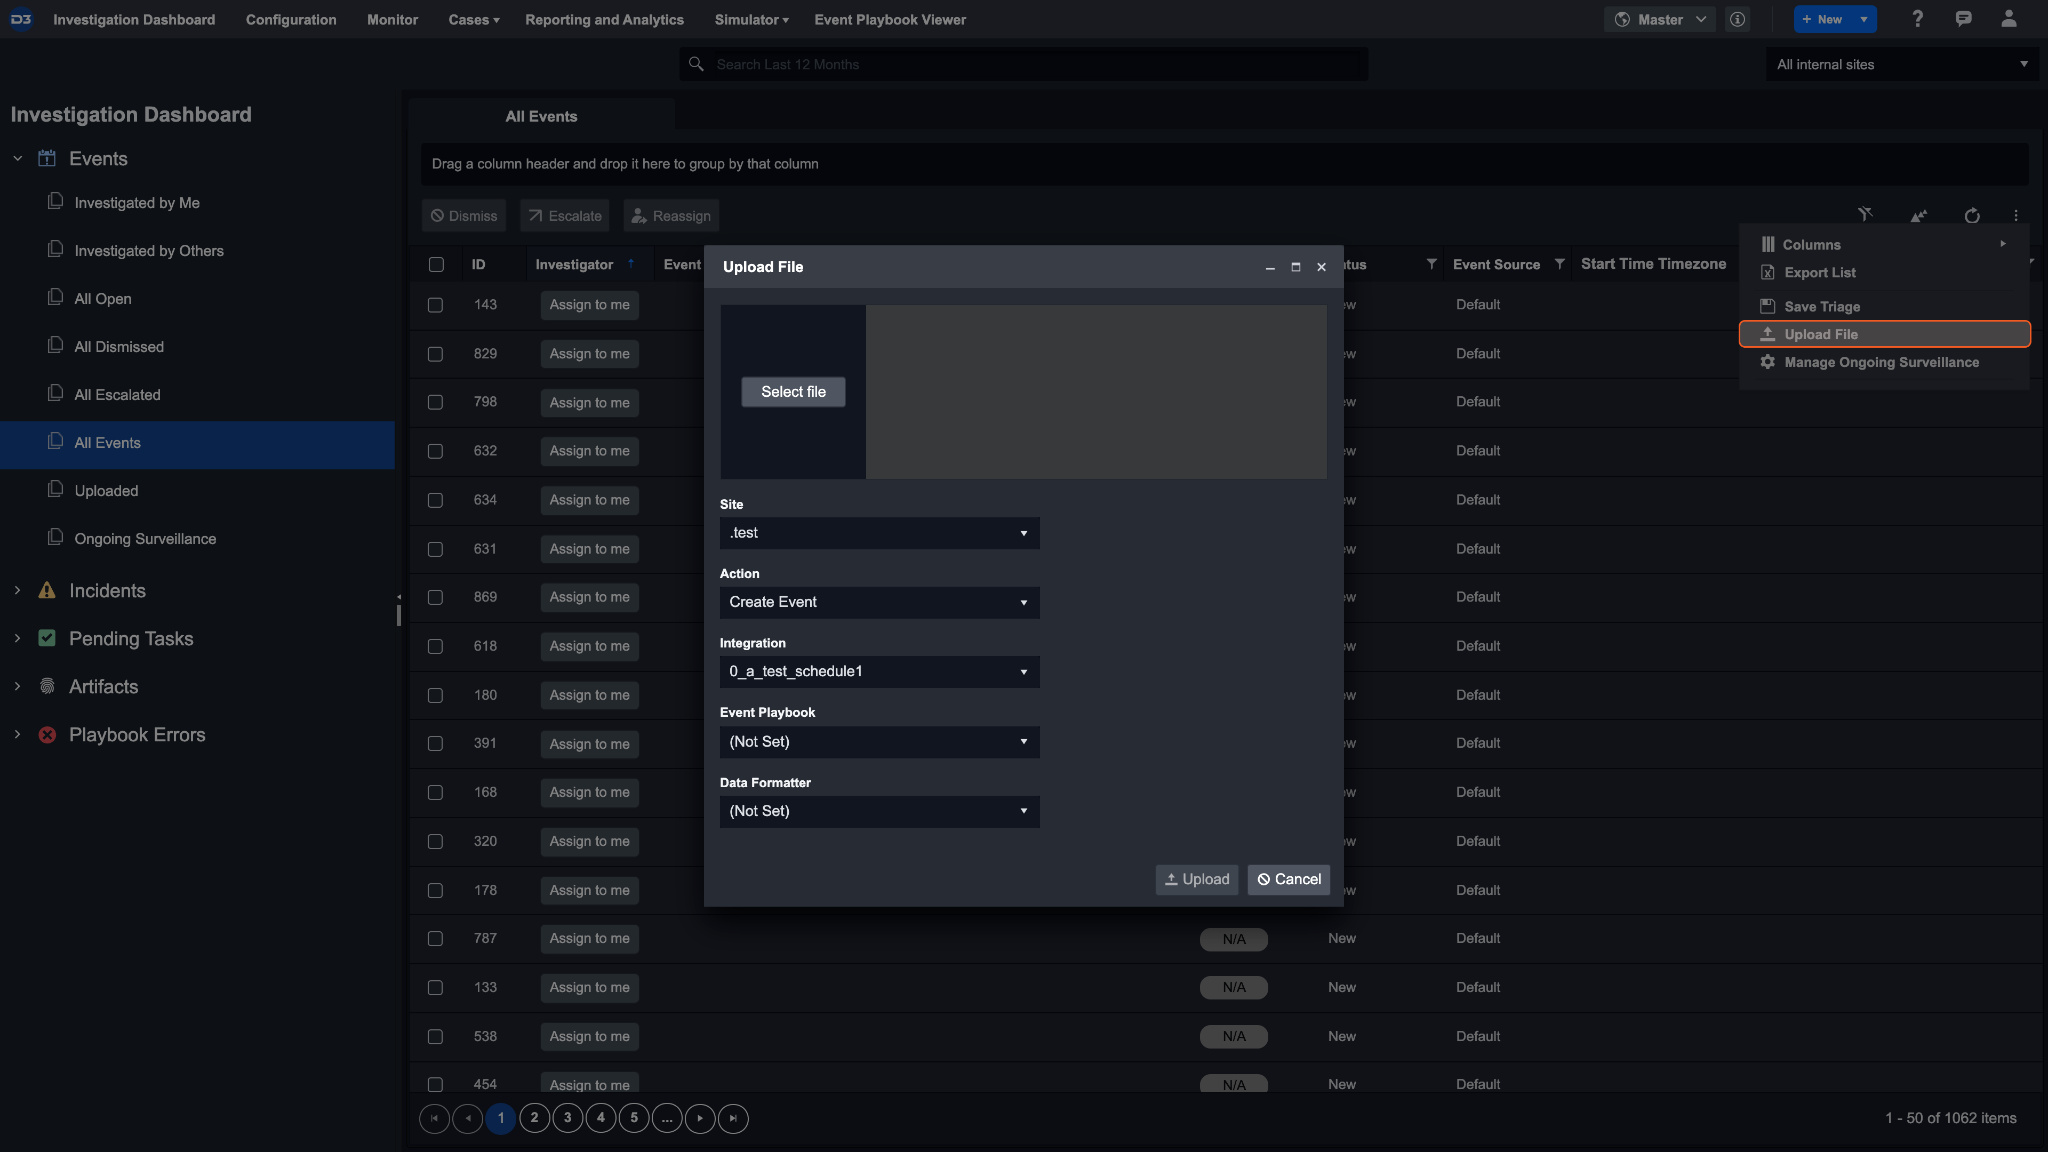
The File Ingestion method allows you to manually upload Event/Incident data into the system. The event/incident field mapping must be completed prior to the upload. For an incident file upload, you can optionally specify the event JSON path within the field mapping. If you do so, any events within the incident file will be created and linked to the incident after the upload.
The system currently supports files in JSON format only. Once the JSON file has been uploaded, you can select a Site and the created File Integration from the dropdown list.
If you are uploading an event or an incident with event(s), there is the option to assign an event playbook and/or data formatter to the ingested file.
Saved Triages
From the Events List, you can set up basic triage workflows that are shown to various team members. Creating an initial triage typically requires you to filter, group, order and sort event data before saving your desired view.
The ability to create, view and manage triages is dependent on the Role privilege assigned to each user. This ability is configured by your admin within the Organization Management.
To create a new Triage:
Sort Order: Click on a column header to sort the Events list by either alphabetical or numerical order.

Reader Note
The sorting will expand to all columns (i.e. not confined to just the selected column). The blue arrow next to the selected column header indicates whether the list is sorted in chronological or reverse-chronological order.
Grouping: Drag a column header to the grouping banner located under the tab header.
Filtering: Click on the filter icon of a column header and fill in your filter conditions. Your filter conditions can be any of the following:
Checkboxes
Input text
Date and time range
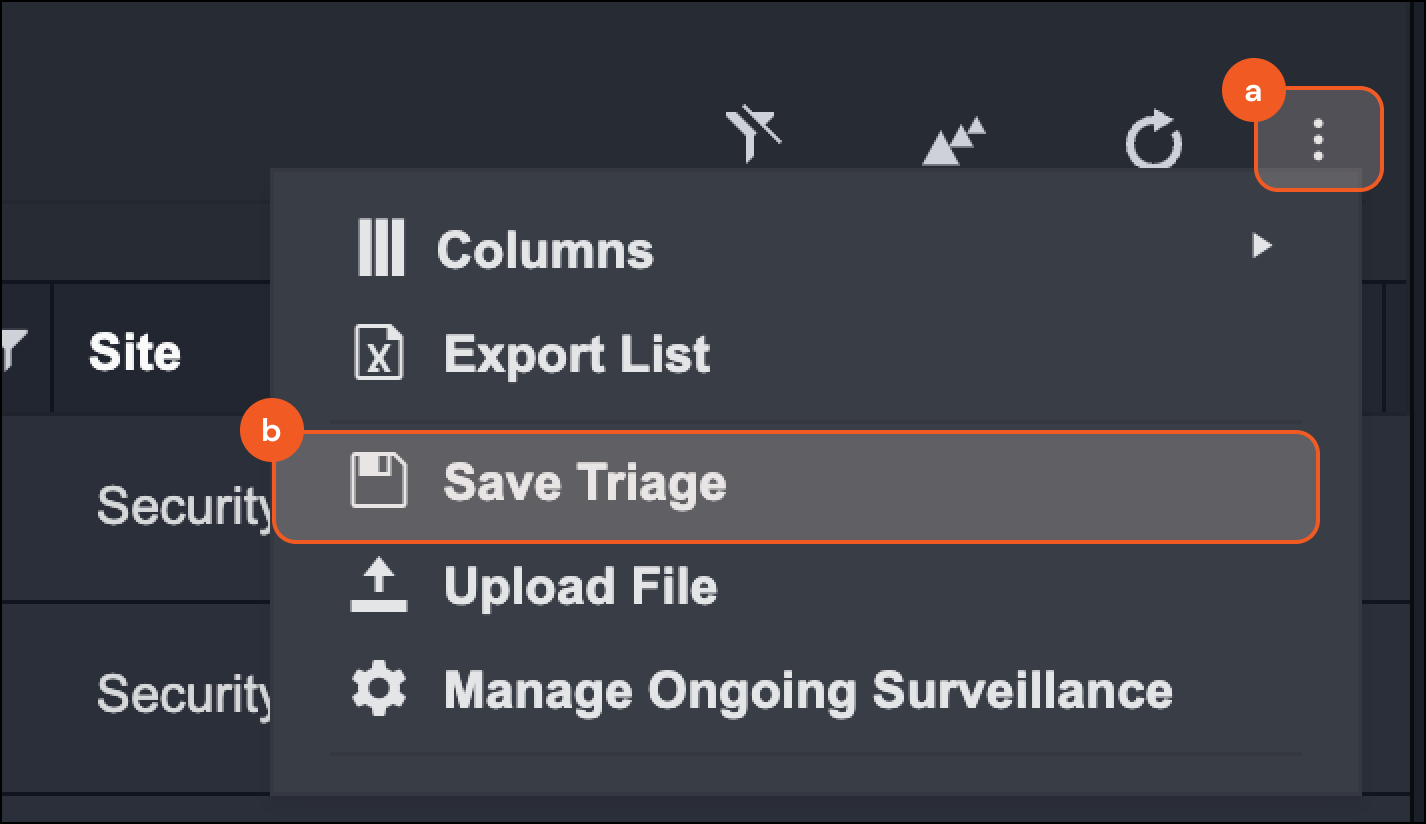
After customizing the view, you can save this view by:
a. clicking on the ellipsis icon
b. then select the Save Triage option.
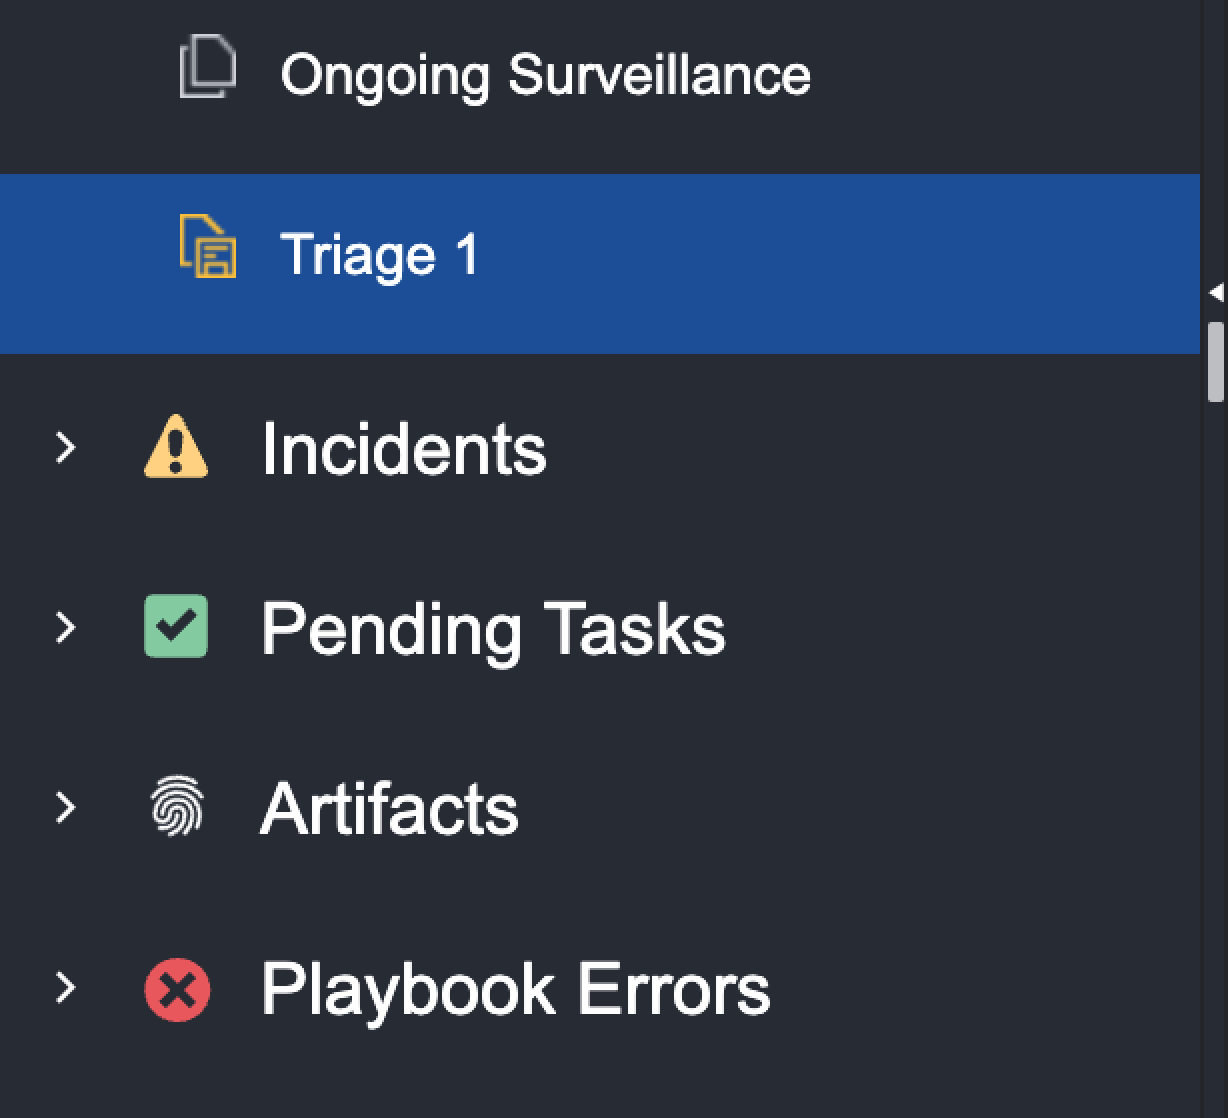
Enter a triage name, select an assignee and then click on OK.
Result: The triage will now appear in the left menu panel.
Reader Note
All of the data types correspond to the Sites they were created under. You can use the Site dropdown located in the top right corner to select from a specific Site, All Internal Sites, or All Client Sites.
Investigation Dashboard Search
Perform a keyword search and/or filter results in Investigation Dashboard sections. You can also apply advanced filters to incidents within the Incidents tab to find the relevant information.
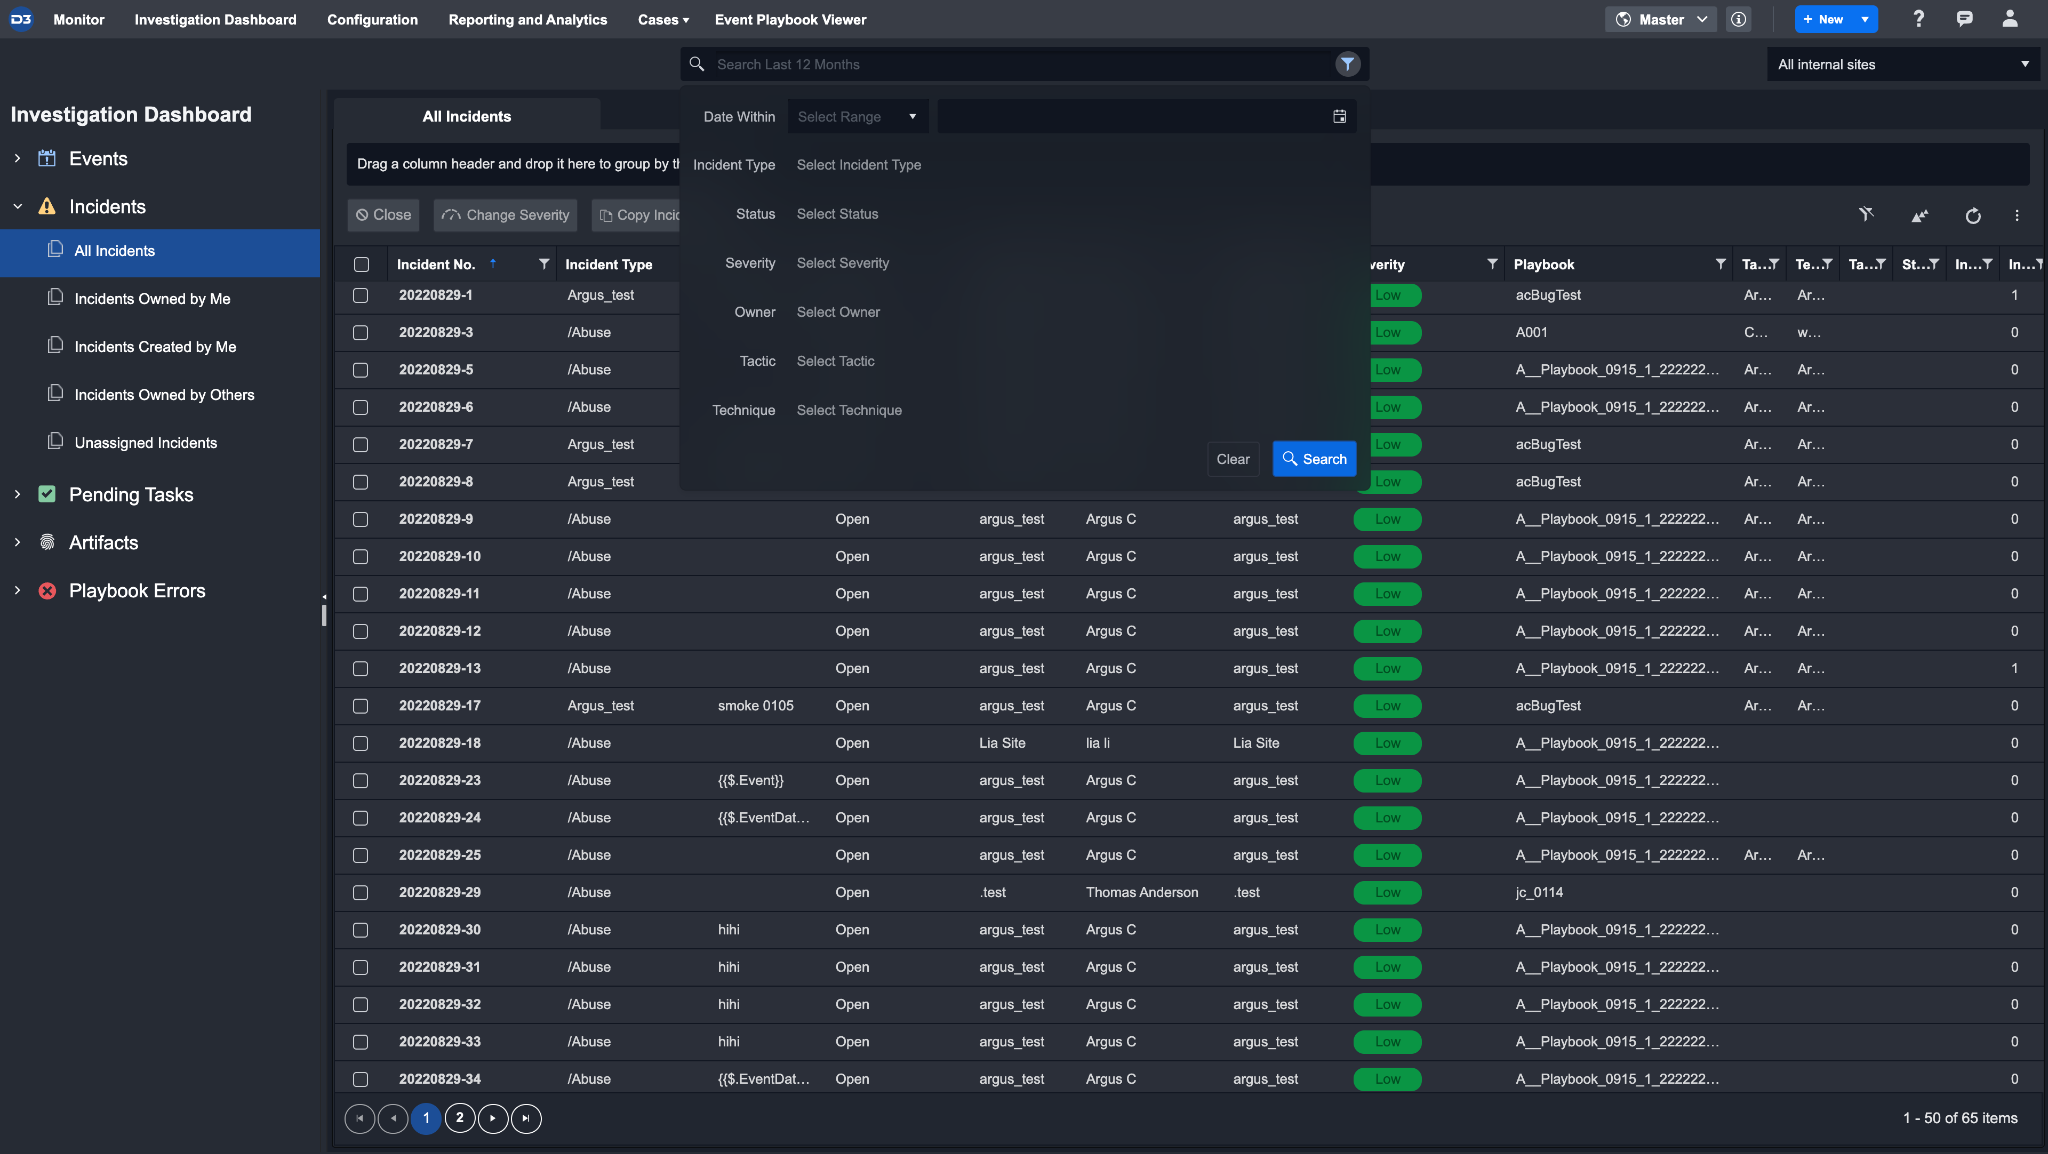
Advanced Filters (applicable to Incidents only)
There are six filters you can apply to your incident search by clicking on the filter icon inside the search box.
Date Within | The Date Within filter searches for incidents within the date range relative to the specified date/time. For example, if you selected 1 Month as the range and 03/31/2022 12:00 PM as the date, the system looks for incidents created between 02/31/2021 12:00 PM and 04/31/2021 12:00 PM. |
Incident Type | Specify one or more incident types to filter your incident search. |
Status | Specify one or more incident statuses to filter your incident search. |
Severity | Specify one or more incident severities from the list below to filter your incident search:
|
Owner | Specify one or more users to filter your incident search. Only the users of the current site will be available for selection. |
Tactic | Specify one or more tactics to filter your incident search. All tactics defined in the Monitor page will be available for selection. |
Technique | Specify one or more techniques to filter your incident search. All tactics defined in the Monitor page will be available for selection. |
Reader Note
You can use the table header filters in the list view to further filter your search results.
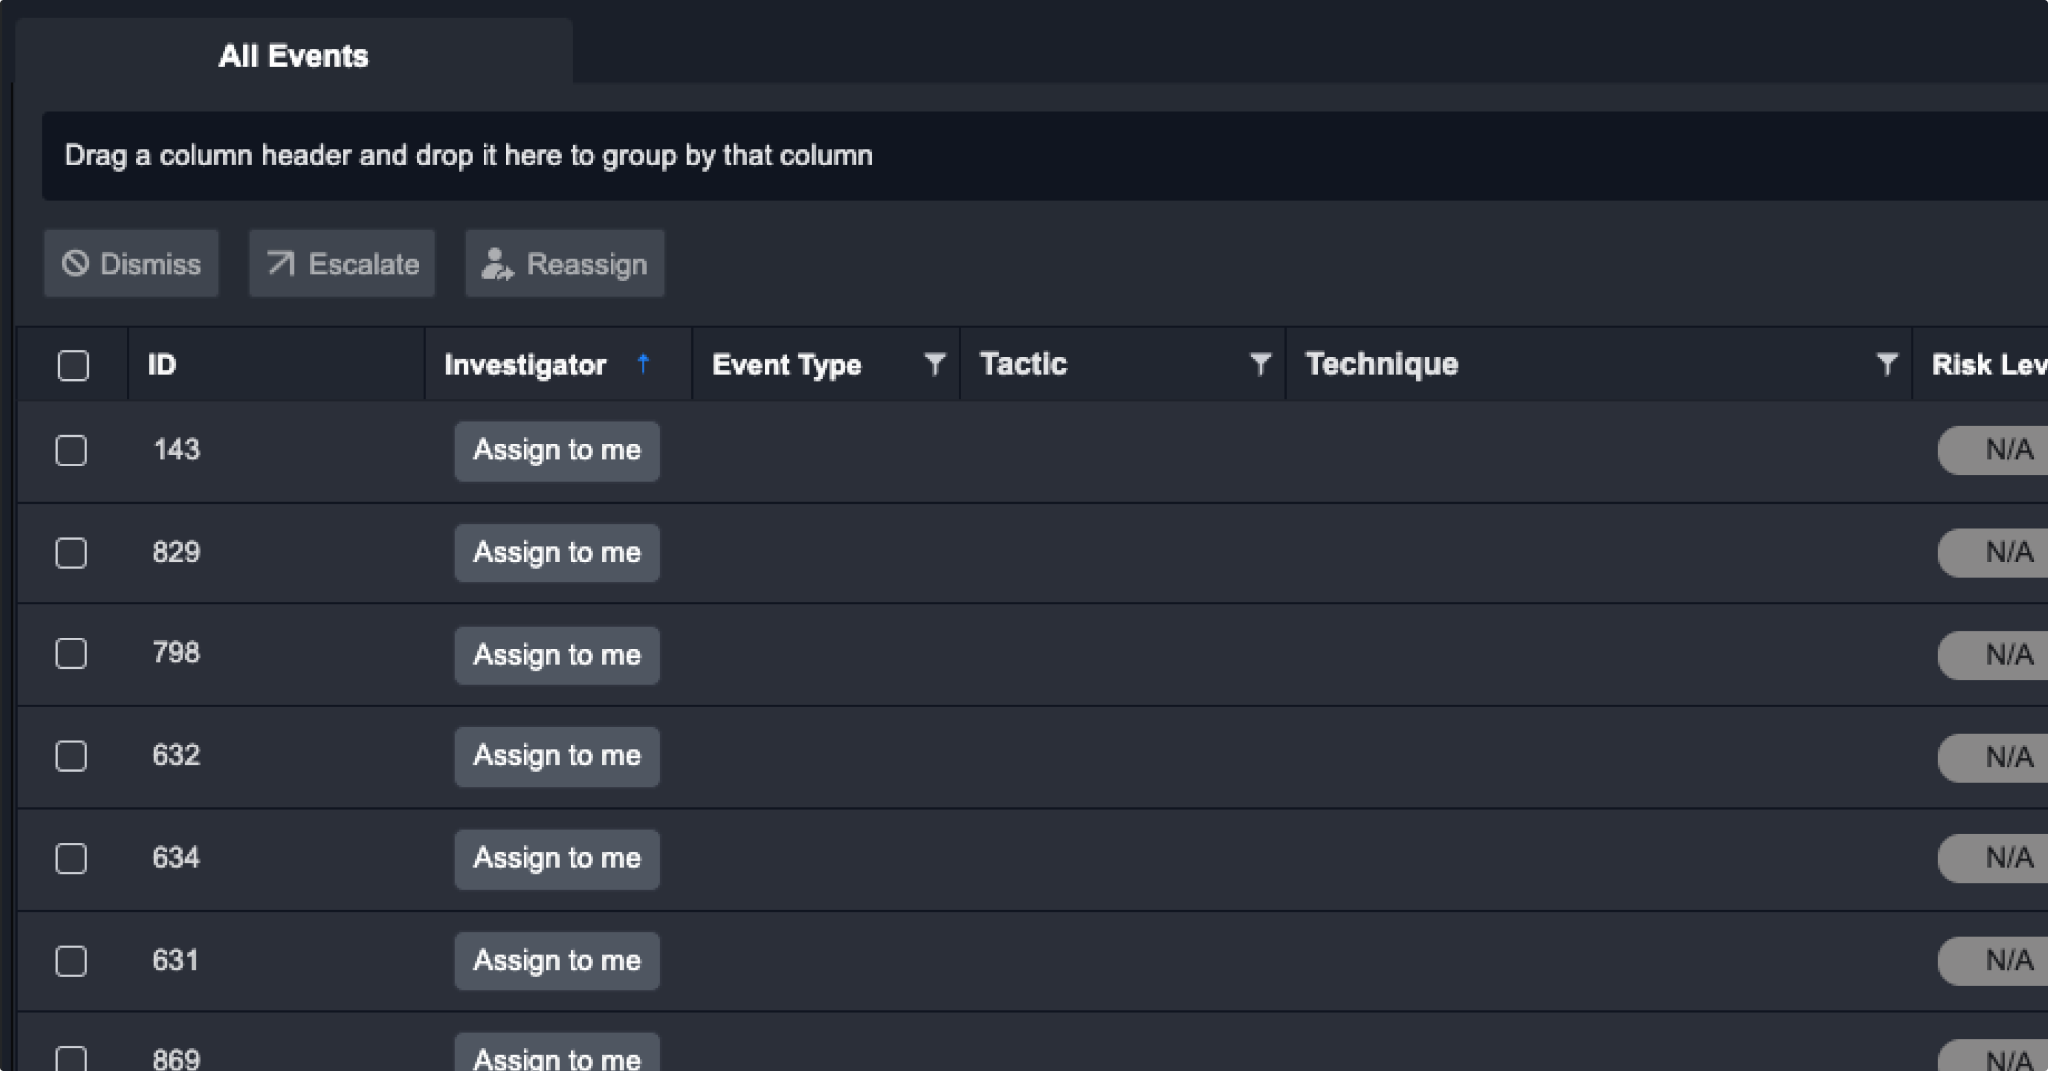
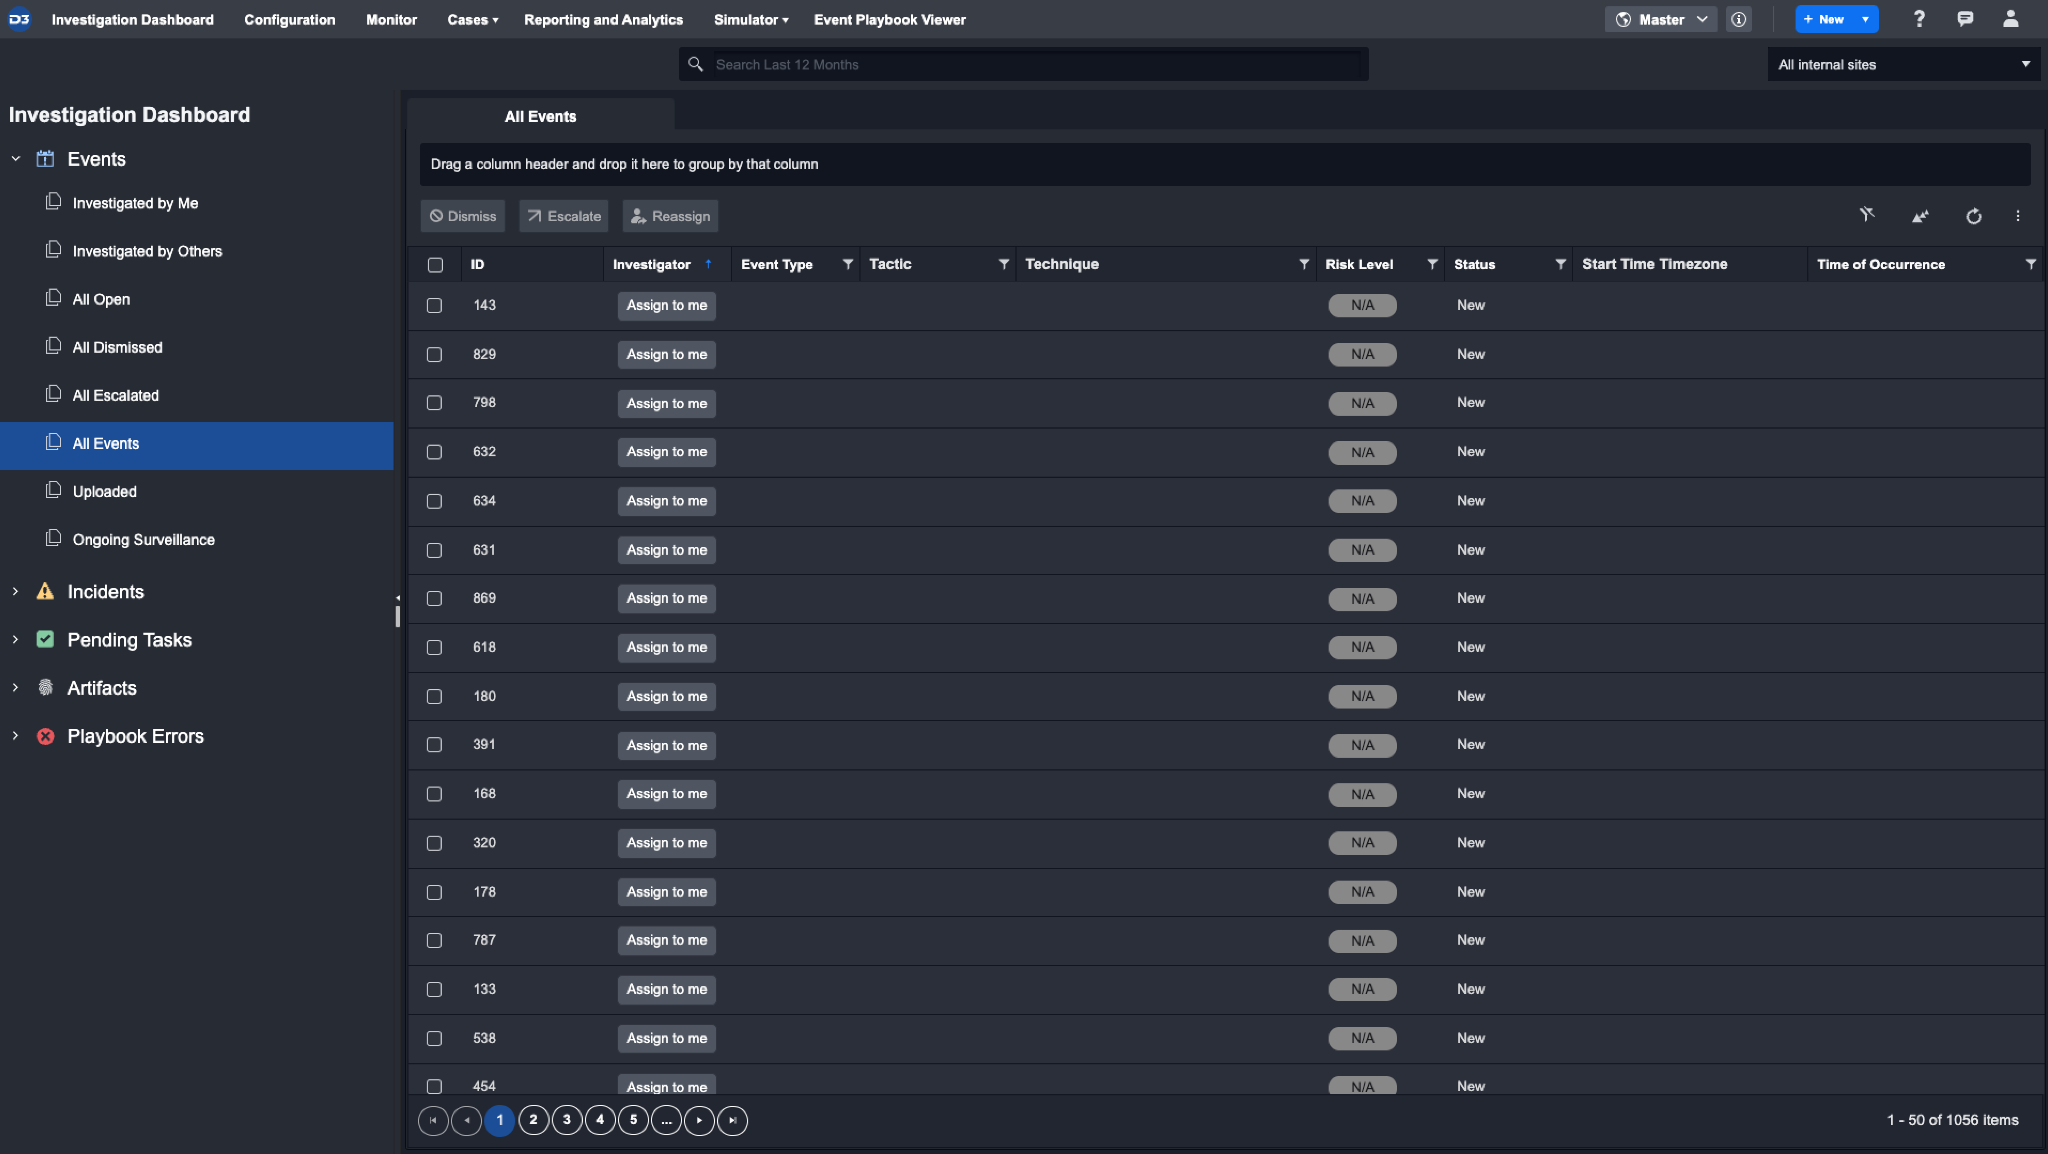
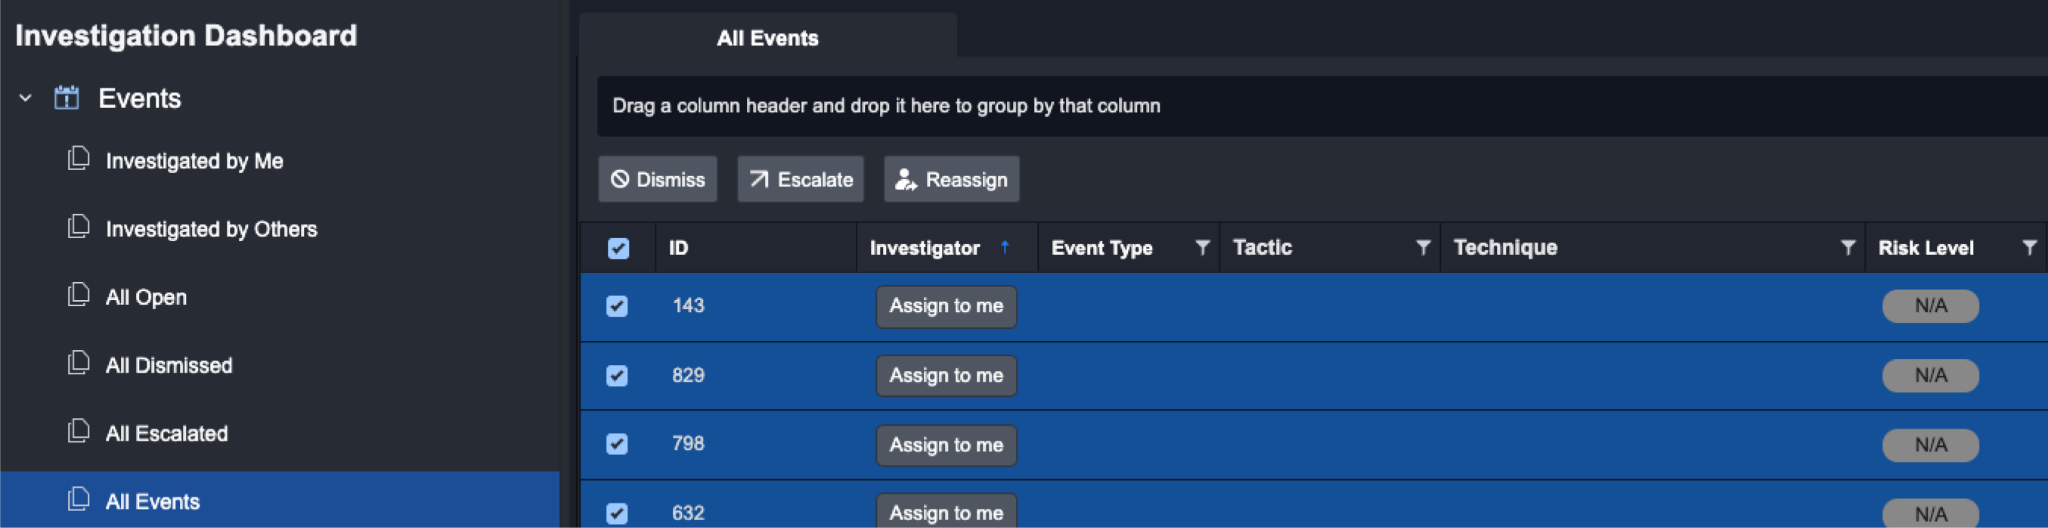
Events List
All Events in the events list are sorted by their time of occurrence and the time they were ingested into D3 SOAR.
From the event list, you can select an event to view the Event Details. You can also click on the Assign to Me button in the list view to assign yourself as the investigator. This informs other team members that an Event is currently being investigated by you.
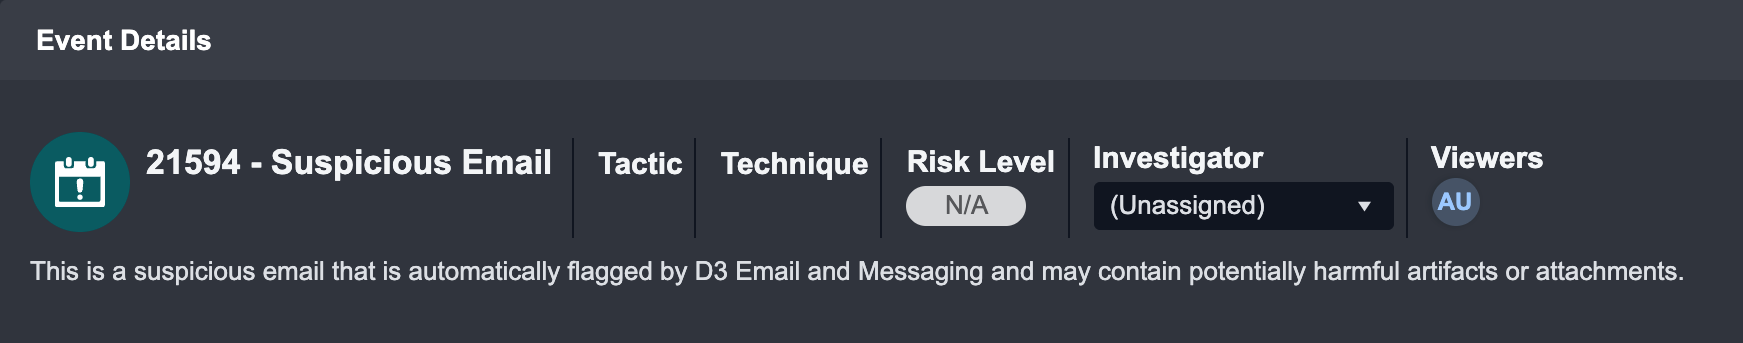
Event Details
Within the Event Details window, you can also reassign another user as the investigator. The list of investigators is located in the header of the popup window. This promotes team collaboration as analysts with extra capacity can be assigned to investigate more events. With this feature, SOC Managers can easily assign work to different team members, increasing efficiency for work management.
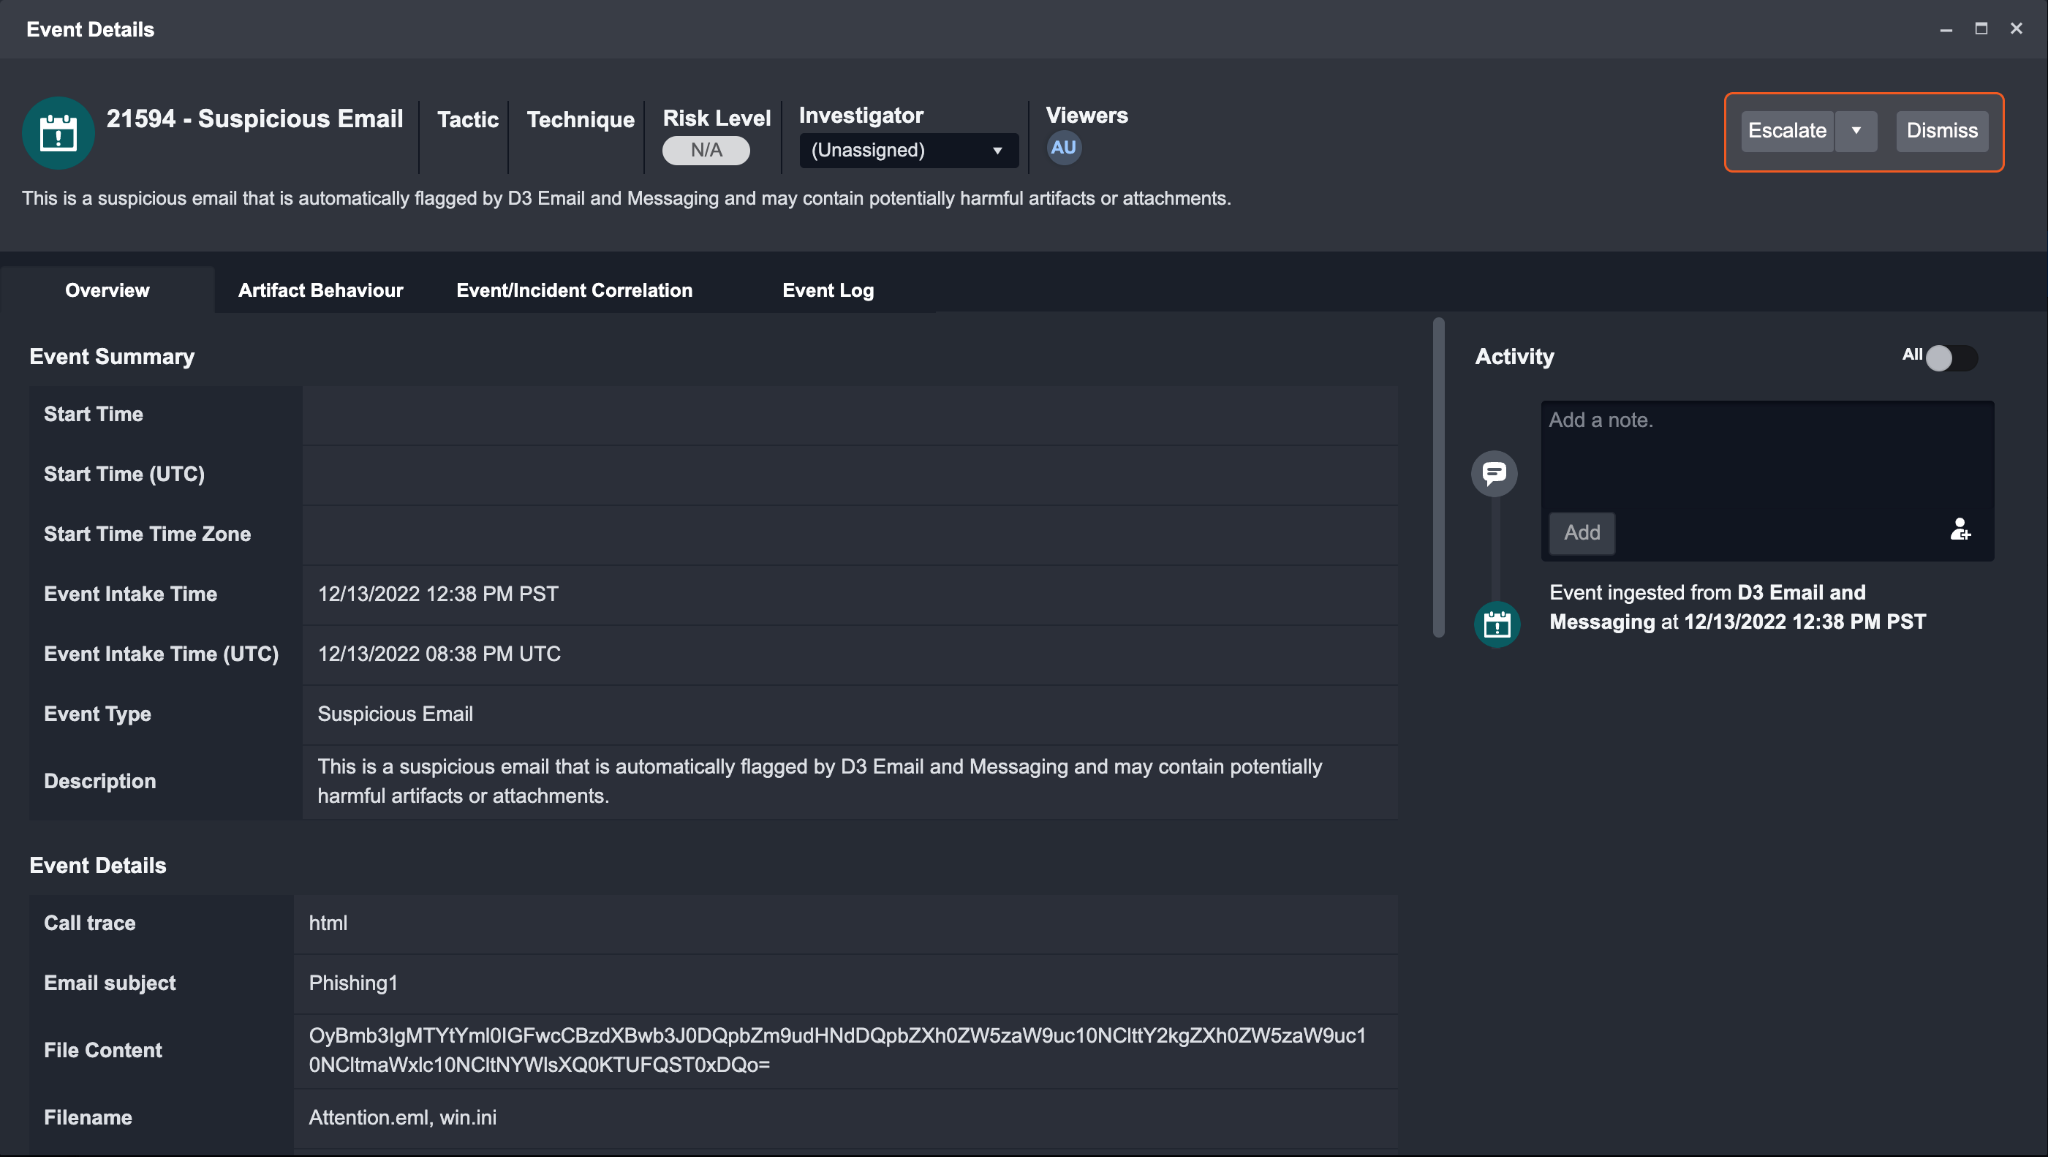
Event Overview
The Event Overview shows a summary of the event. It’s divided into three main sections: Event Summary, Event Details and Tactic & Technique.
On the right side of the event overview, there’s an Activity section. This is where you can leave notes to your colleagues by assigning it to them.
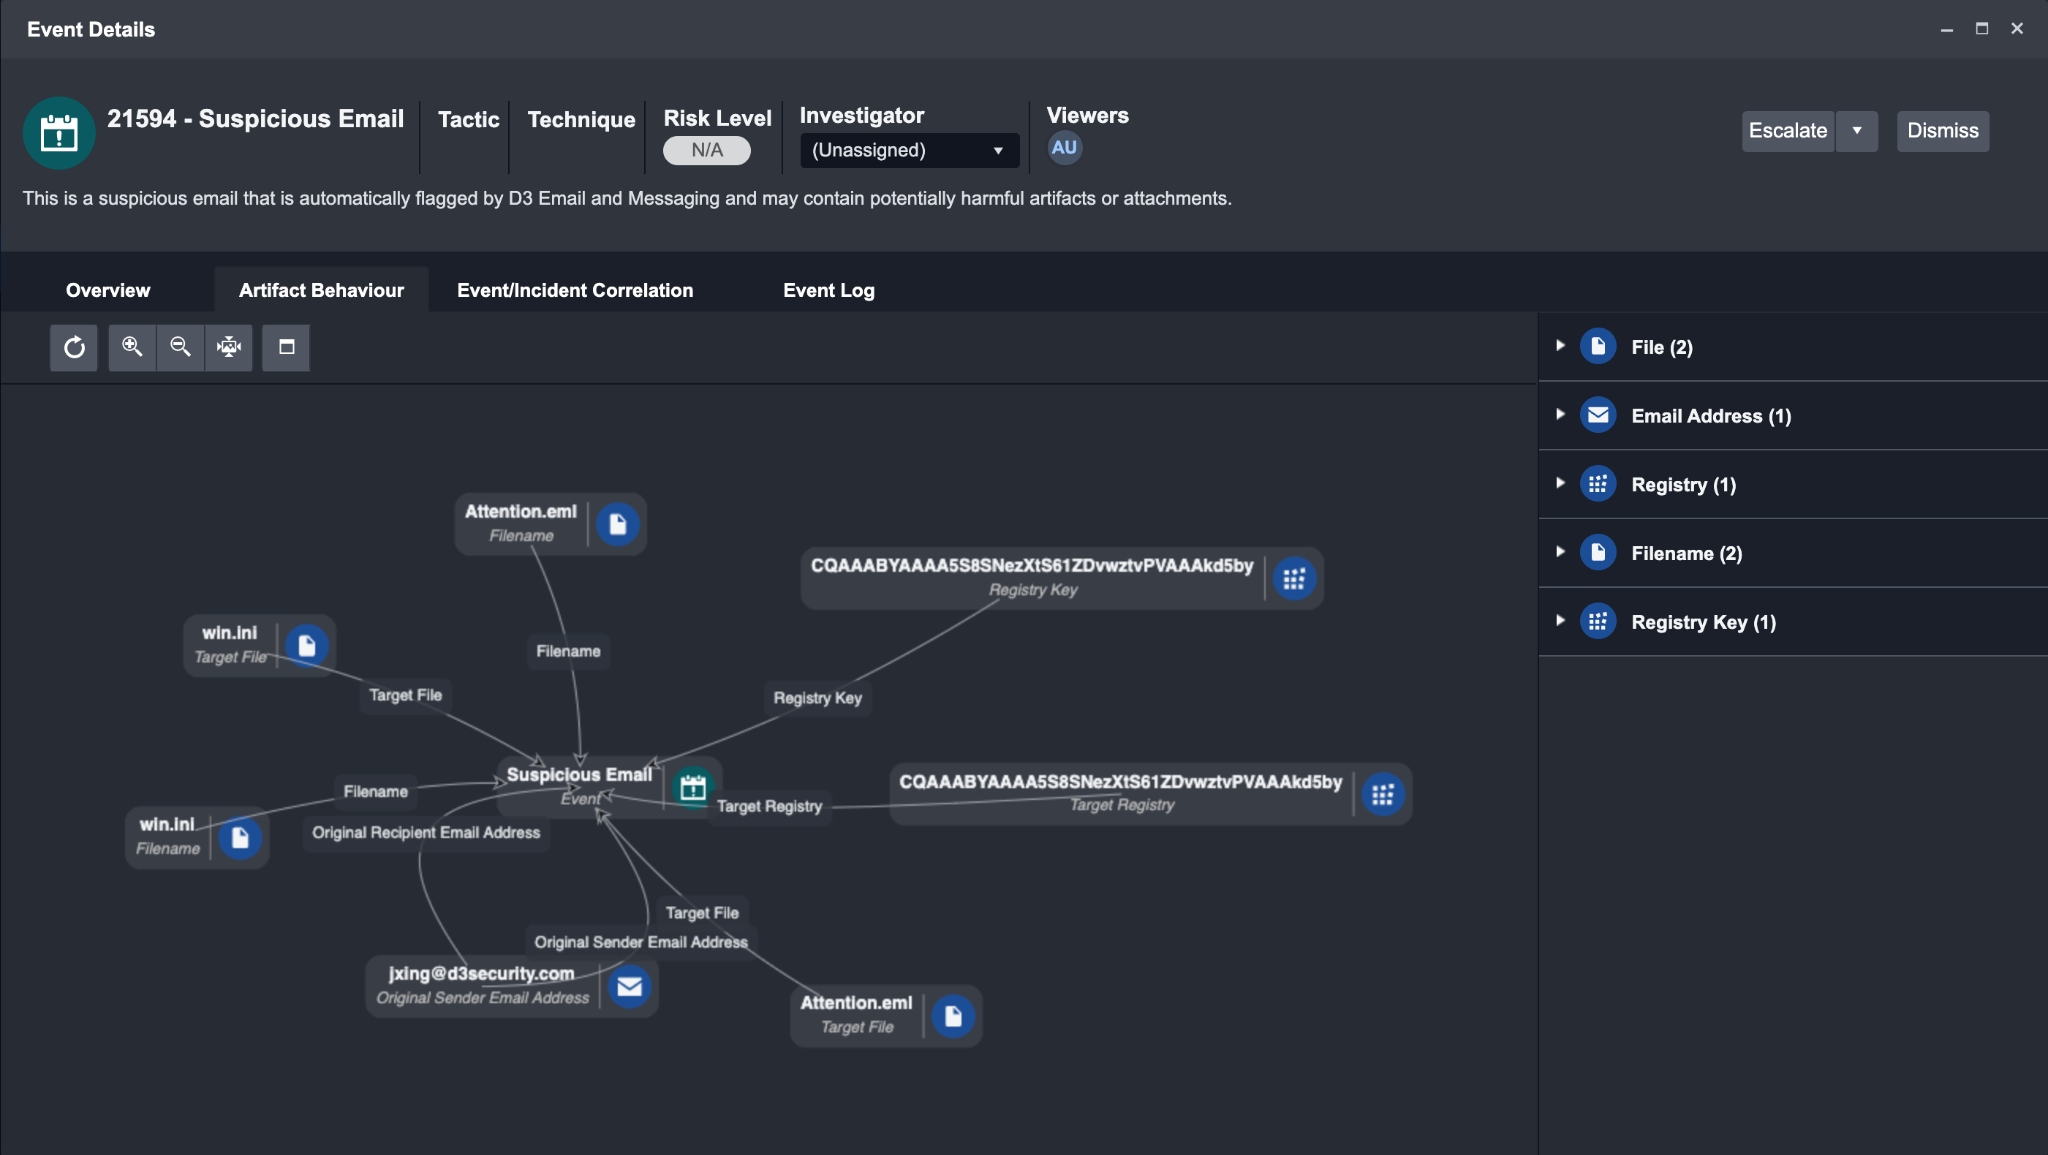
Artifact Behaviour
You can view a visualization of the relationship between linked artifacts in the Artifact Behaviour tab. Selecting an artifact in the right panel will highlight the artifact on the graph and reveal its details. Clicking on View Details in the right panel will open the Artifact Details window containing more information about the artifact such as the event count, related tactics / techniques, etc. Artifacts with a high risk level will be highlighted in red in the visualization.
Event and Incident Correlation Tab
In the Event and Incident Correlation tab, you can link the selected event with other relevant events and incidents. During the investigation, the correlation between significant events and incidents can inform you of the scale of potential cyberattacks, enabling you to conduct bulk escalation or dismissal of events if necessary.
This tab comprises two subtabs: Relevant Events and Relevant Incidents.
Relevant Events
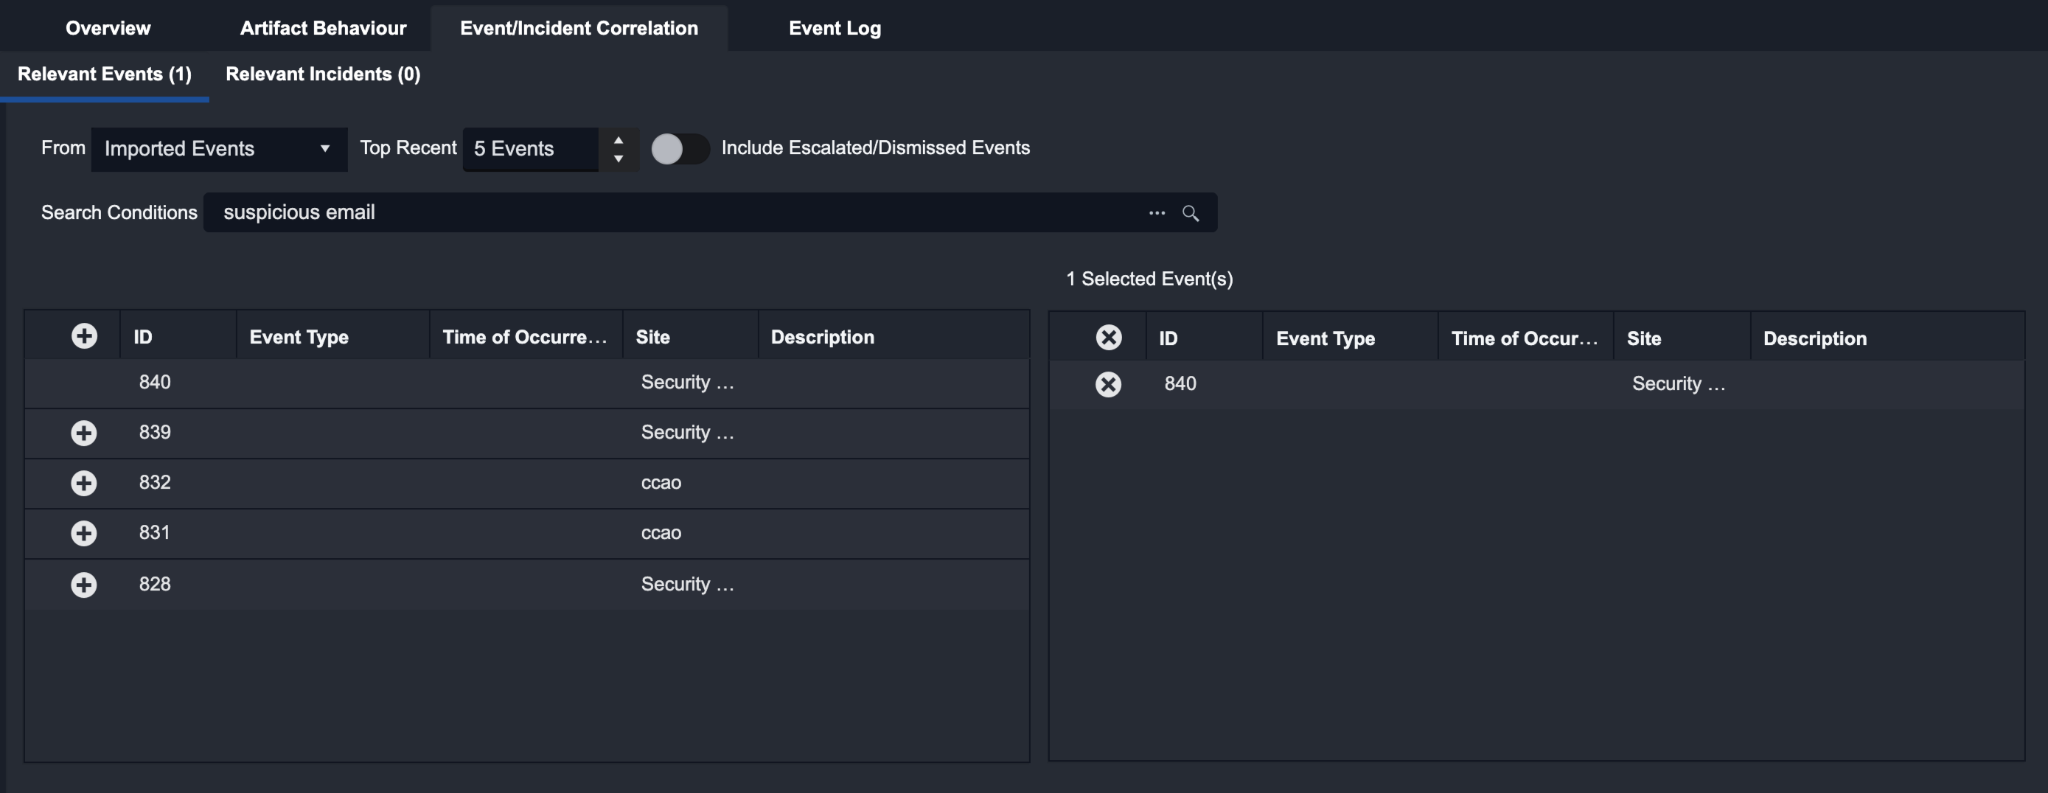
The screenshot above illustrates the result when the Imported Events data source option is selected from the dropdown list. If a specific Integration is selected instead, the screen will display an additional connection dropdown list where you can specify the connection datasource to search for events.
After filling out the rest of your search condition, the events that fit your criteria will be displayed in the table on the left. You can then select relevant events by clicking on the plus button. The selected events are then displayed in the table on the right. Once you’ve selected all the relevant events, you can perform a group escalation by clicking on the Escalate button. An incident will be created with all the relevant events linked to this incident. If you wish to escalate multiple events to existing incidents, please continue to the next section: Relevant Incidents.
Relevant Incidents
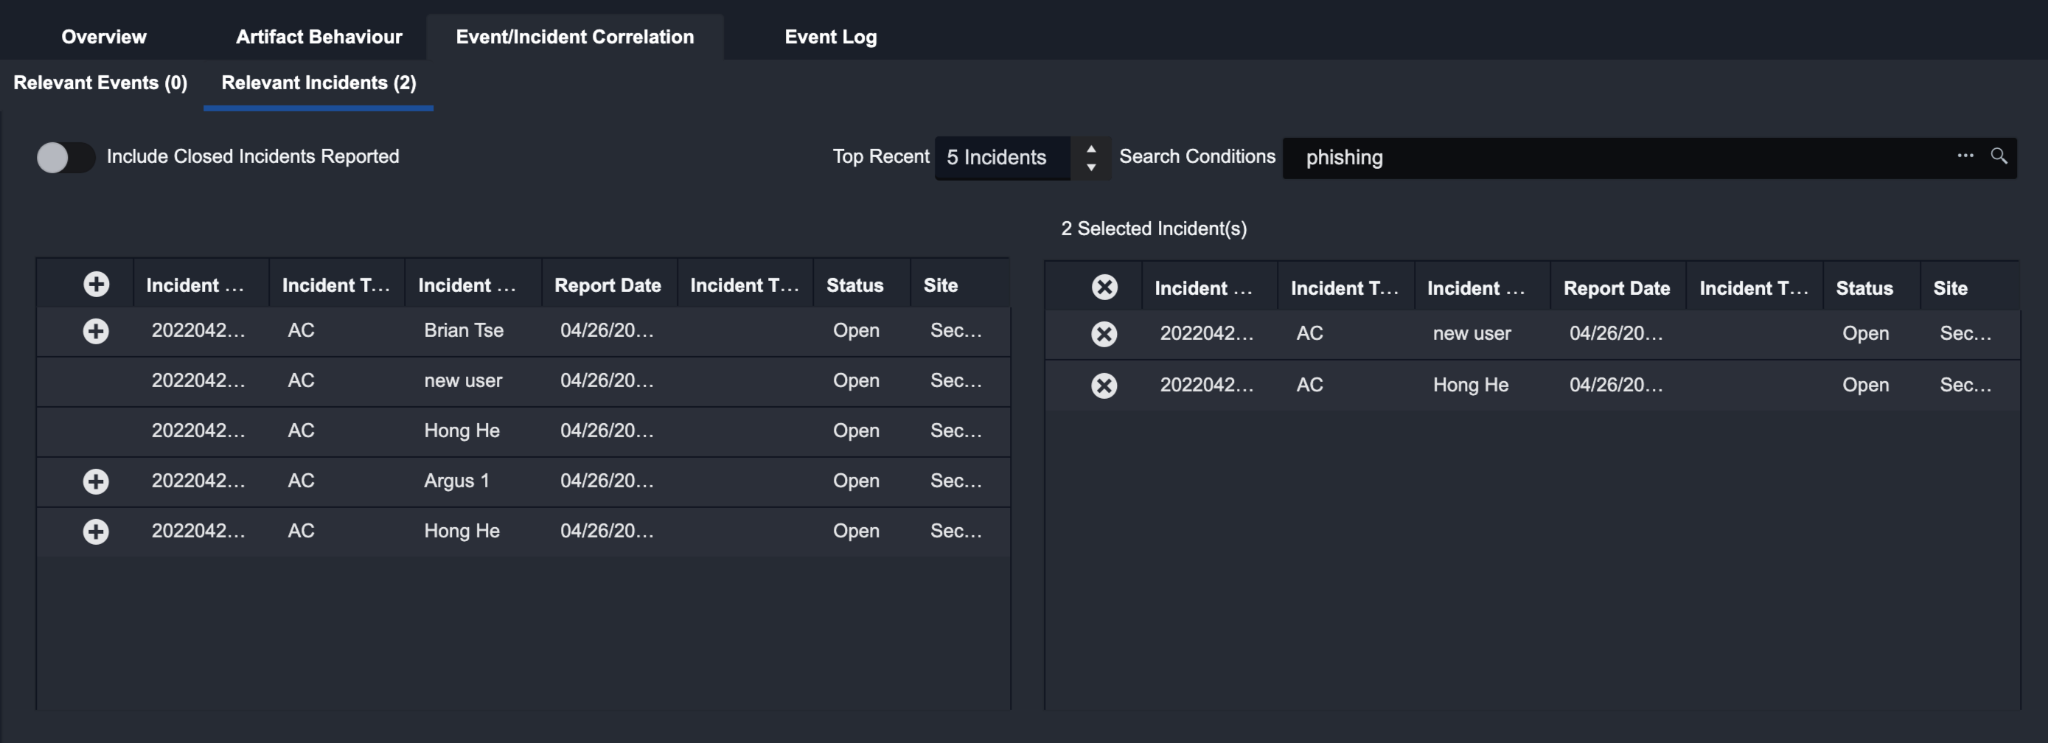
The Relevant Incidents tab follows the same logic as Relevant Events tab. The search results based on the search conditions specified will be listed in the table on the left, and the selected relevant incidents will appear in the table on the right. By clicking on Escalate, an incident will be created and the selected incidents will show up under the Linked Incidents section in the incident workspace. The selected events in the Relevant Events tab will also be linked to the newly created incident.
If you would like to link the event to an existing incident instead, click on the downward arrow in the Escalate button to and click on the option Add to selected relevant incident(s). This will link the relevant events to the selected incidents.
Event Log
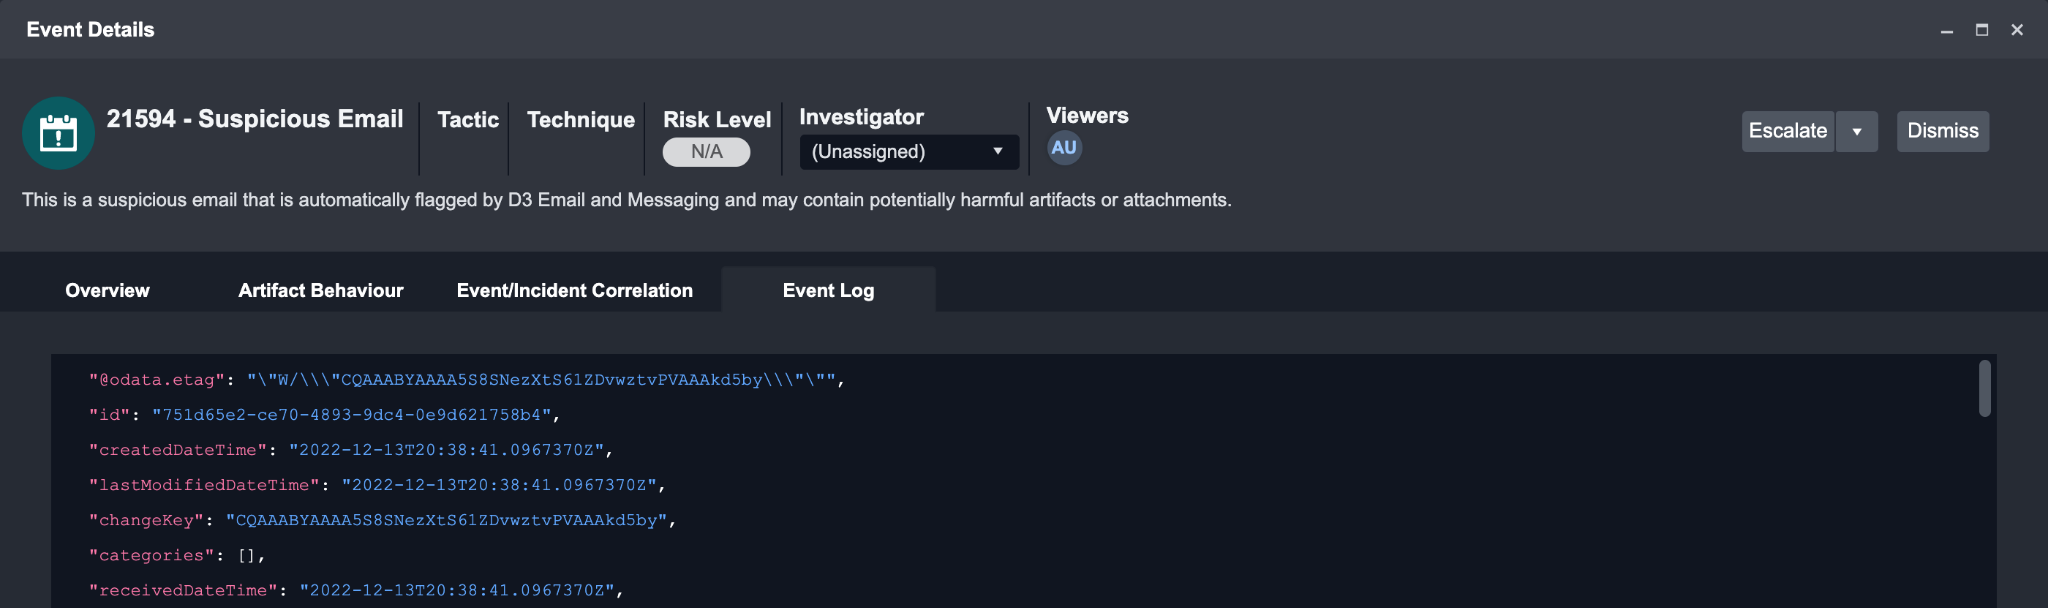
The data in Event Log is the unparsed, raw data ingested from an integration. You may find overlaps between the data shown in Overview and Event Log, that’s because the data in overview is parsed according to an integration’s field mapping.
Escalating and Dismissing an Event
Escalating an Event
You can escalate an event by clicking on the Escalate button. This brings up the Incident escalation form – here, you can fill in the relevant incident information before the event is escalated into an incident. If you are escalating multiple events at the same time, the blue notification banner will indicate the total number of events being escalated.
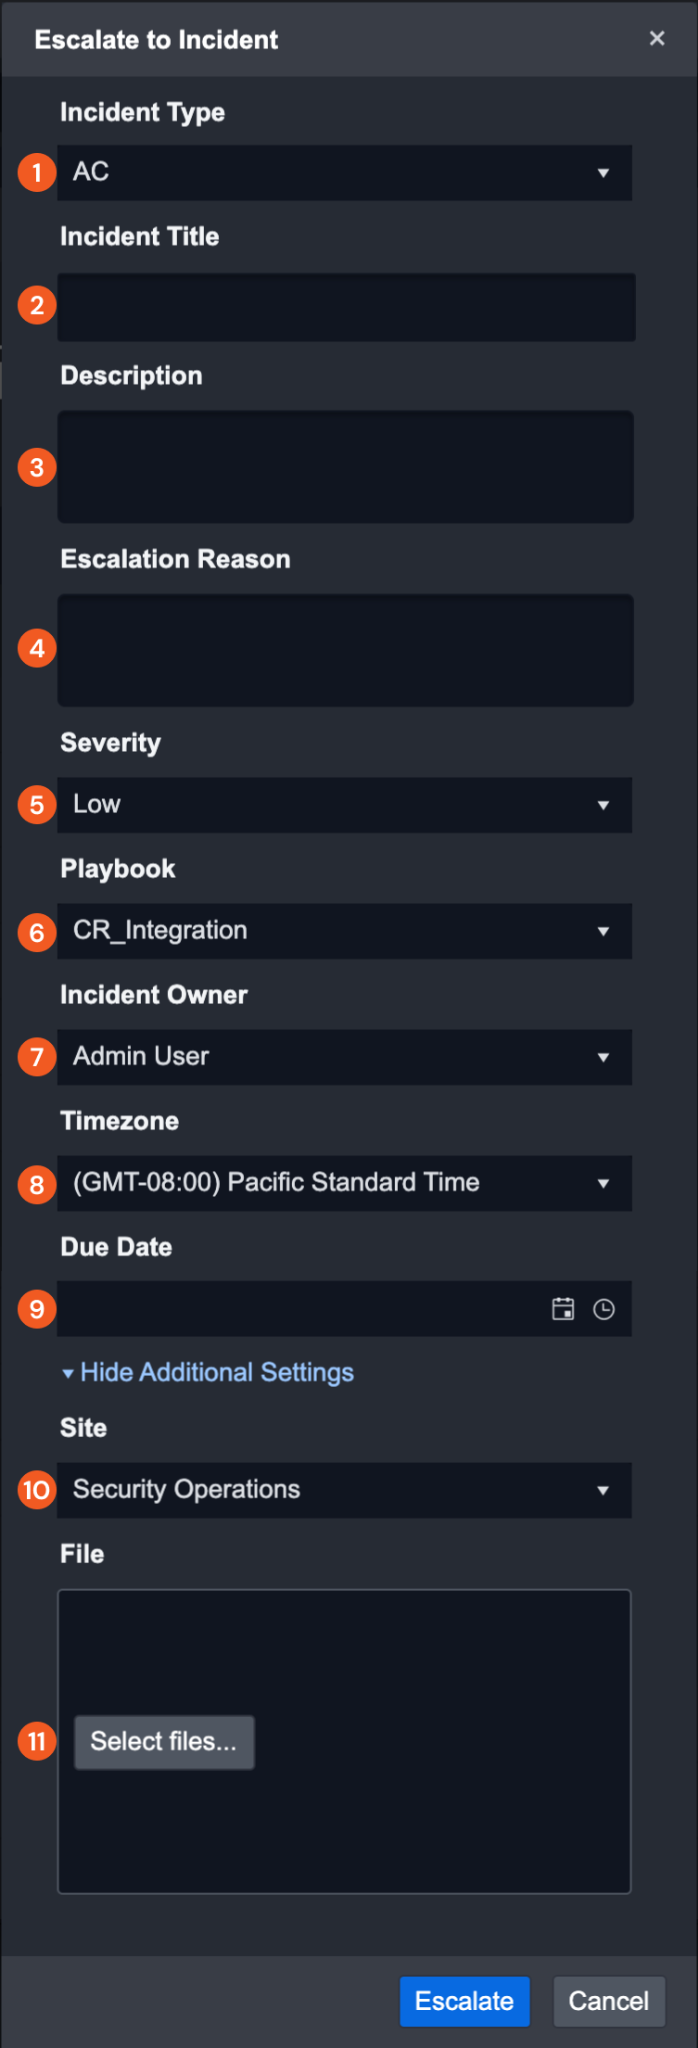
Anatomy of the Incident Escalation Form
Incident Type: Select an Incident Type from the dropdown list. Incident Types are configured in the Incident Form Editor.
Incident Title: Enter a unique title for the Incident. This name will be displayed in the Incidents List View. The incident title can be a JSON path placeholder
(e.g. Incident {{$.EventData.eventType}}).Description: Enter a general description about the incident. The description can be a JSON path placeholder.
Escalation Reason: Provide a brief reason for escalating the event.
Severity: Select High, Medium or Low severity level from the dropdown list.
Playbook: Select the relevant playbook from the dropdown list. The playbook’s commands will begin to run when the incident is created.
Incident Owner: Select an incident owner from the dropdown list. By default, this field will be populated by the escalator.
Timezone: Select the time zone of the region where the incident occurred.
Due Date: Enter a due date for the incident to be actioned or reviewed by a Tier 2 Analyst.
Site: Select the appropriate site from the dropdown list. Incidents can be filtered or only accessed when a particular site is selected in D3 SOAR.
File Attachment: Add attachments to the incident from this field if needed.
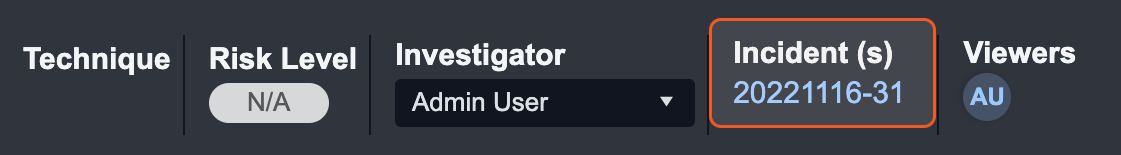
After an event has been escalated, the incident number will appear on the top right corner of the Event Details header. Click on this incident number to be redirected to the Incident Workspace.
Dismissing an Event
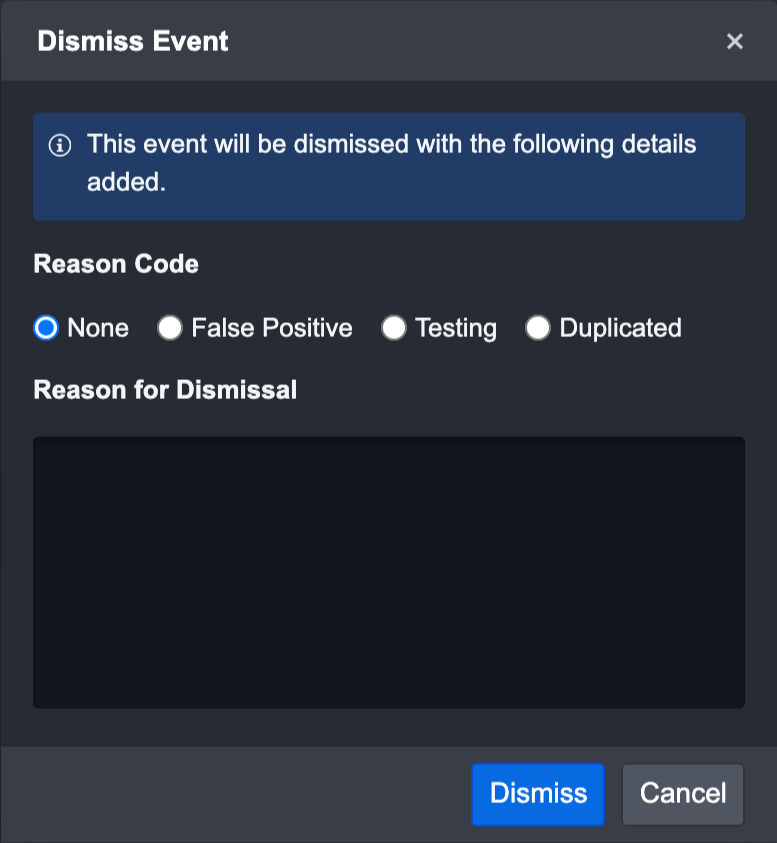
Alternatively, you can dismiss the event by clicking on the Dismiss button on the top right corner of the Event Details window. The Dismiss Events form will appear; in addition, there will be a notification to let you know that the correlated events or incidents selected in the Event & Incident Correlation tab will also be dismissed.
You can dismiss an event for reasons such as event testing, removal of false positives, and duplicated events. Select the appropriate Reason Code checkbox and click on the Dismiss button. You can also elaborate on the reason in the text field area below.
In the end, click Dismiss to confirm your action.
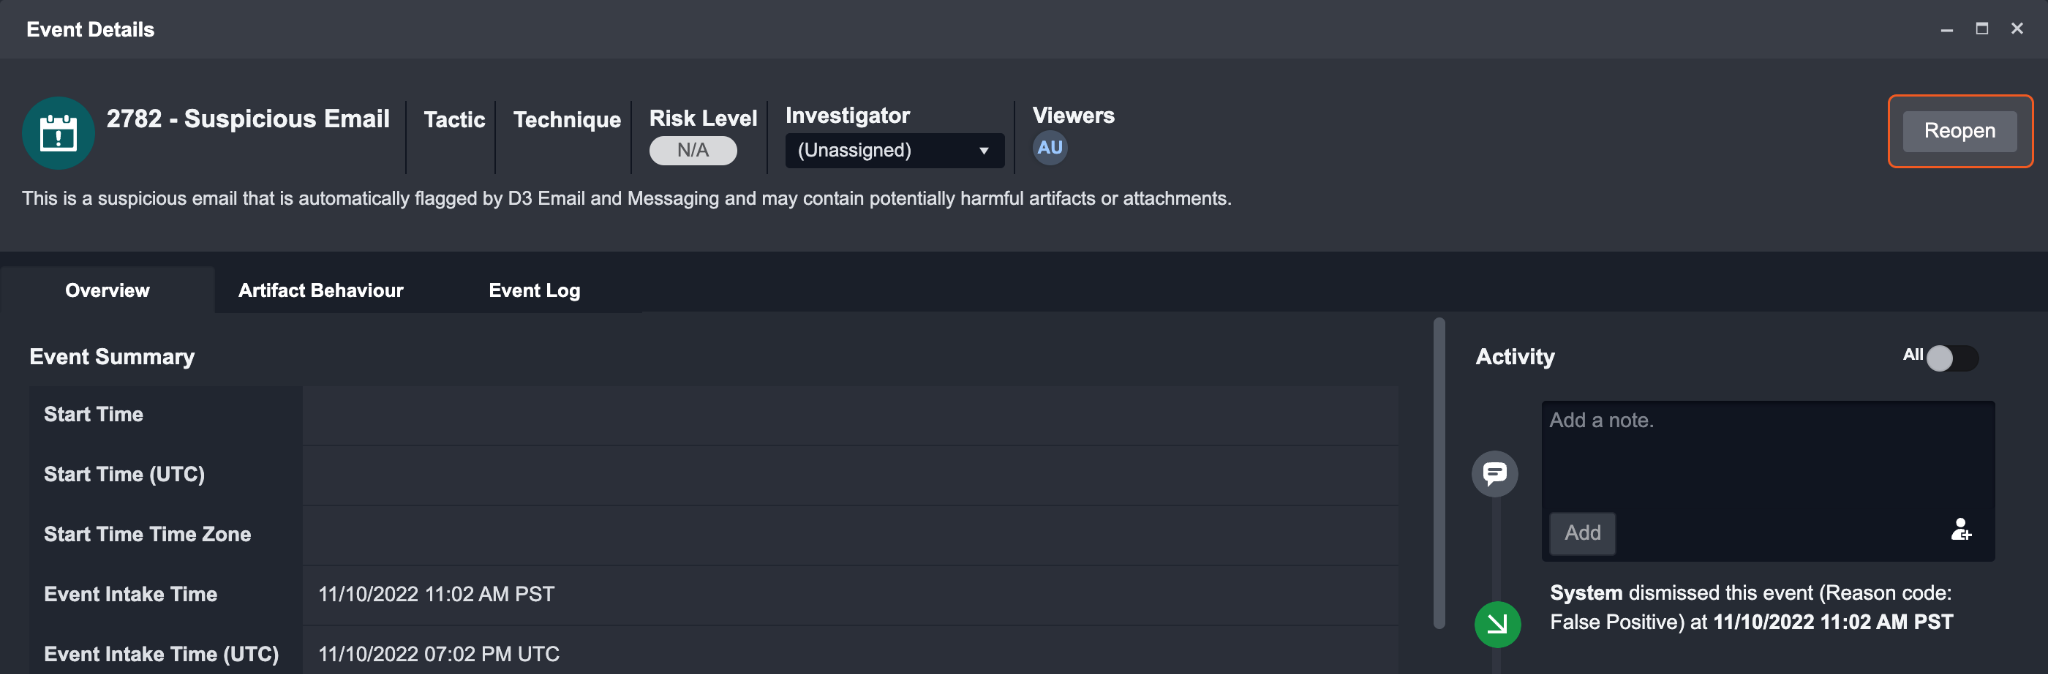
Dismissed events will appear in the All Dismissed tree view in the Events List. However, after an event has been dismissed, you can reopen it by clicking on the Reopen button in the event details header.
Bulk Action for Events
Bulk actions can only be performed on open events. Therefore, you will not see bulk action in All Dismissed and All Escalated list views because those events have previously been escalated or dismissed. However, in the case of mixed status events lists (e.g., all events and investigated by me), no action will be taken on events with the status other than open.
Multiple events can be escalated or dismissed at once. Additionally, you can also reassign several events to new investigators or unassign investigators through bulk selection.
Results
After performing batch dismiss or batch escalate on events, you will get one or more of the following messages:
Successful | Dismissing - Events that are in the process of being dismissed. You can click on Refresh all to view its updated status. In the case of a prolonged dismissing status, it could be caused by a pending task in their Event Playbook. Once the pending task has been resolved, the event becomes successfully dismissed. |
|---|---|
Dismissed - Events that have been successfully dismissed. You can record their corresponding event IDs as reference. | |
Escalating - Events that are in the process of being escalated. Clicking on Refresh all will update their status. | |
Escalated - Events that have been successfully escalated. Their event IDs are listed in the result message. | |
No action taken | On events that are either escalated or dismissed previously. |
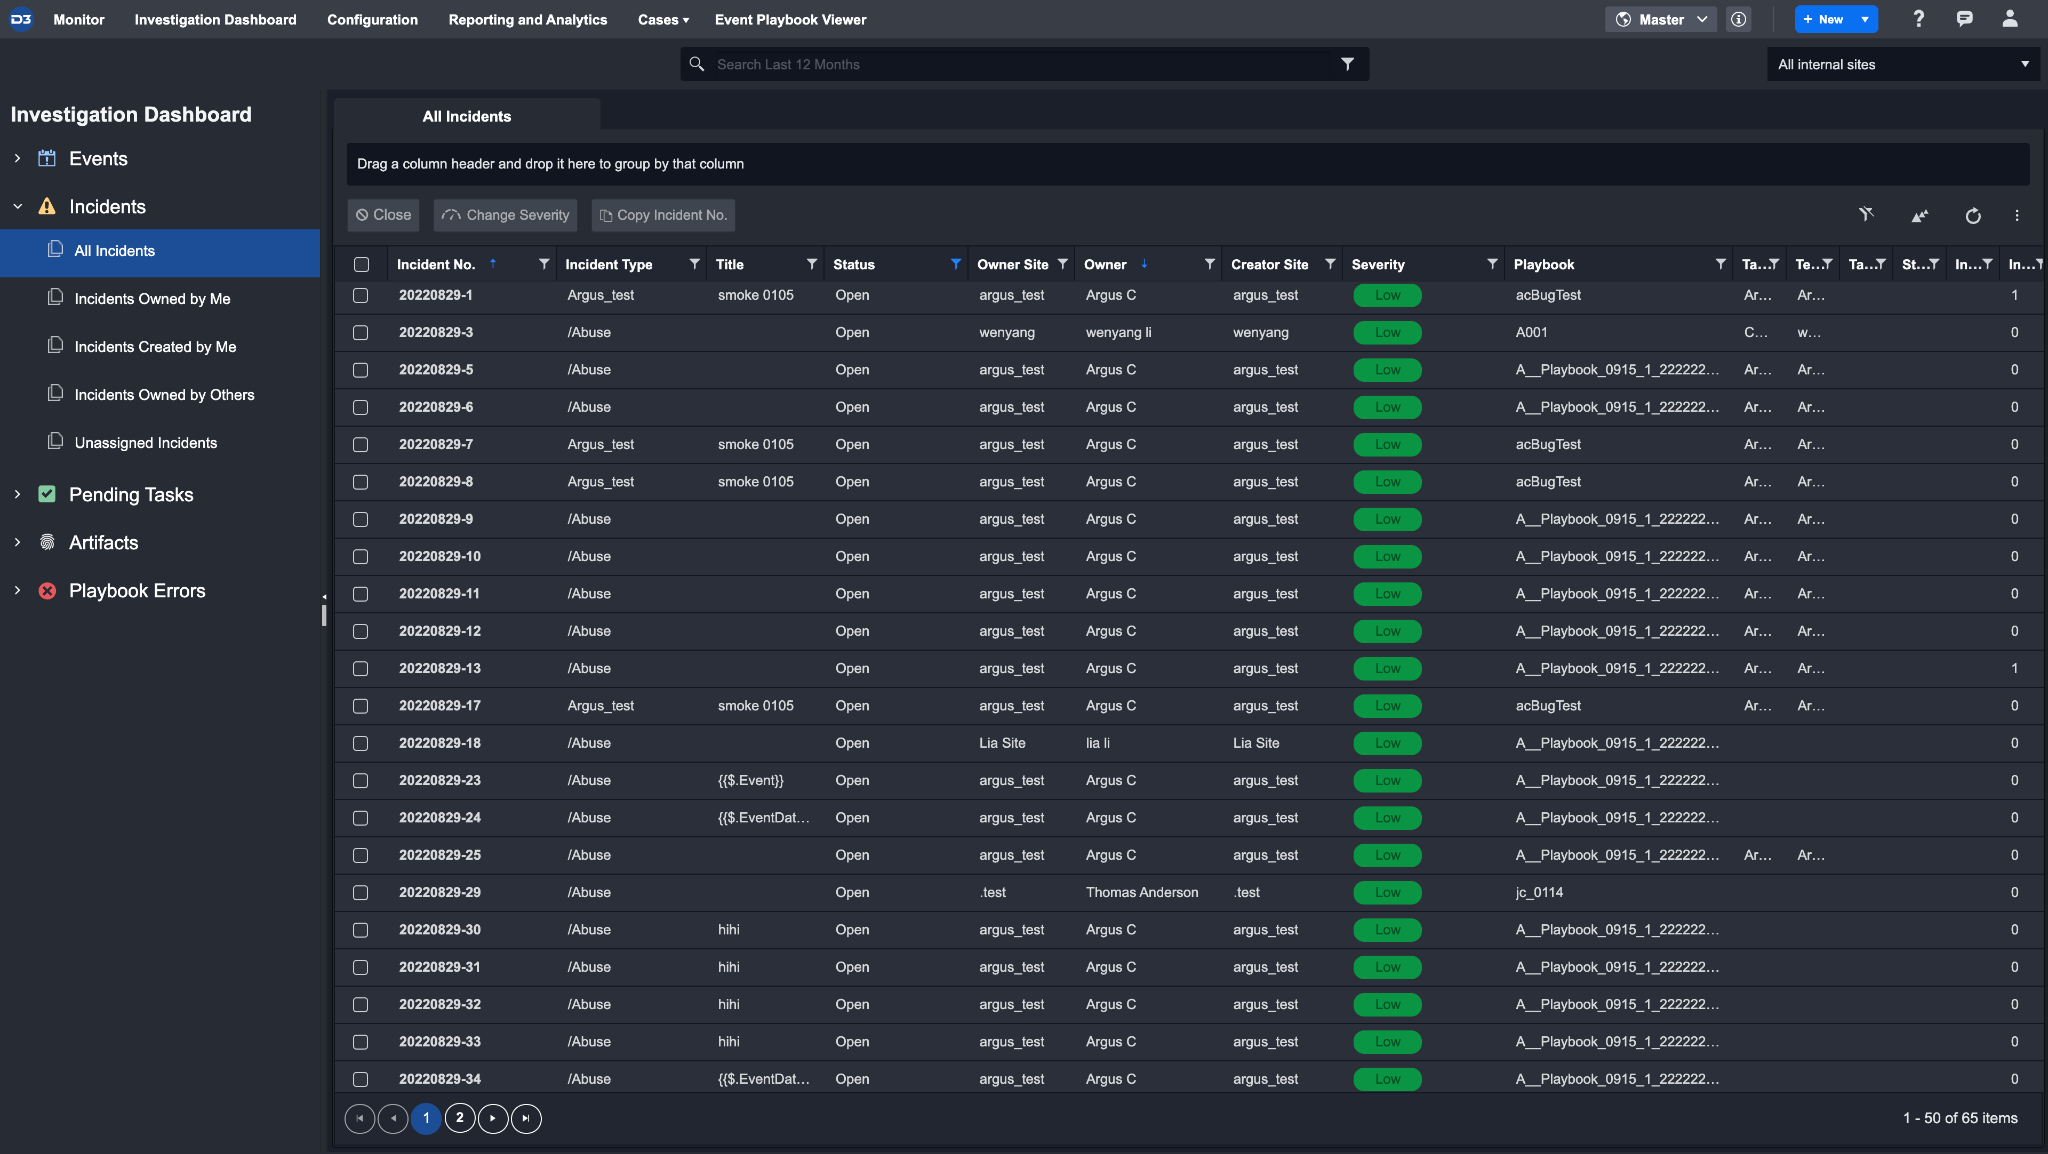
Incident List
The incident list contains all incidents created from escalation of an event, incidents ingested from an integration or with the button in the top right corner. Similar to the Event List, you can sort and apply filters on specific columns to create your preferred view. After clicking on any incident from the incident list, you will be directed to the Incident Workspace.
Reader Note
When you hover over an incident, there’s a share icon beside the incident number. You can click on it to copy the incident link. If you cannot see this icon, you may have to drag to widen the incident column.
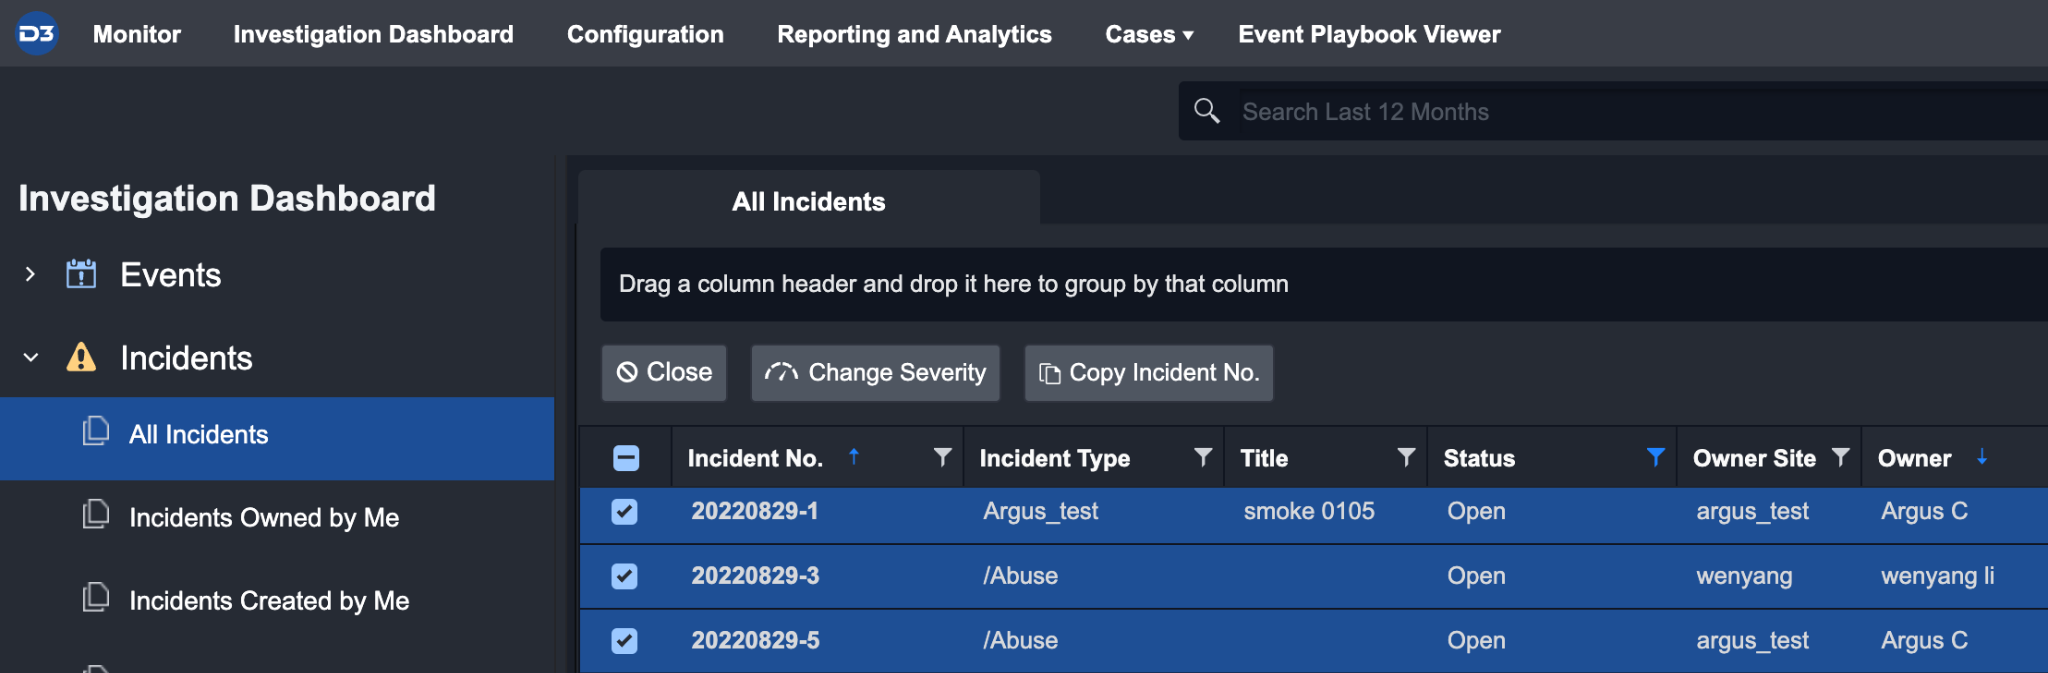
Bulk Action for Incidents
Multiple incidents can be batch closed or changed in severity. An incident will not close if there are pending tasks in its playbook. The system will inform you of the reason for the unsuccessful closure. Additionally, you can copy multiple incident numbers through bulk selection.
Reader Note
Bulk action checkboxes are enabled by default as a column on the Investigation Dashboard. You can hide the column by clicking on the ellipsis icon, and choosing Columns, then checking off ‘Bulk Action’. If bulk action is not available for certain list views, you will not find this option in Columns.
Incident Statuses
Incident statuses are used to manage the different stages of an incident's lifecycle. The four possible incident statuses include Open, In Progress, On Hold, and Closed. These statuses help you keep track of the progress of an incident and enable you to implement a structured incident response workflow.
Results
After performing batch close incidents, you will get one or more of the following messages:
Successful | This shows incident(s) that have been successfully closed. It also lists their corresponding numbers so you can record them for reference. |
|---|---|
Failed | The incident(s) that have not been closed and the reasons for their unsuccessful closure. |
No action taken | This result shows the incidents that were closed previously. |
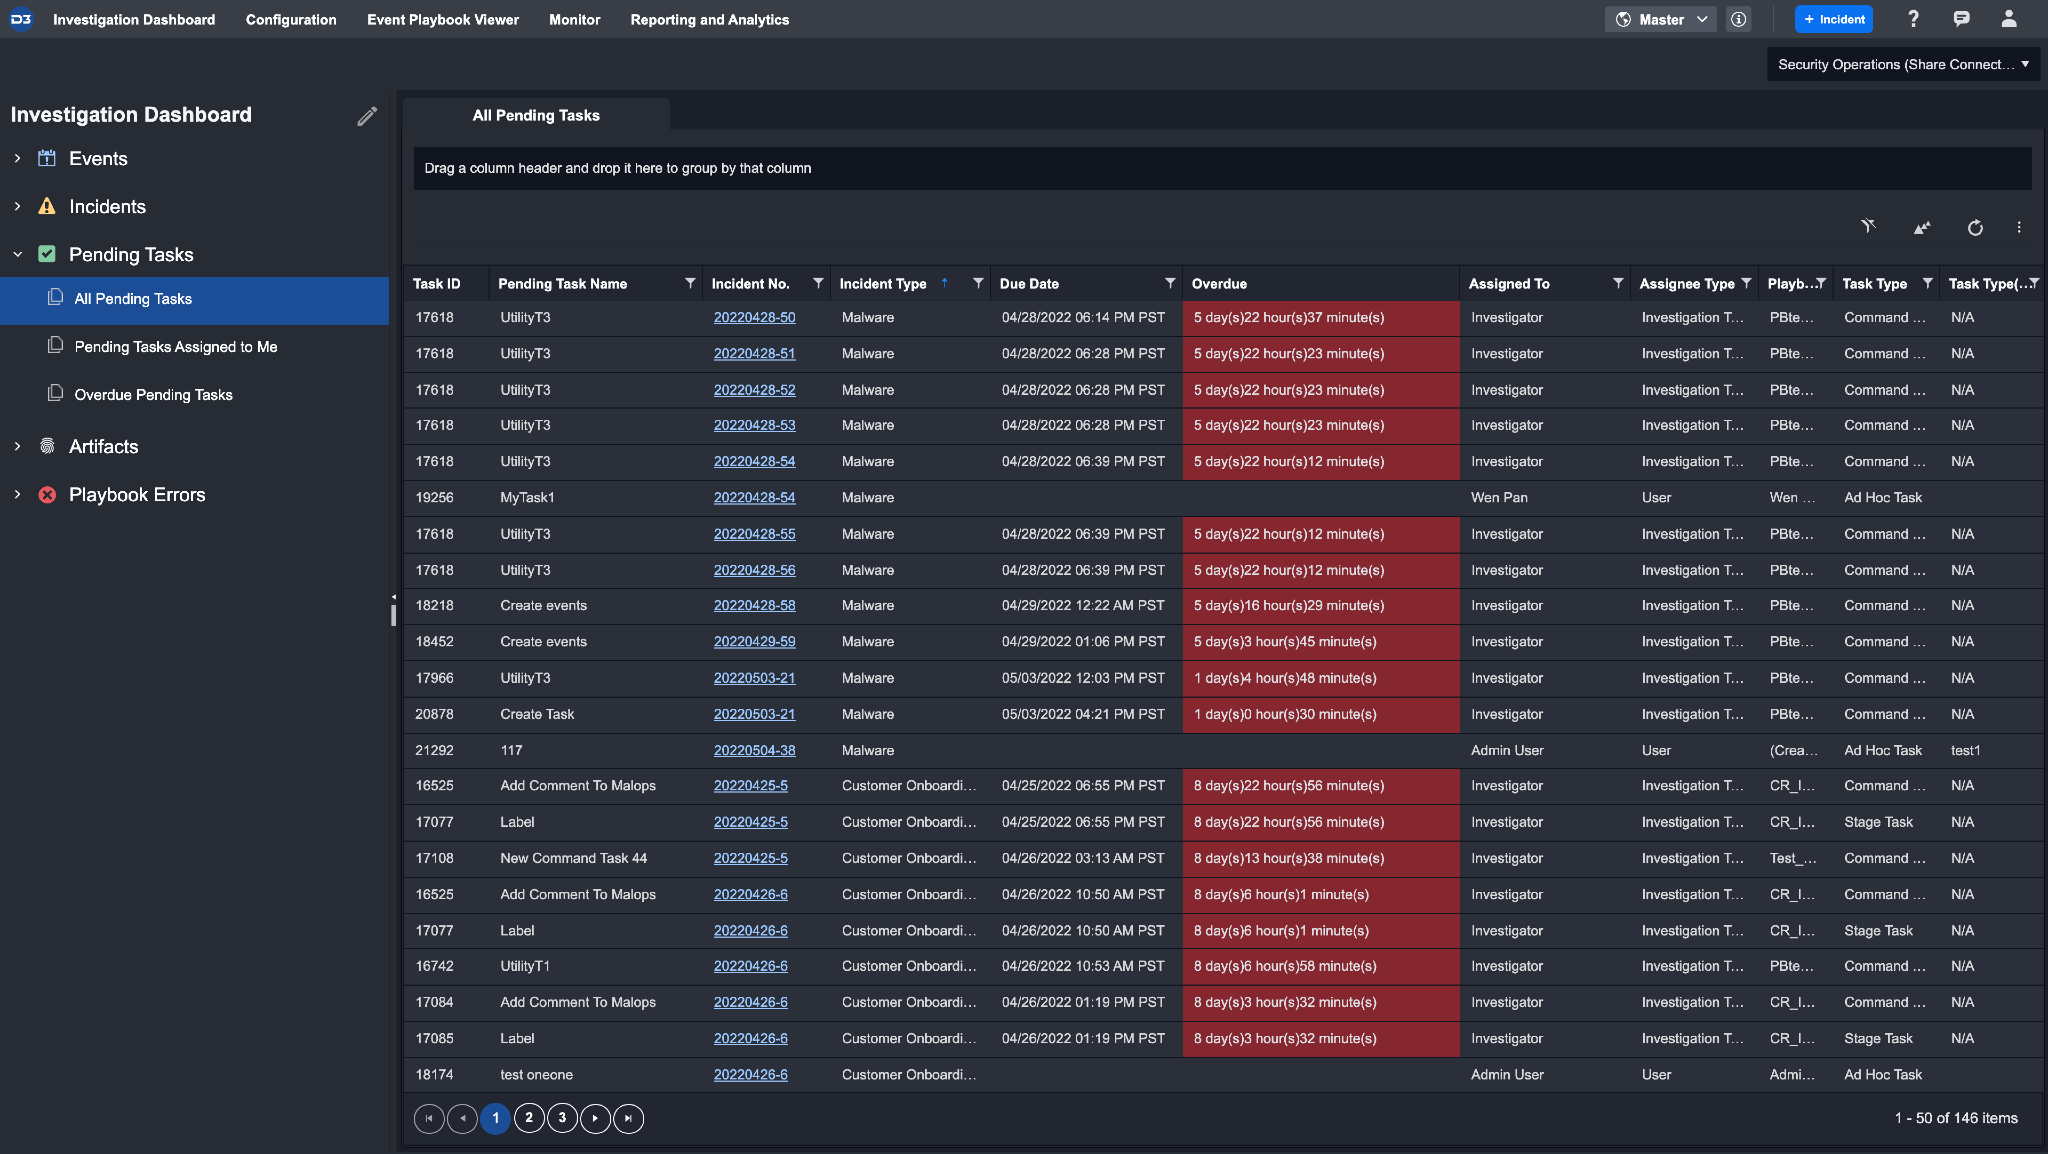
Pending Tasks List
The pending tasks list displays all ad hoc and playbook tasks that require the user's manual input in order for the rest of the playbook to run successfully.
The list consists of tasks across all incident types and highlights the due date of each task. The Overdue column is red to indicate which tasks are overdue, and the elapsed time.
This information is useful for when you need to perform multiple incident reviews daily and need to identify which tasks require immediate action for containment, eradication and recovery purposes. Selecting any pending task from the list will open up the playbook task details or ad hoc task detail window where additional details and follow-up action can be performed. These actions are covered in the Pending Tasks section of the Incident Workspace.
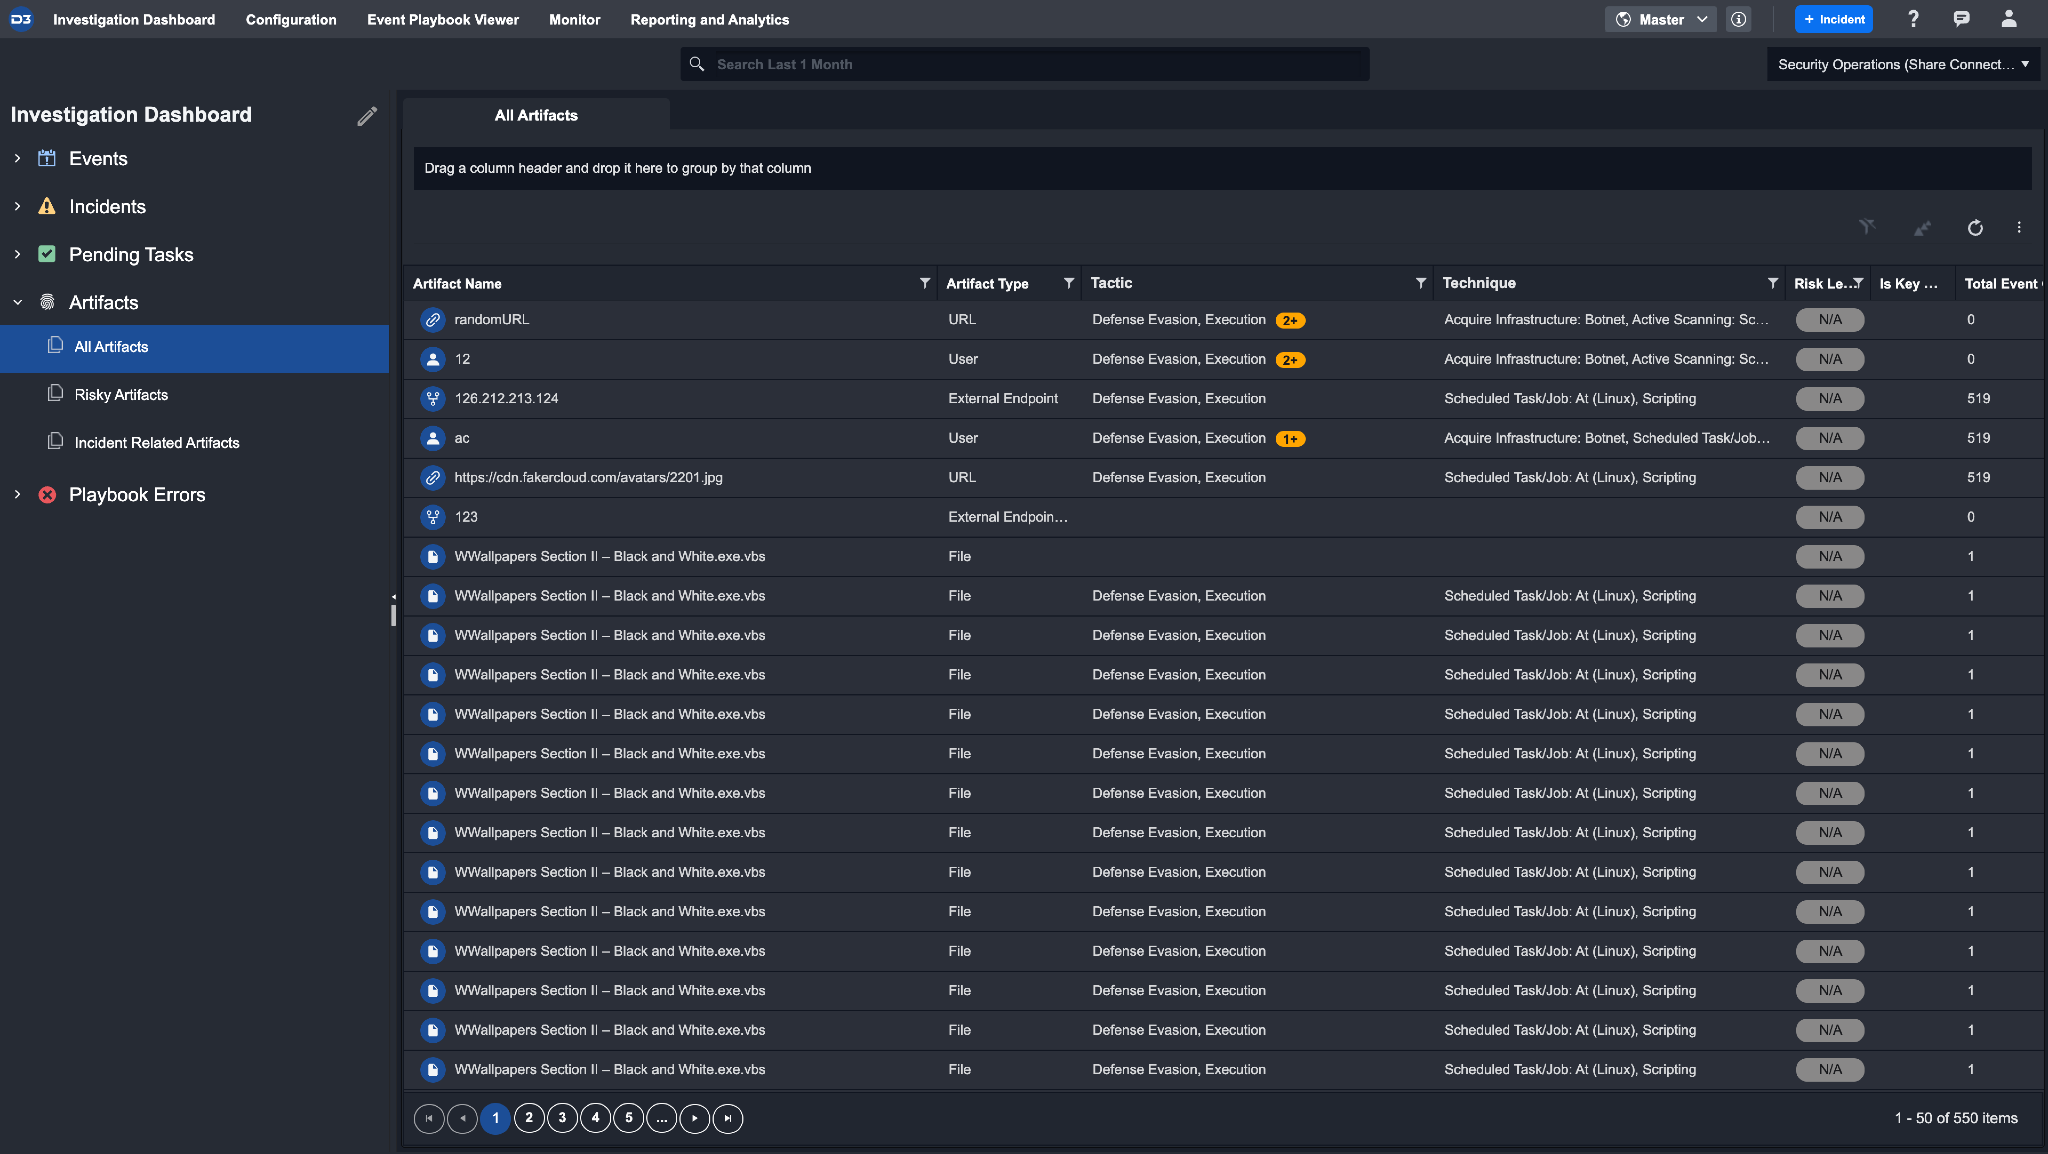
Artifacts List
The artifacts list shows all artifacts that originate from an event and/or incident. You can custom sort and apply filters on specific columns to create your preferred view. There are 3 built-in triages under the artifact list:
All Artifacts
Risky Artifacts (Medium or greater risk level)
Investigated Artifacts (Artifacts related to incidents)
Within the artifacts list, you will see two different types of artifacts:
Built-in Artifacts—Indicated by blue icons
Custom Artifacts—Indicated by orange icons. See Artifacts in configurations to learn about creating custom artifact types.
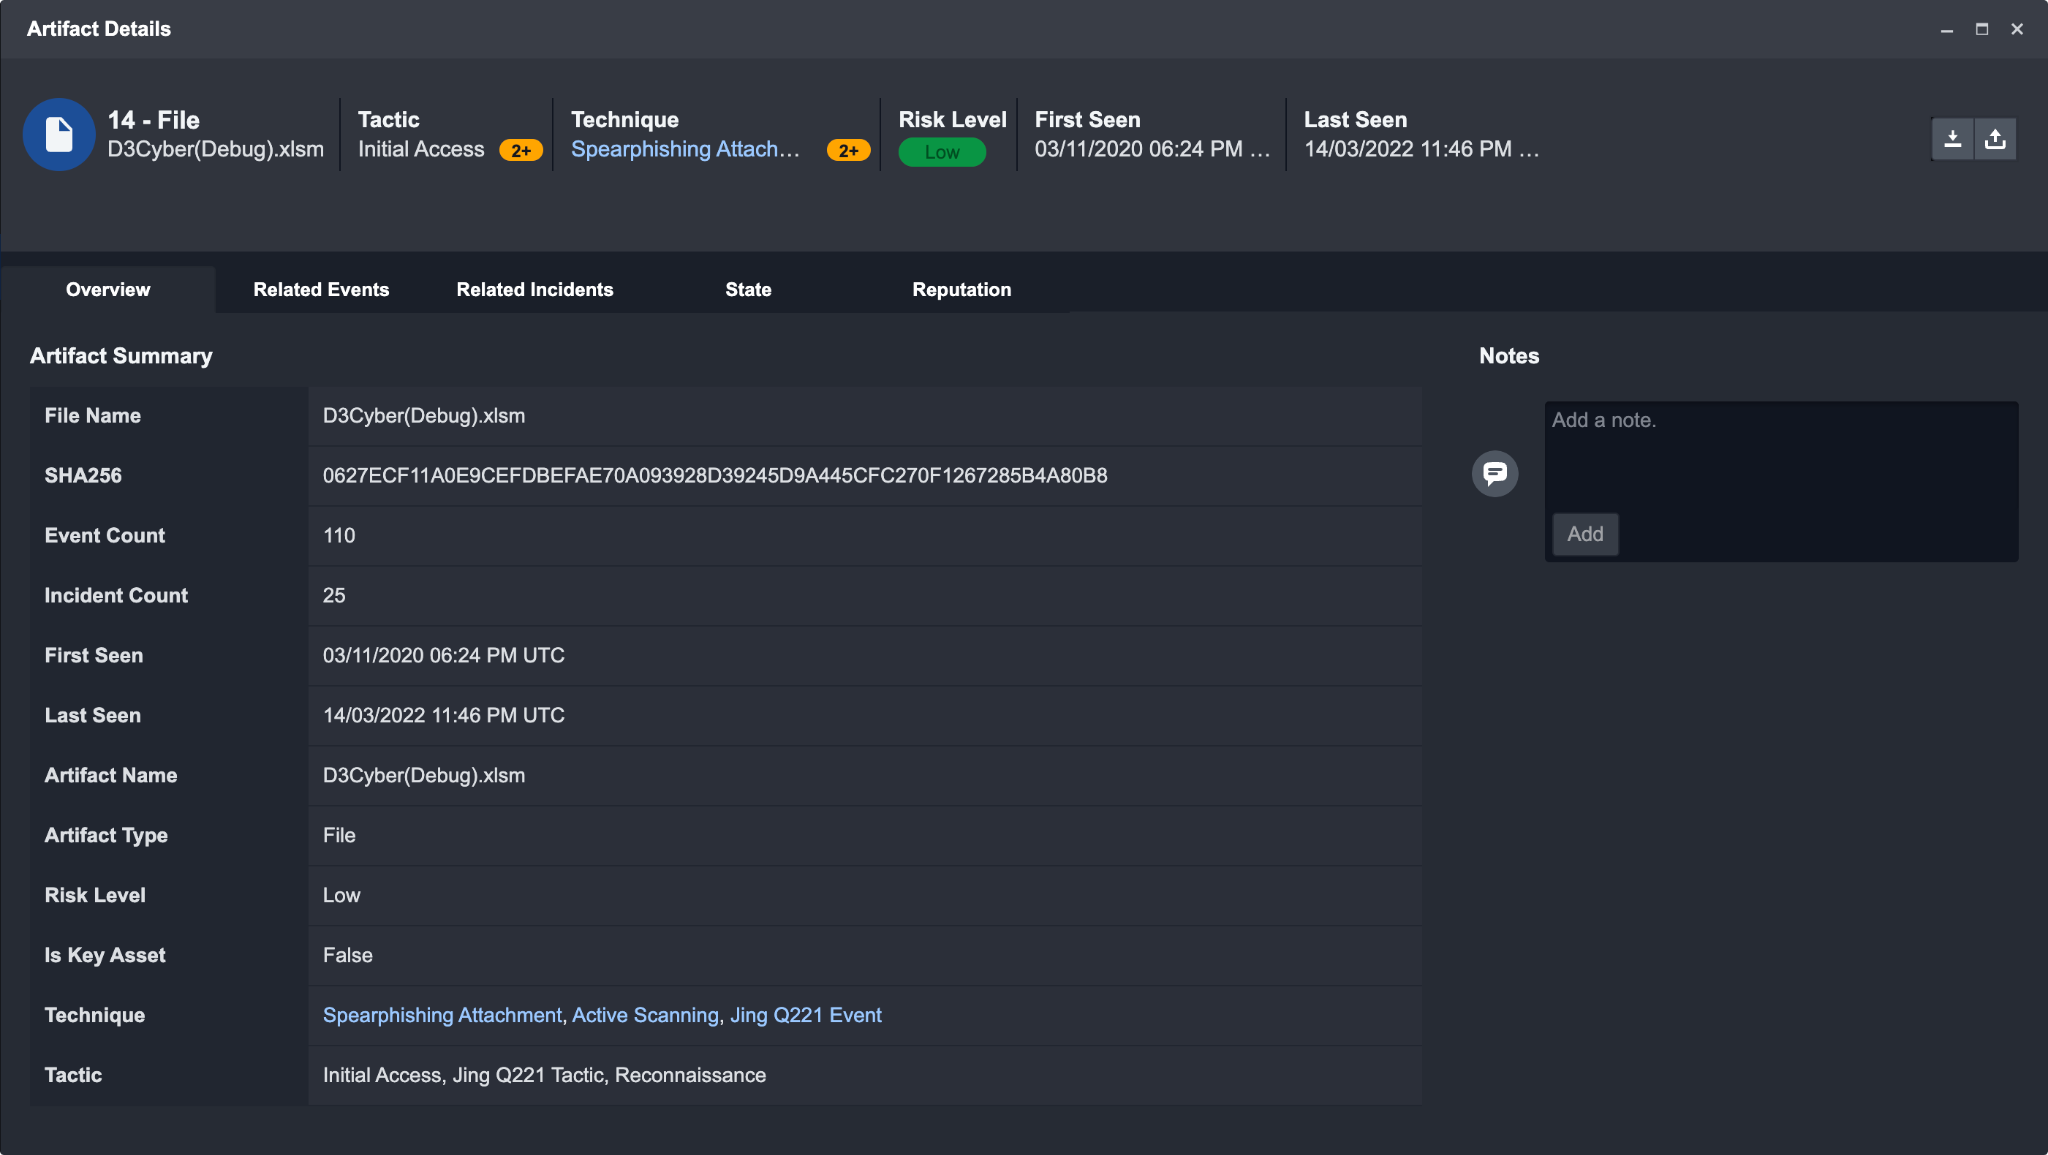
Viewing Artifact Details
Clicking on an artifact from this list will open up the Artifact Details window where you can view additional details about their selection and associated events. You have the additional option of exporting an artifact as a JSON file in STIX 2.1 format. There are five tabs within Artifact Details:
Overview: Displays all relevant information for the selected artifact.
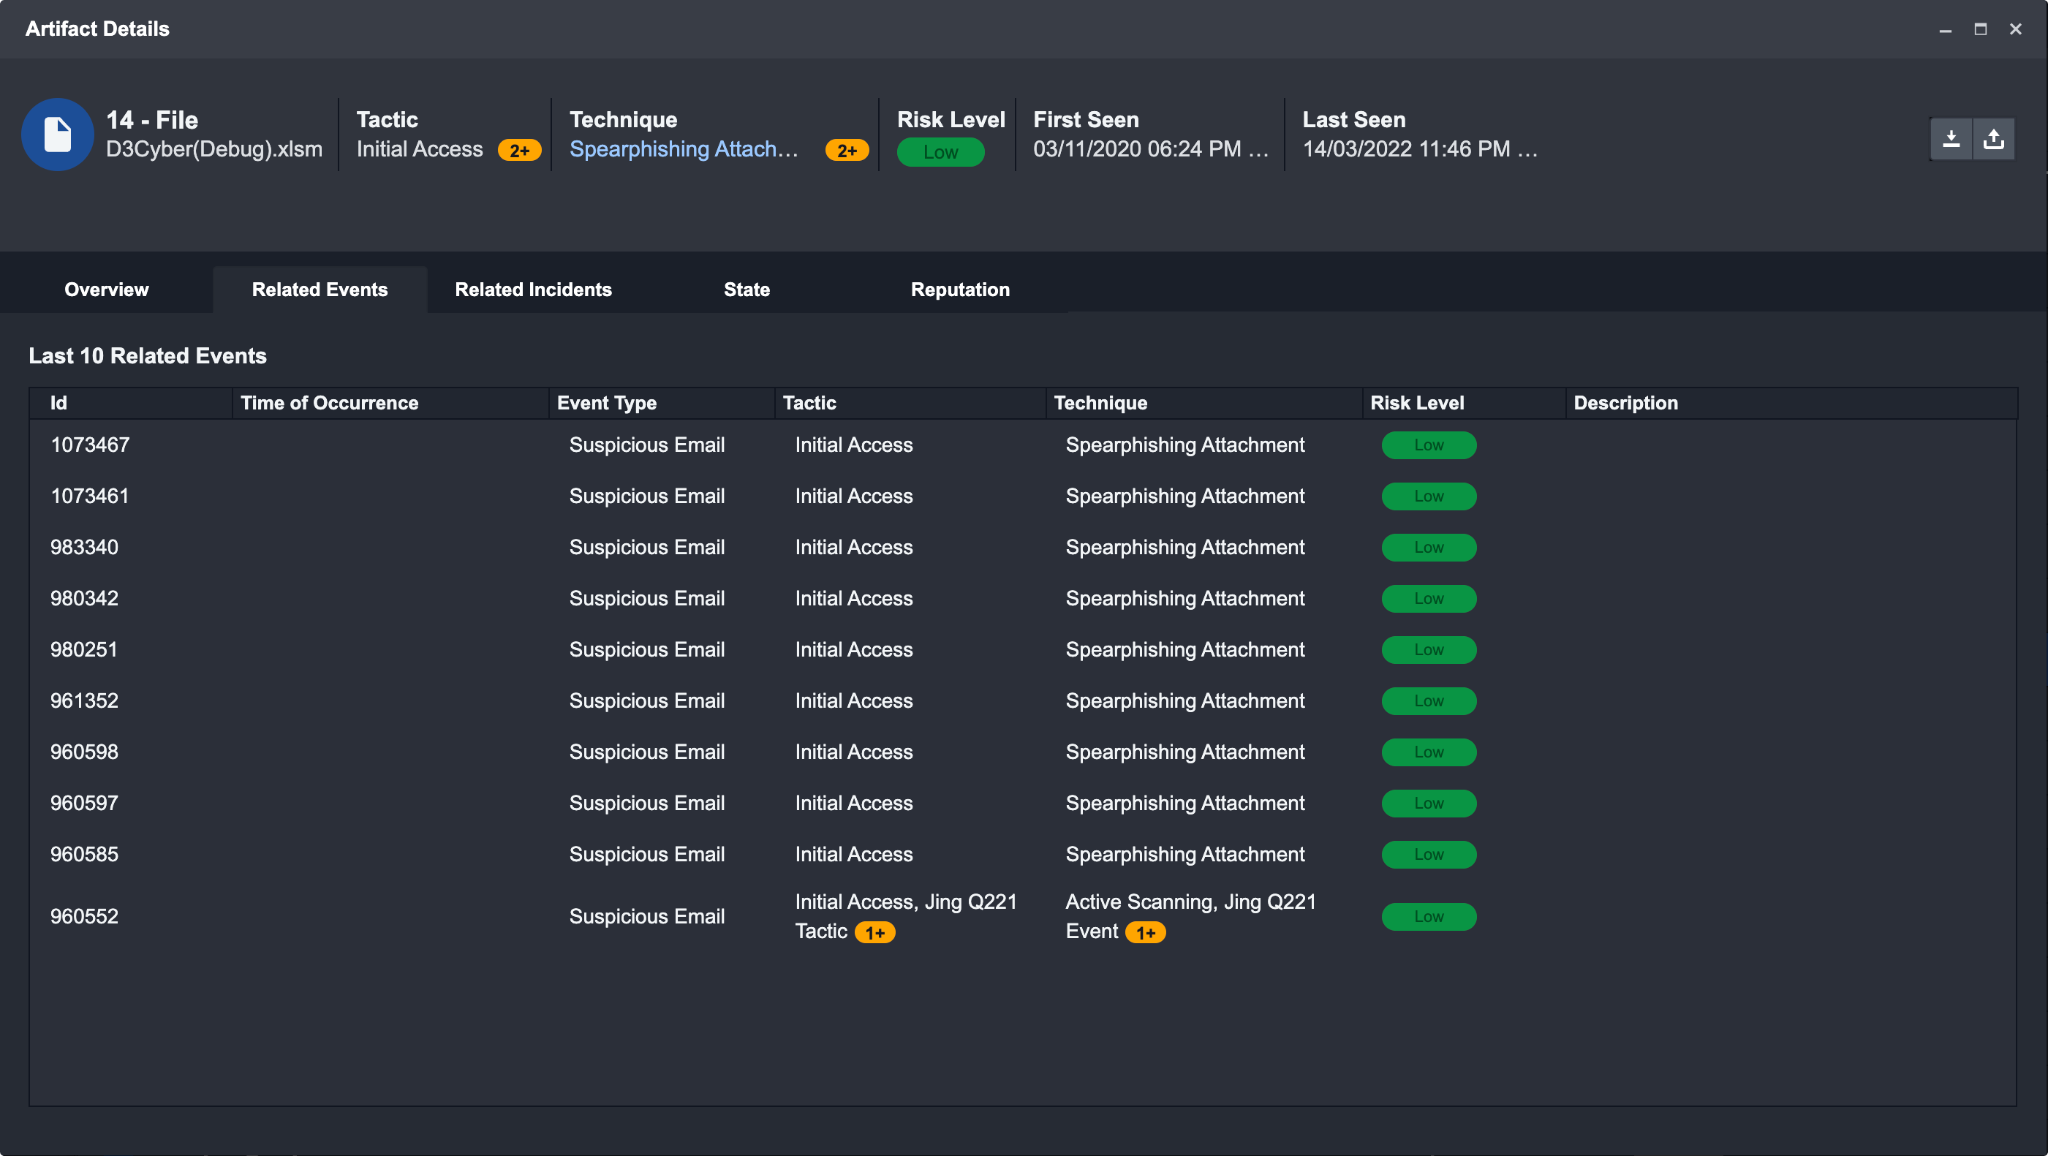
Related Events: Provides a list of all instances where the selected artifact appears in an event. Clicking on an event will open the Event Details window.
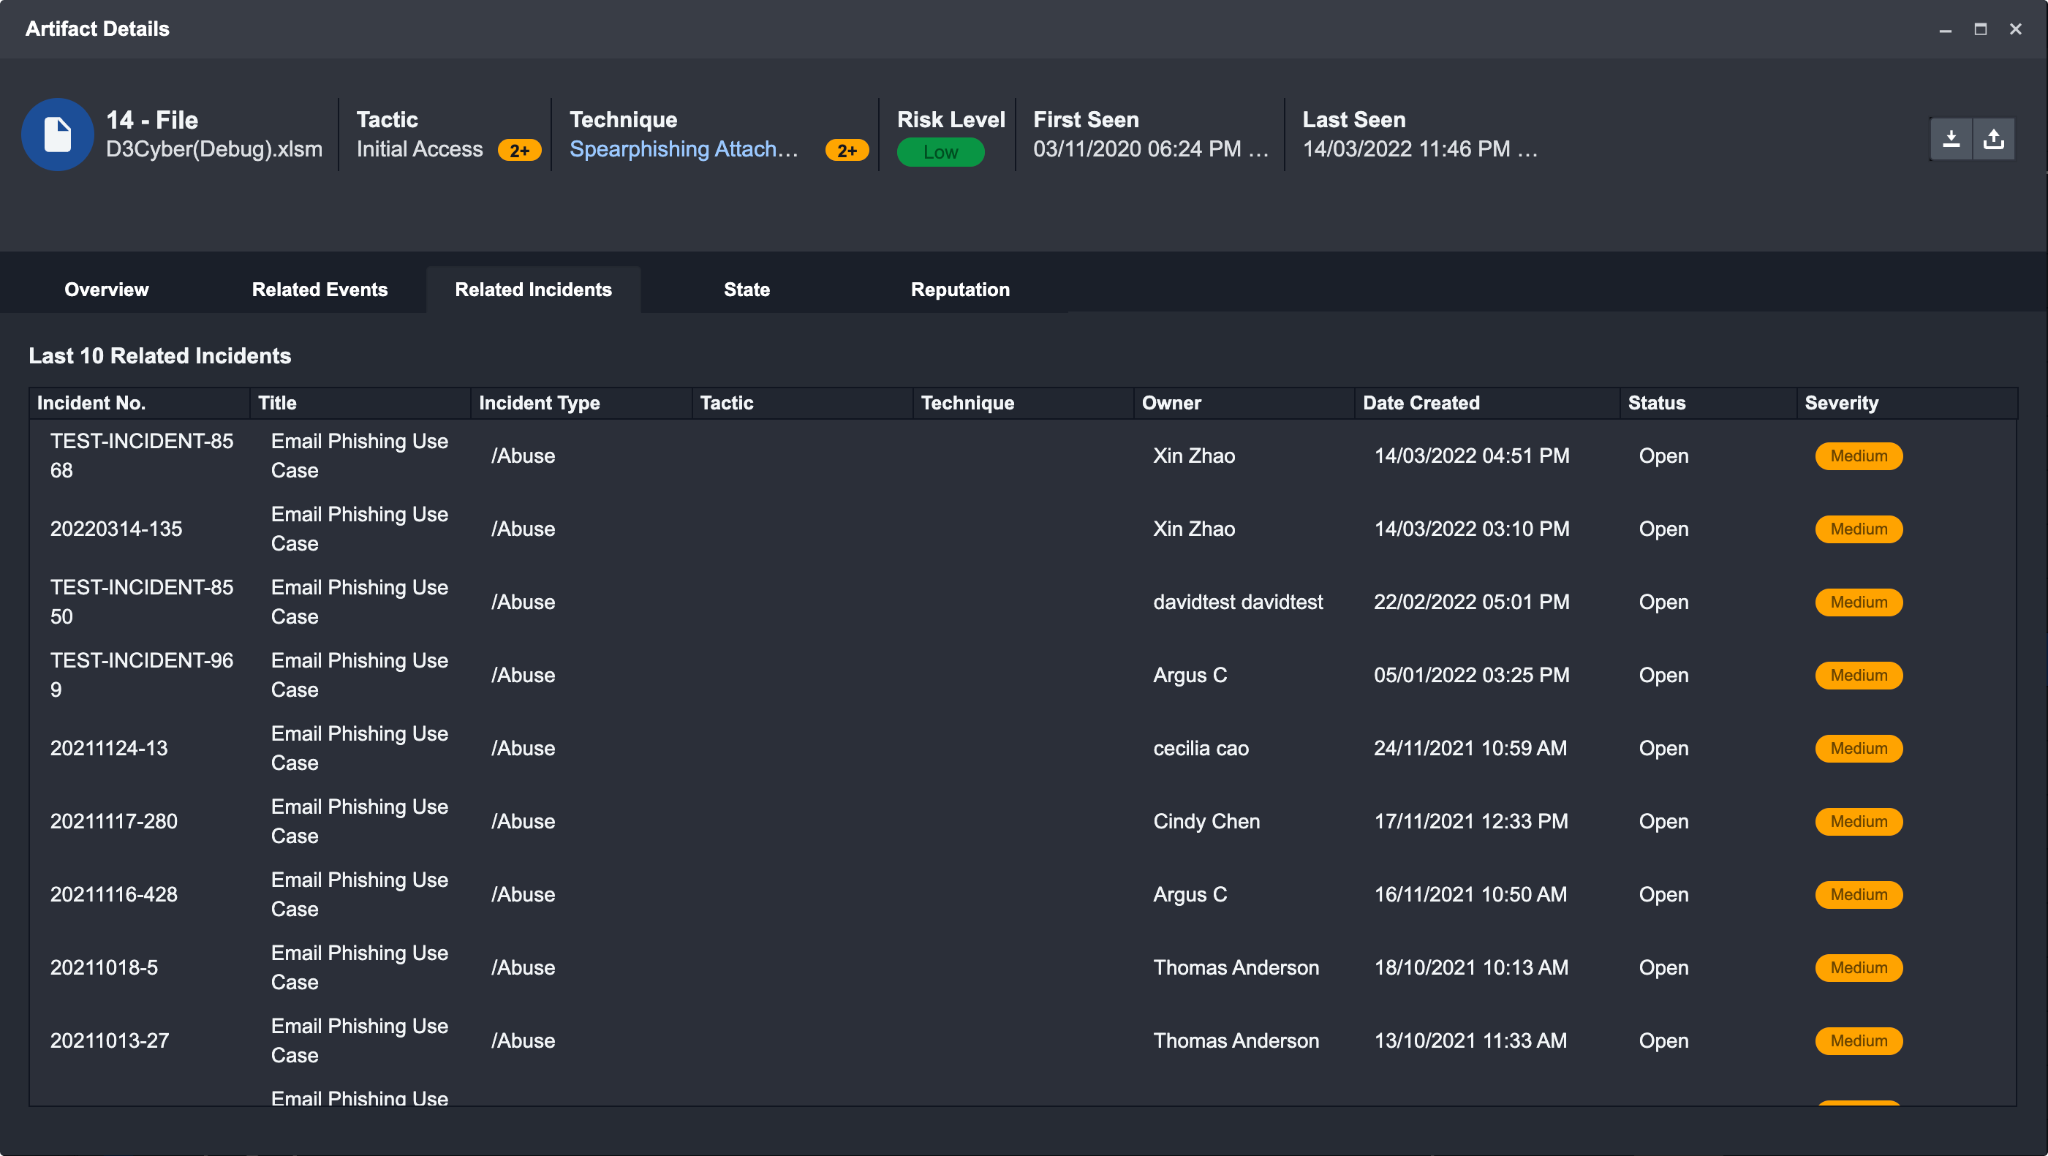
Related Incidents: Provides a list of all instances where the selected artifact appears in an incident.
State: If the artifact has been updated or changed, the State will display a history of said changes.
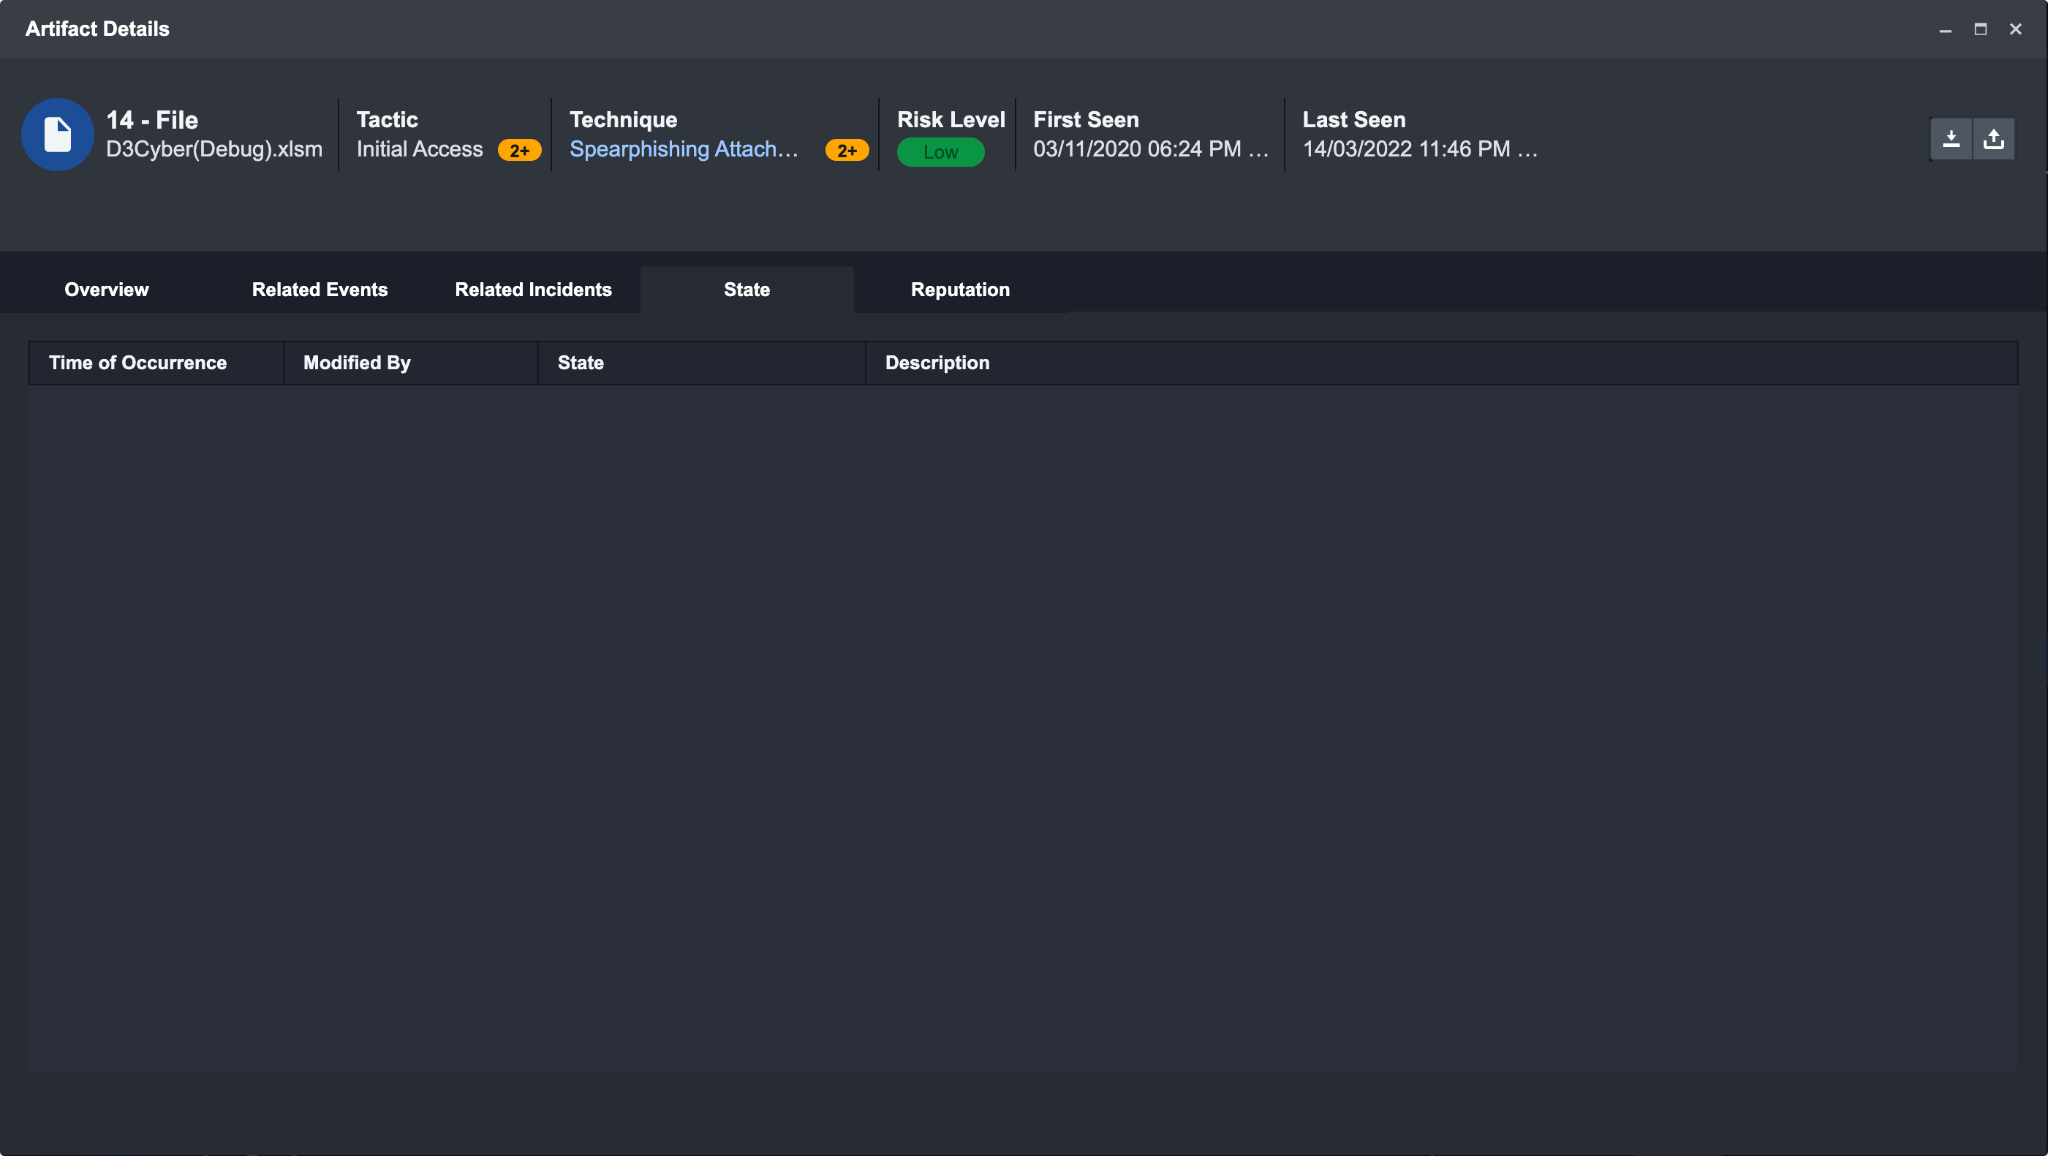
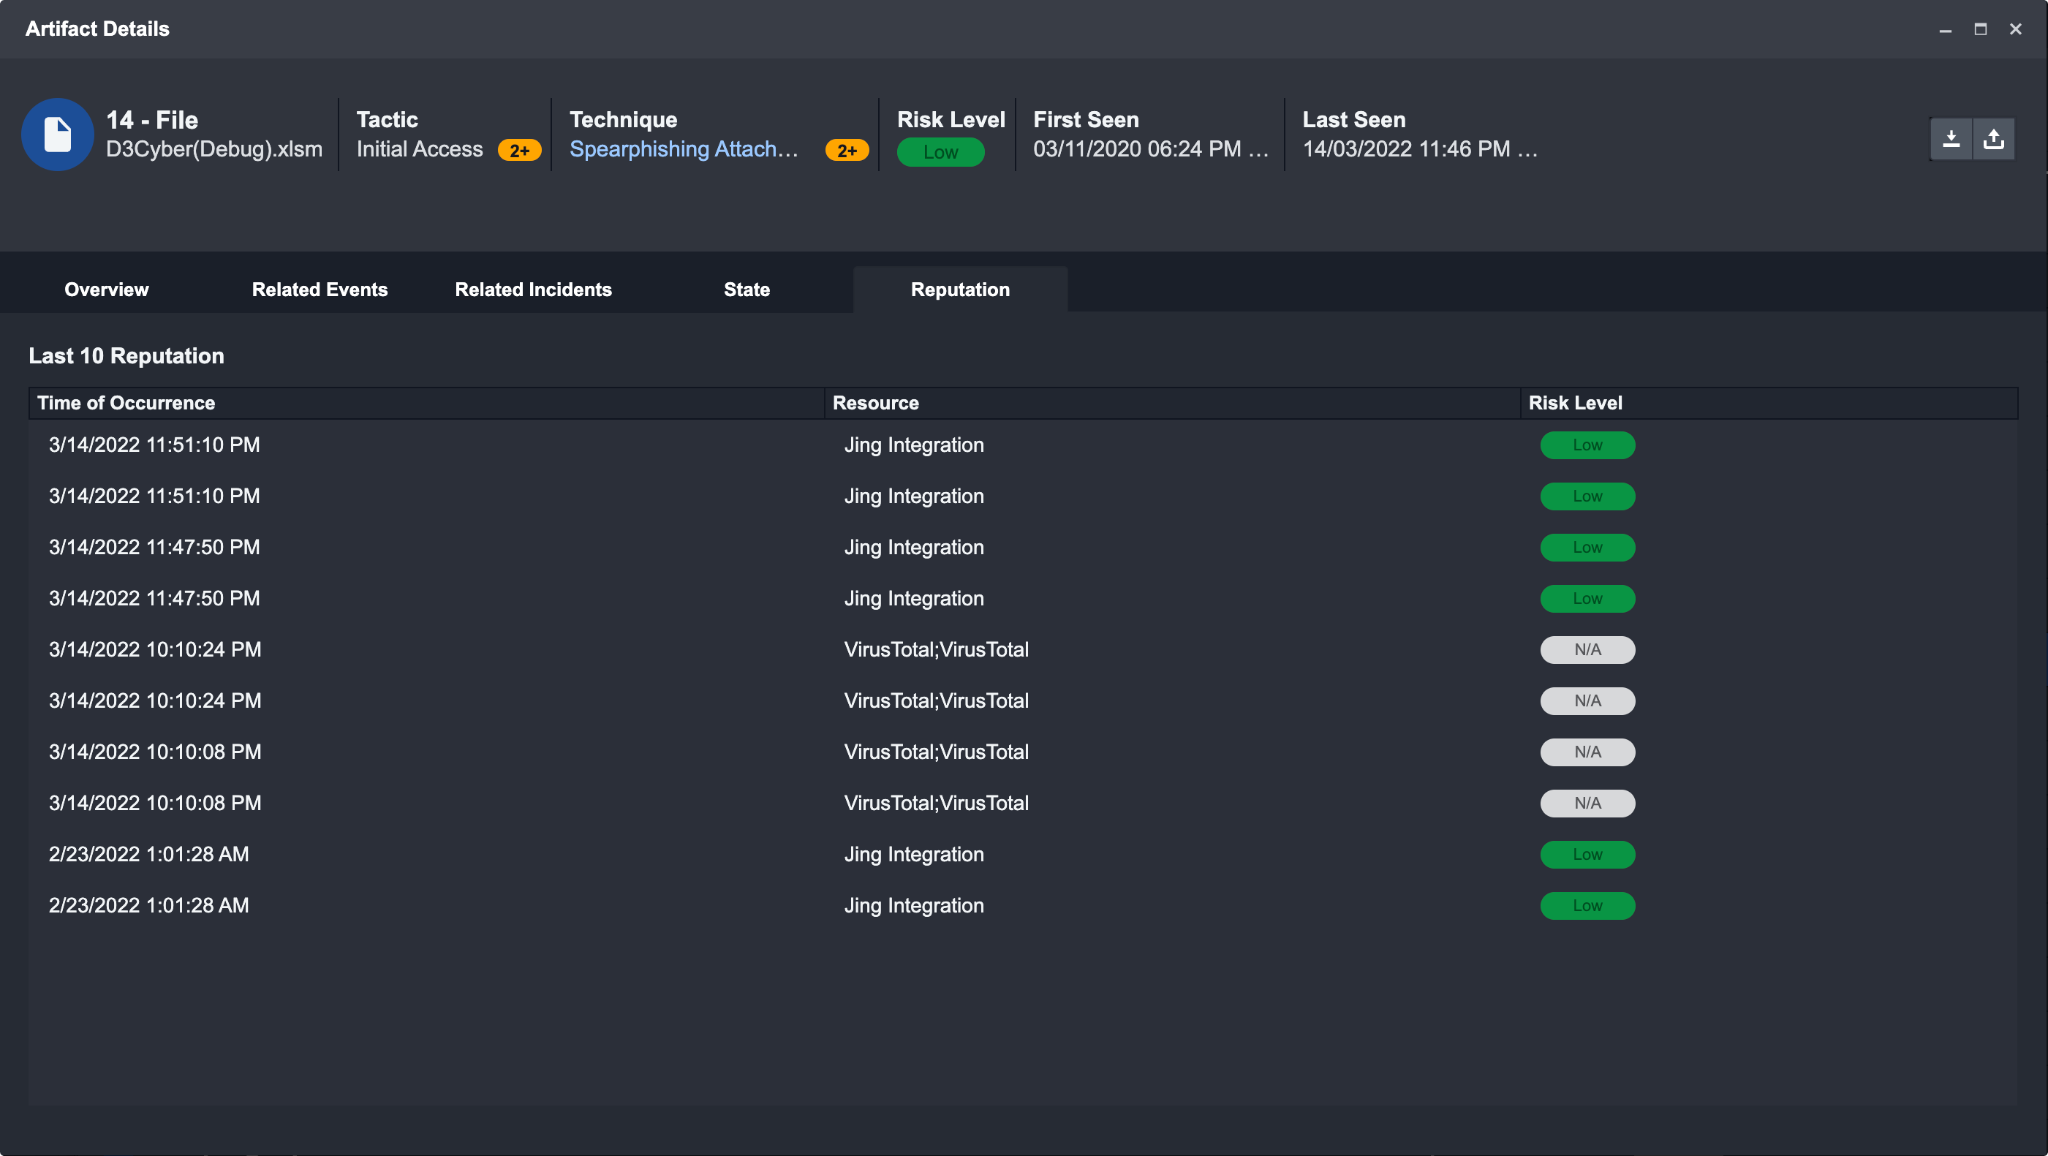
Reputation: Provides a historical record of the reputation for the selected artifact. This is useful to keep track of reputation changes to an artifact.
Playbook Errors List
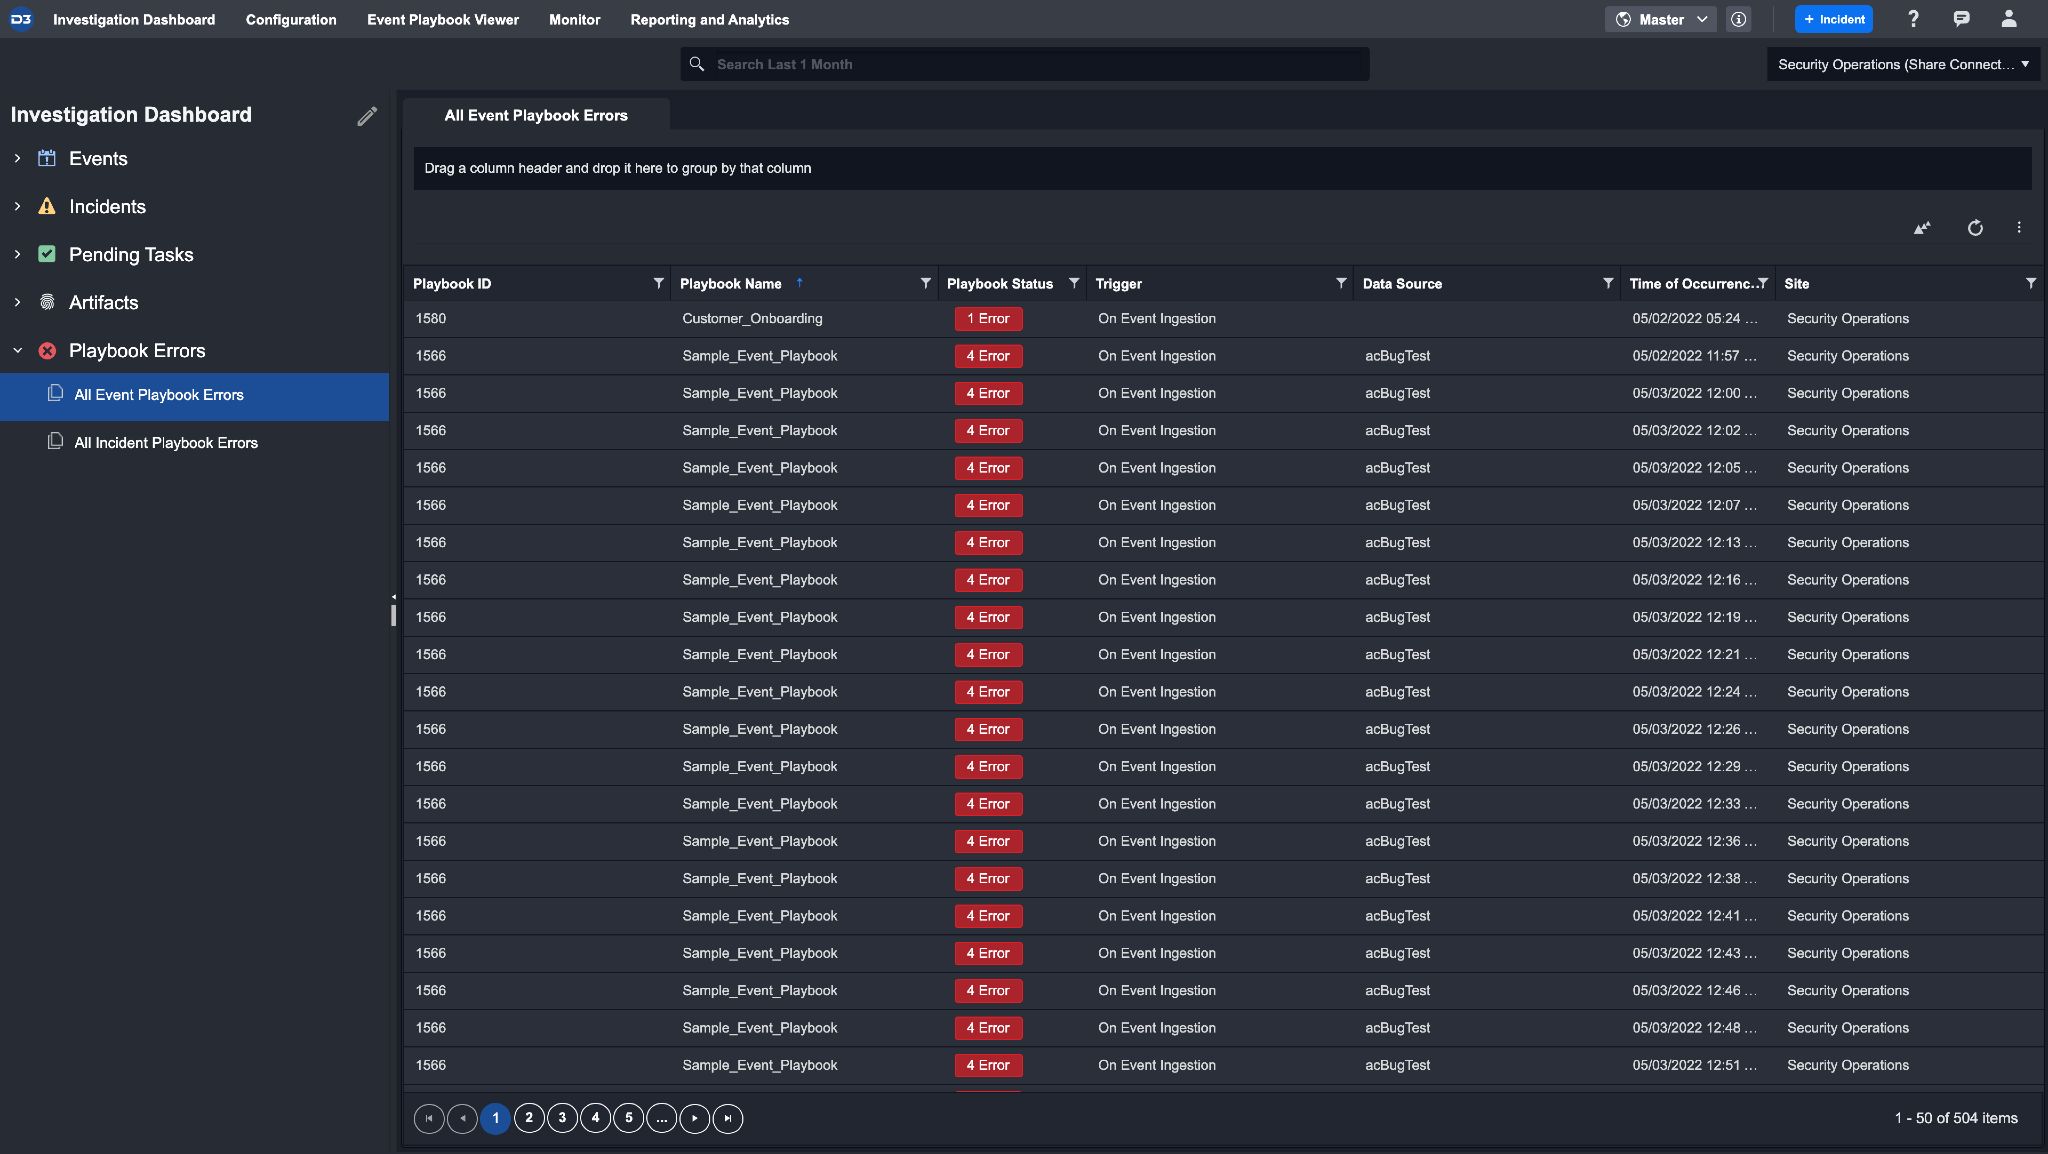
The Playbook Errors list contains all errors that occurred during a run of either an event or incident playbook. The error list consists of two sub lists. You can sort and apply filters on specific columns to create your preferred view in each list.
All Event Playbook Errors
All Incident Playbook Errors
Event Playbook Errors
When you click on an item in the event playbook errors, you will be redirected to the triggered flow of that specific Playbook to examine where and why the error occurred. The erroneous tasks can then be viewed in-depth by clicking on the Tasks tab in the triggered flow viewer.
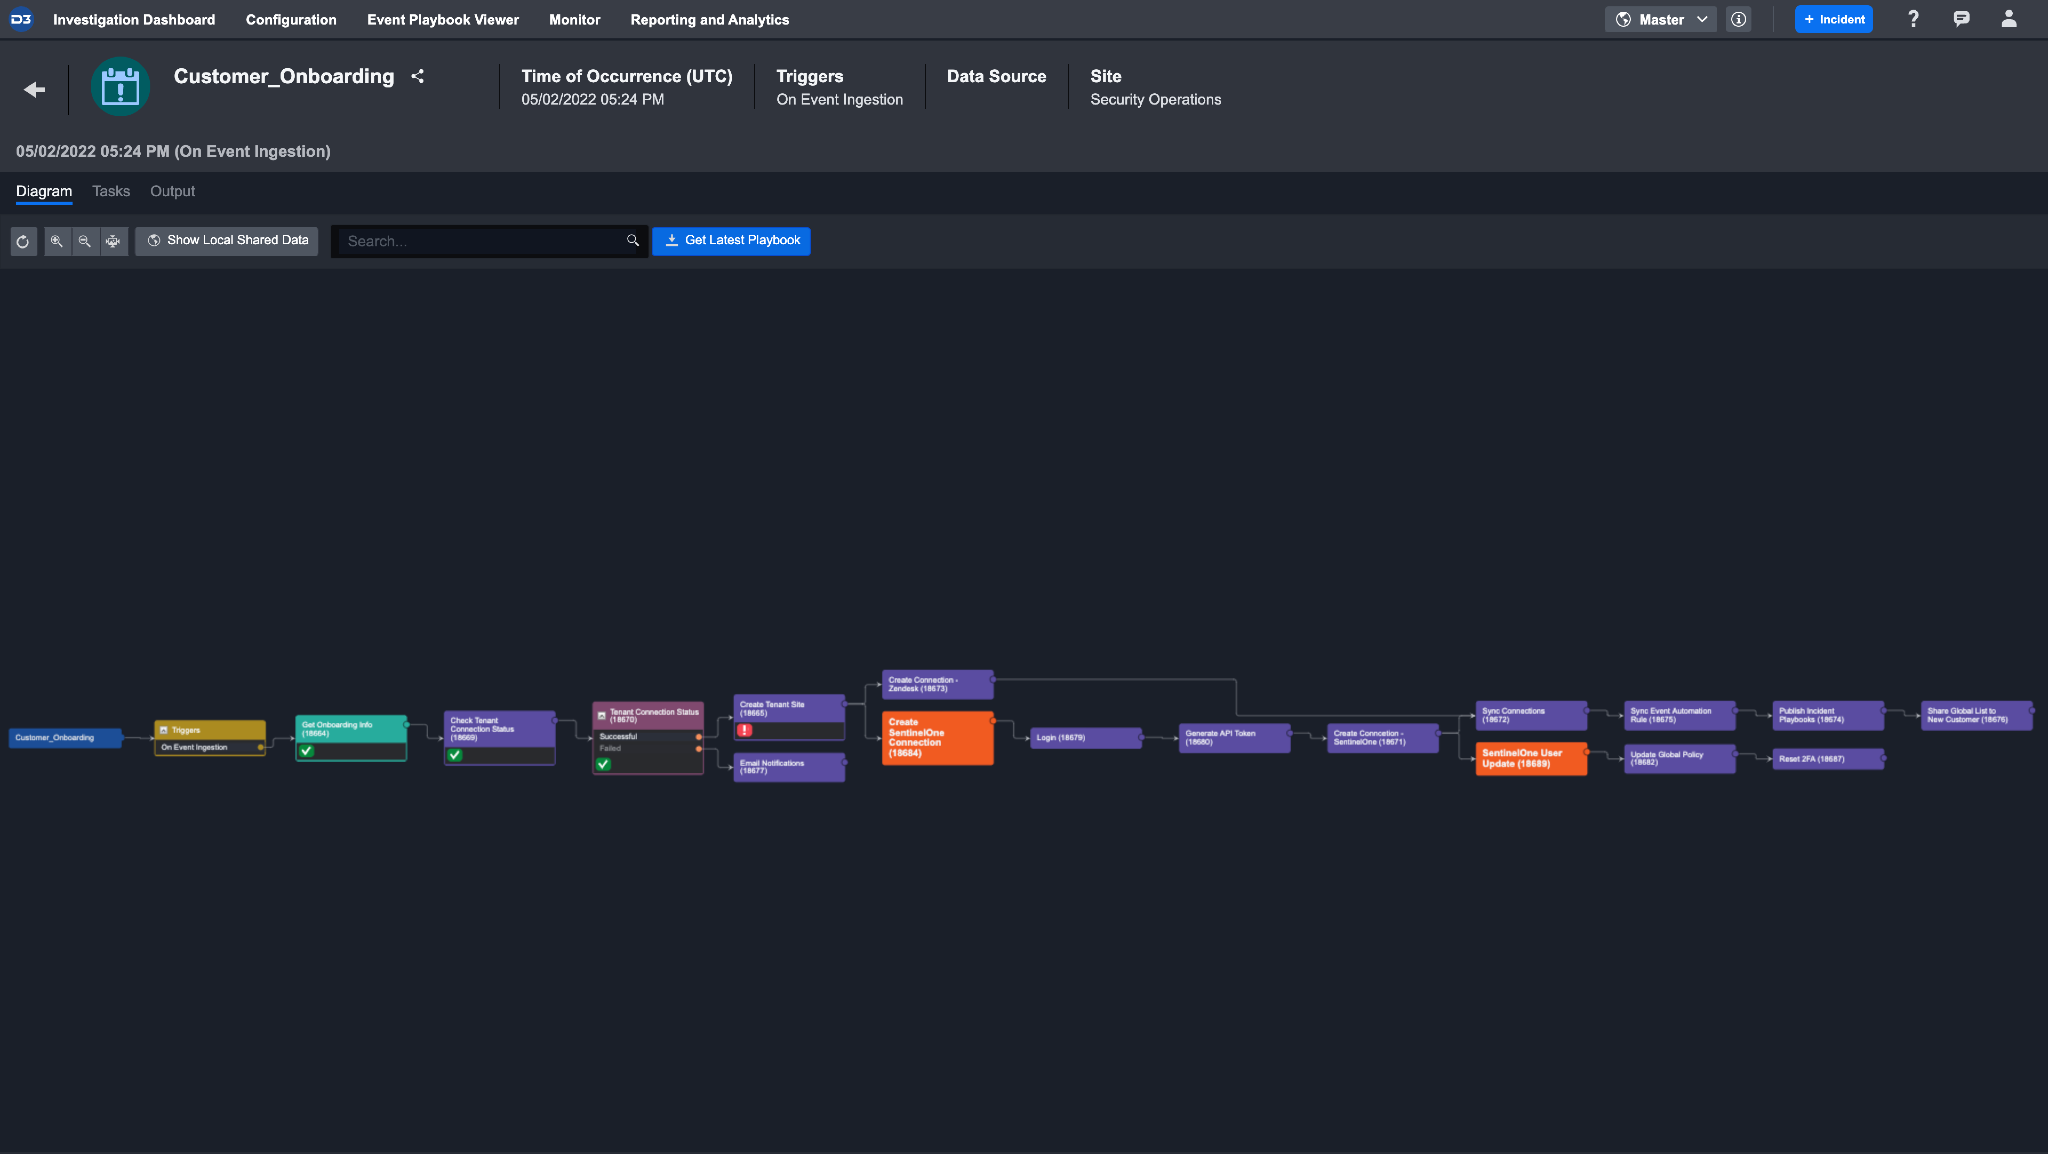
Reader Note
It is important to note that when you click into an event playbook error, you will only see the triggered flow that contains the error instead of the entire Playbook to reduce unnecessary information clutter.
Incident Playbook Errors
When you click on an incident Playbook error, it redirects you to the Playbook tab under Incident Workspace. The system auto-selects the specific run of the Playbook to help you quickly identify where the error took place. When you click on an erroneous task, it will open the task detail window so that you can further investigate the error.
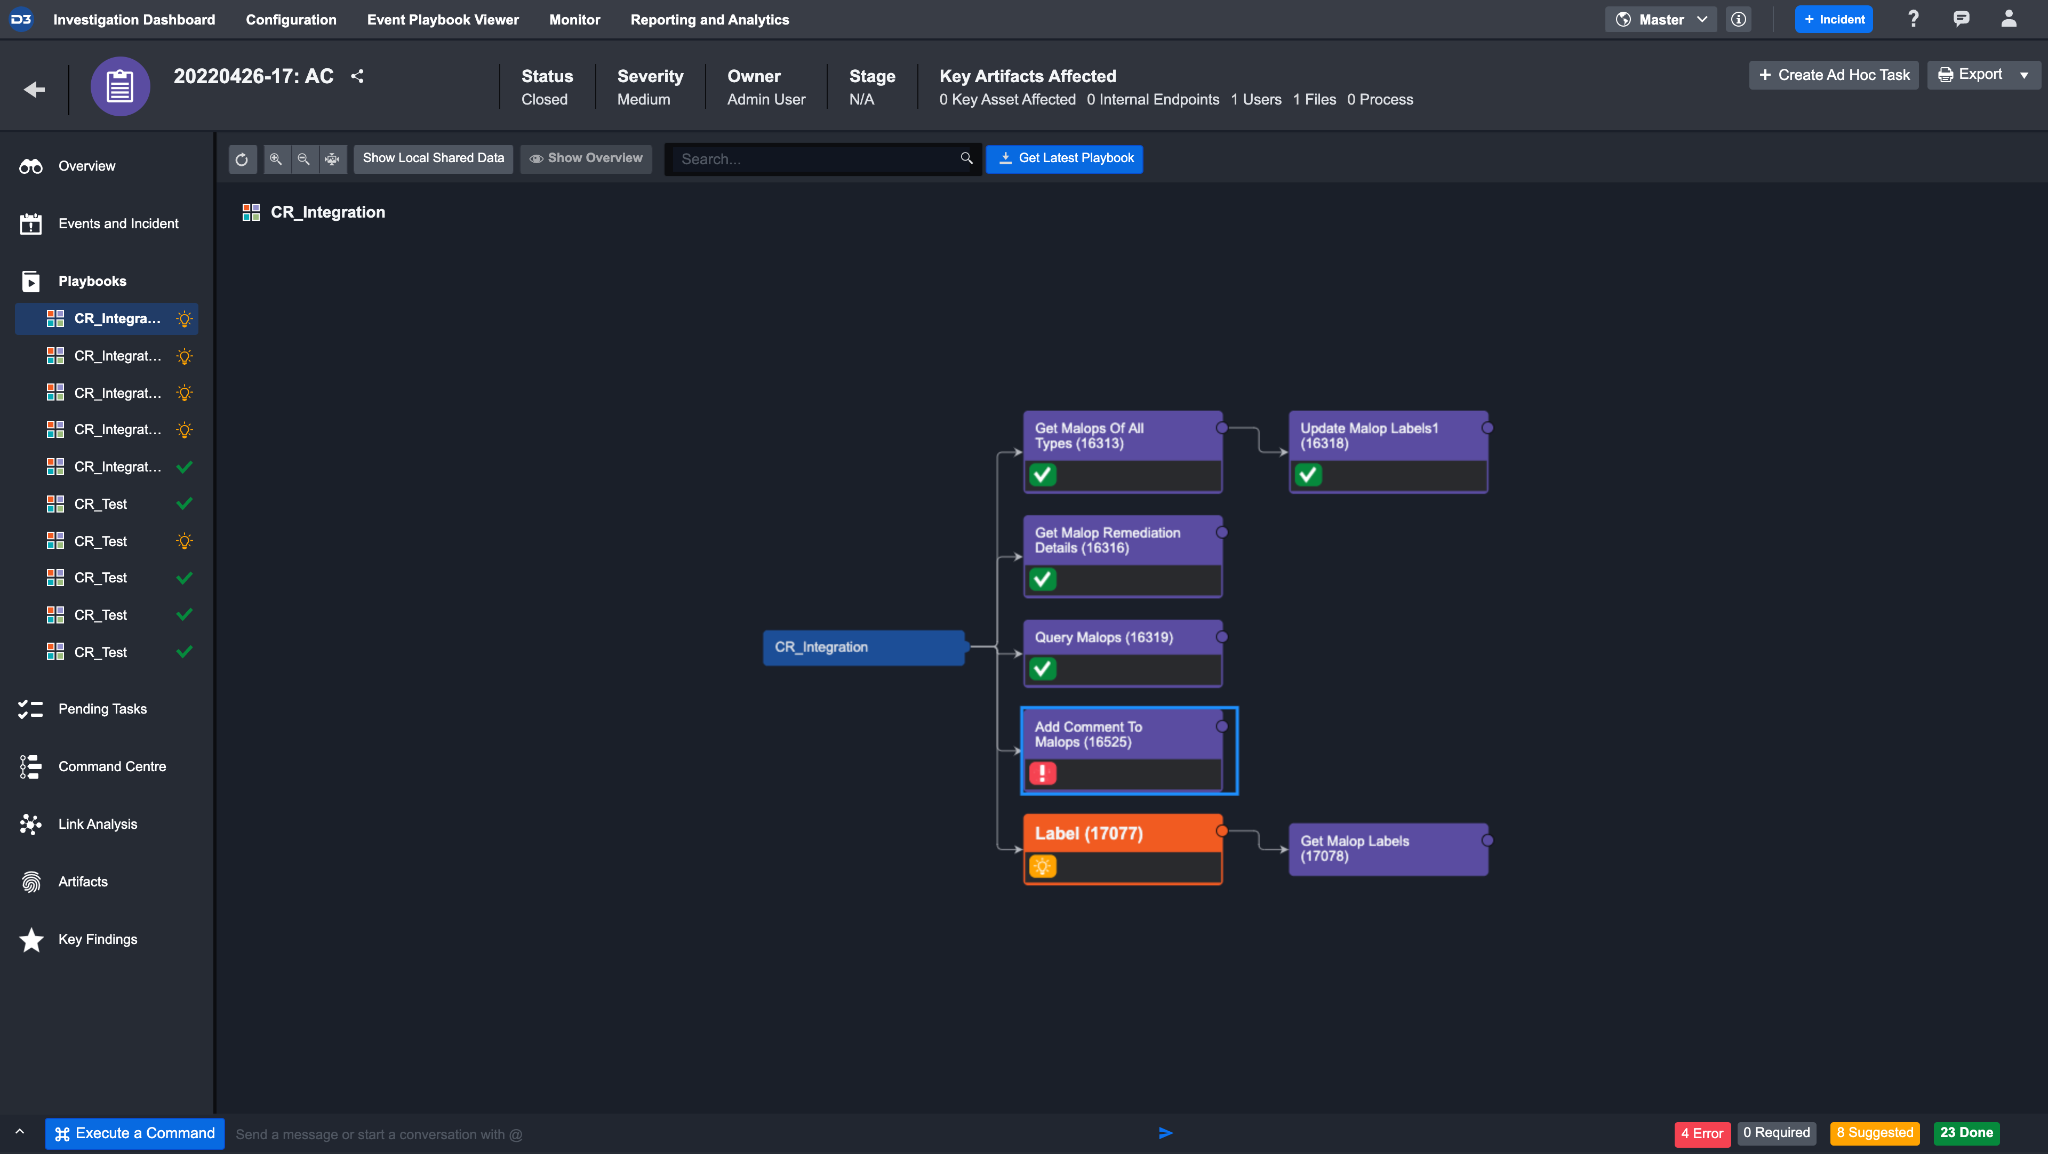
Reader Note
The playbook tab accessed from incident playbook errors is slightly different from the playbook tab accessed from Incident Workspace. The former shows all the runs of the Playbook, and the latter only shows the Playbooks attached to the incident.