.png)
Incident Workspace
Overview
The Incident Workspace view provides a centralized space to respond to an incident, with tools to view and edit details that are integral to an investigation.
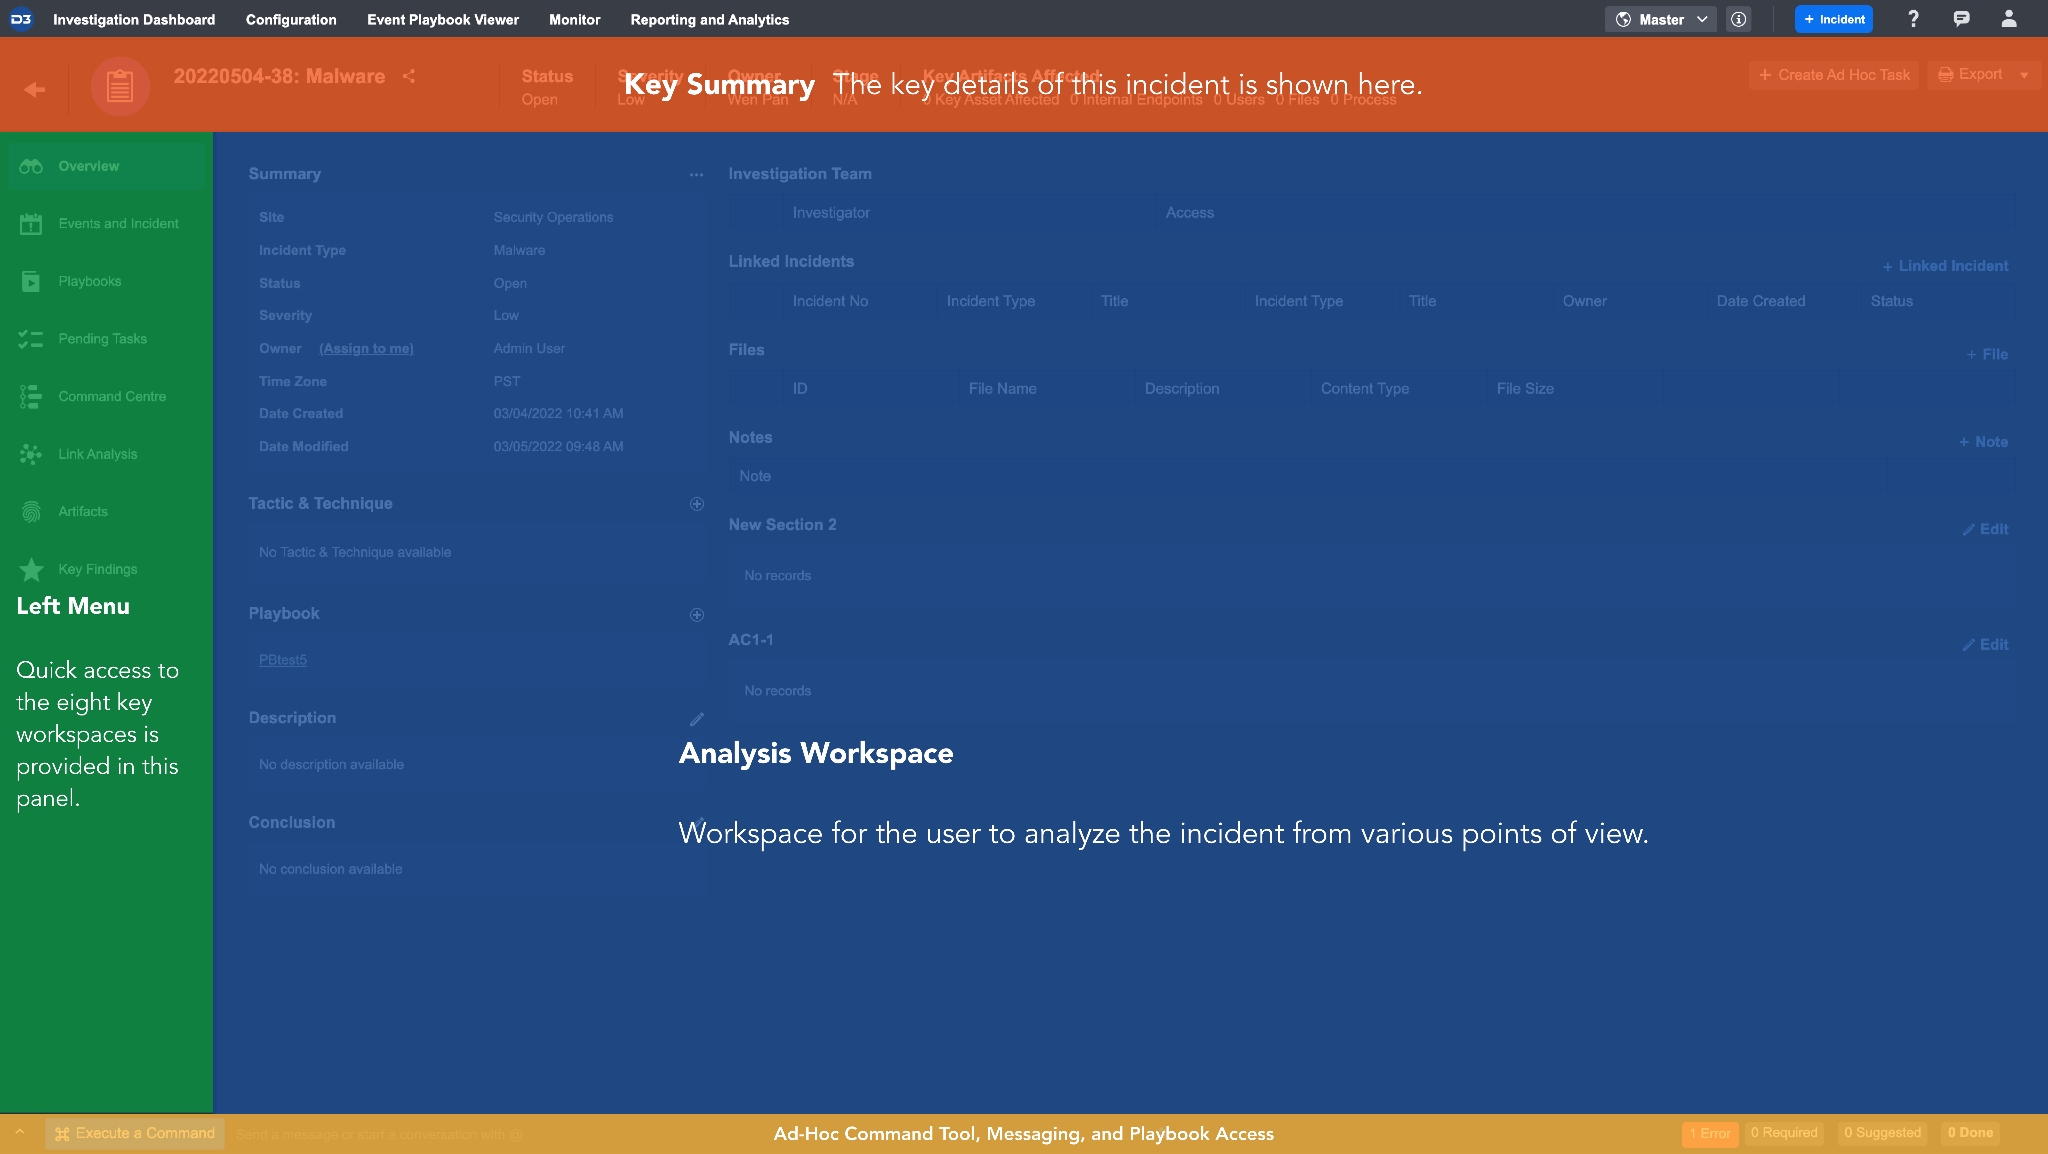
Key Summary
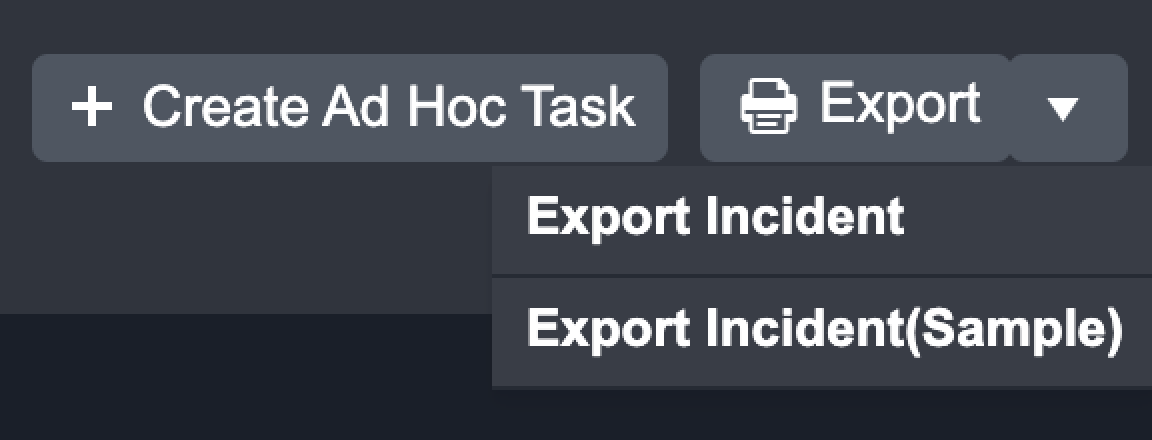
The Key Summary bar provides a high-level view of the incident. Within this bar, you can conduct the following actions:
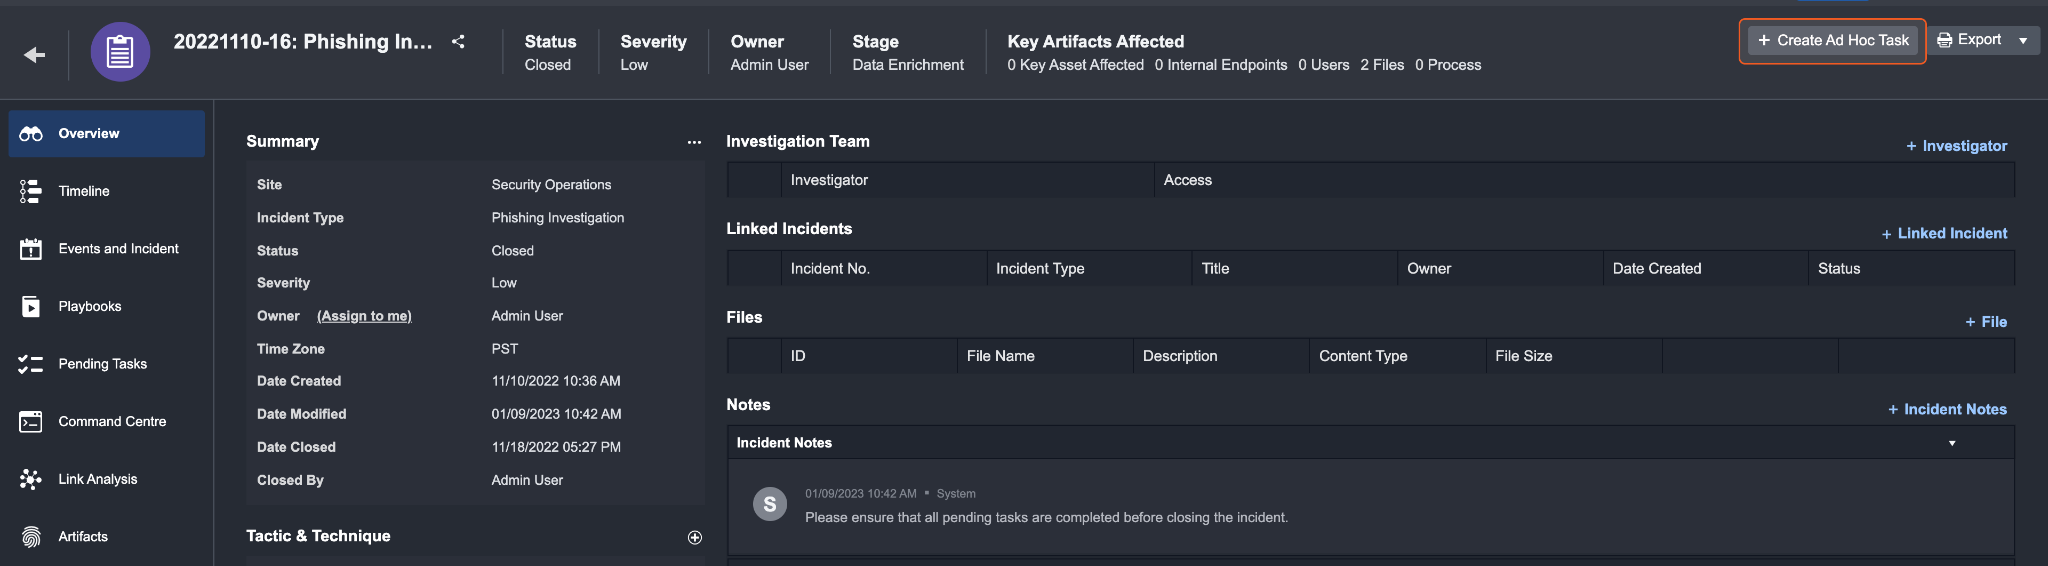
Export a copy of the Incident Summary Report for post-incident review.
Create Ad hoc Task to assign it to a user.
Left Menu
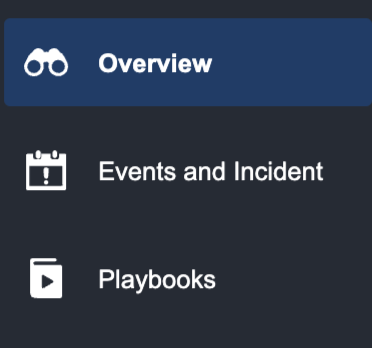
The Left Menu provides quick access to 8 workspaces for the investigation. A detailed walkthrough of each workspace will be provided below.
Ad-Hoc Commands
The Ad-Hoc commands allows you to execute ad-hoc actions and run integration commands and utility commands.
Features
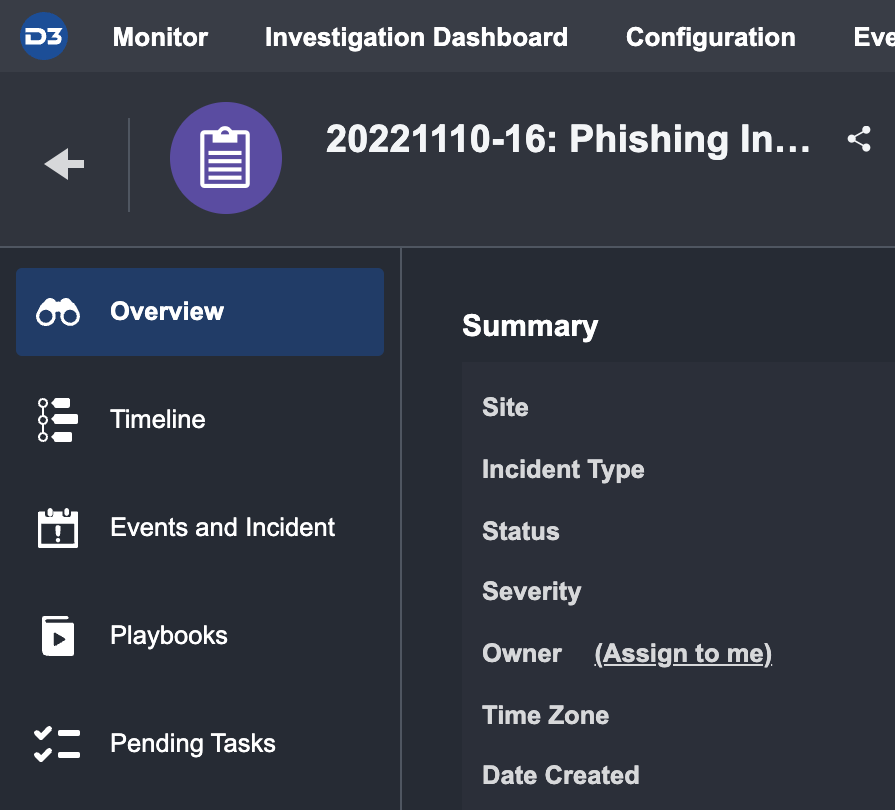
Overview Tab
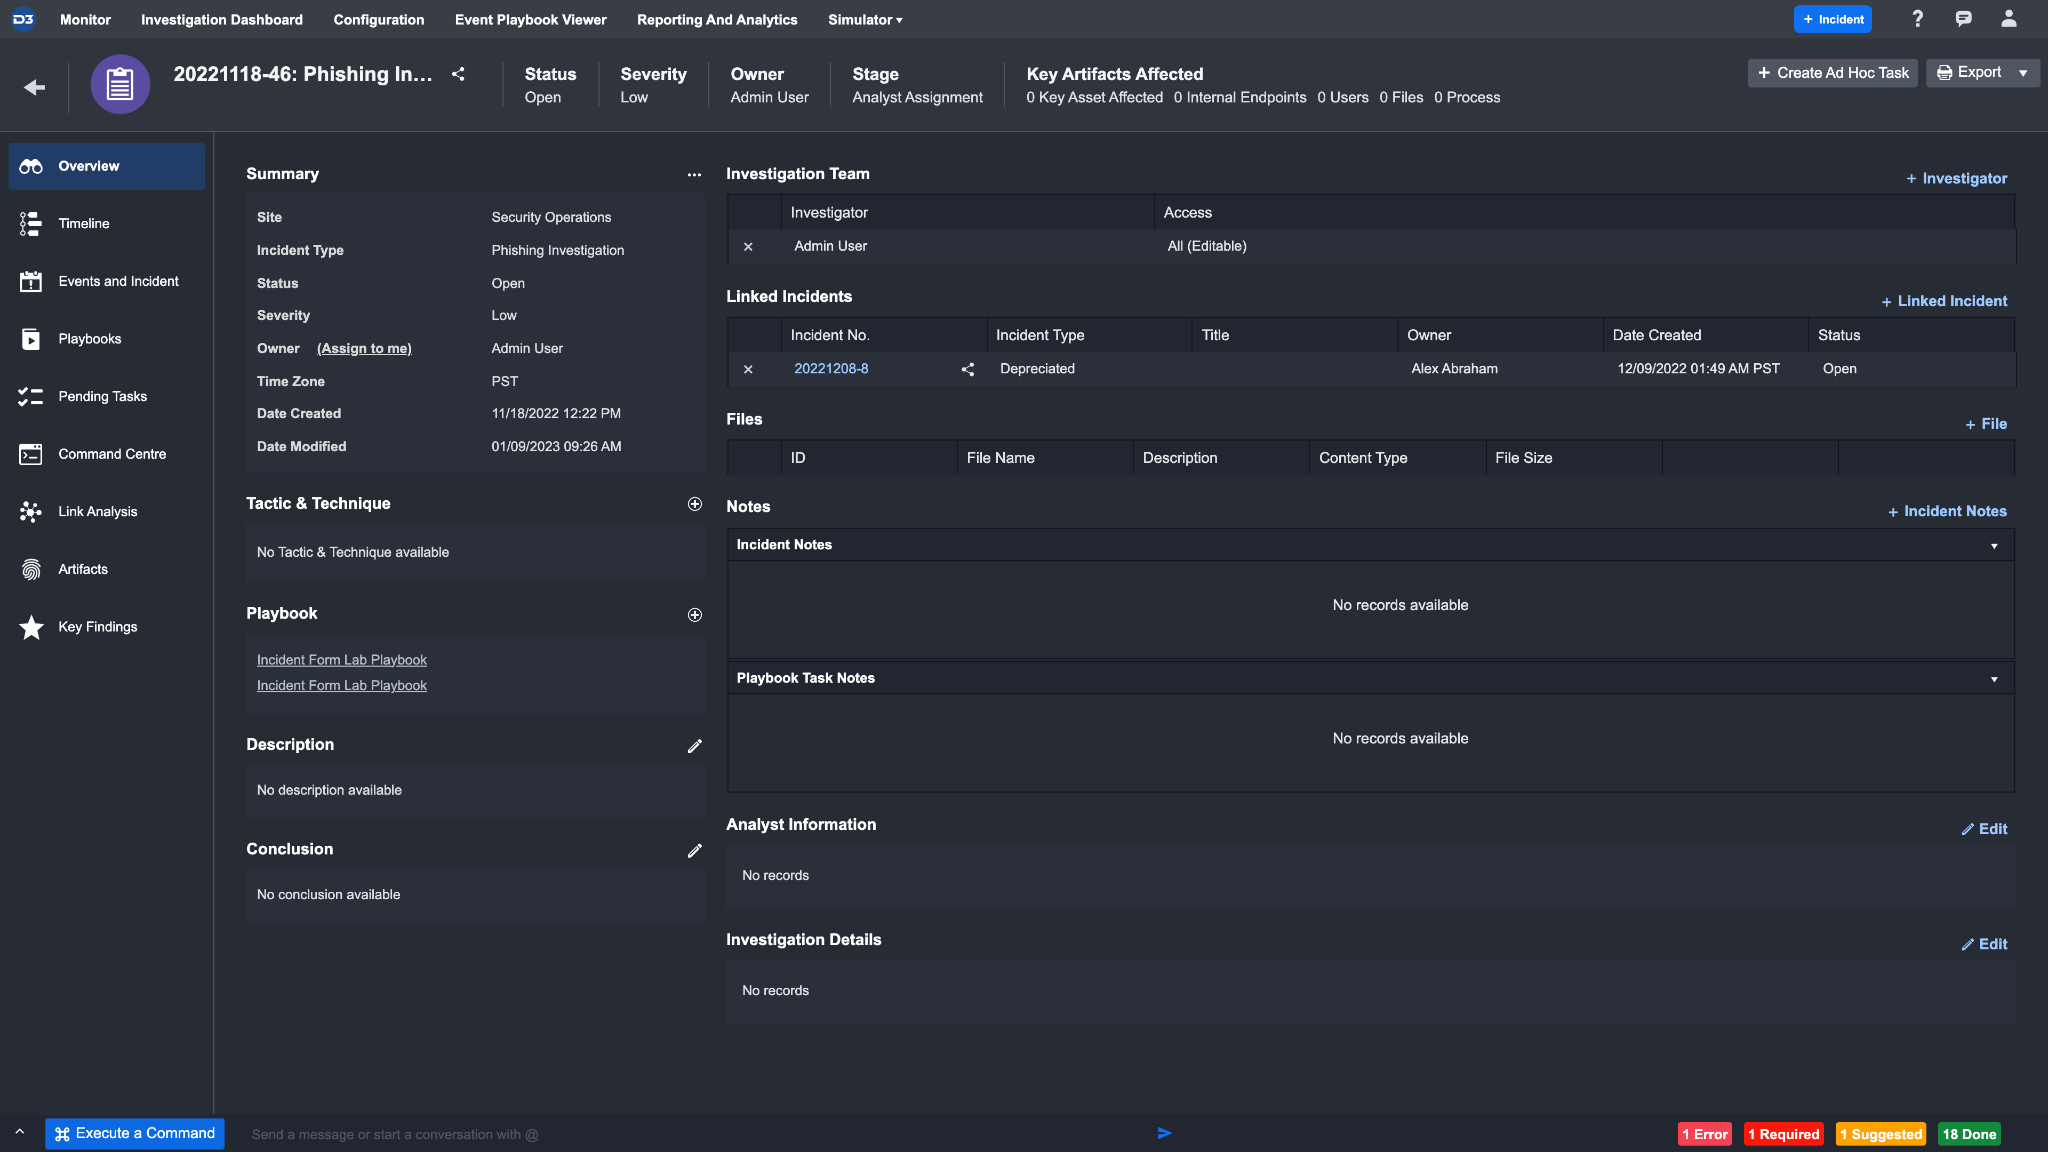
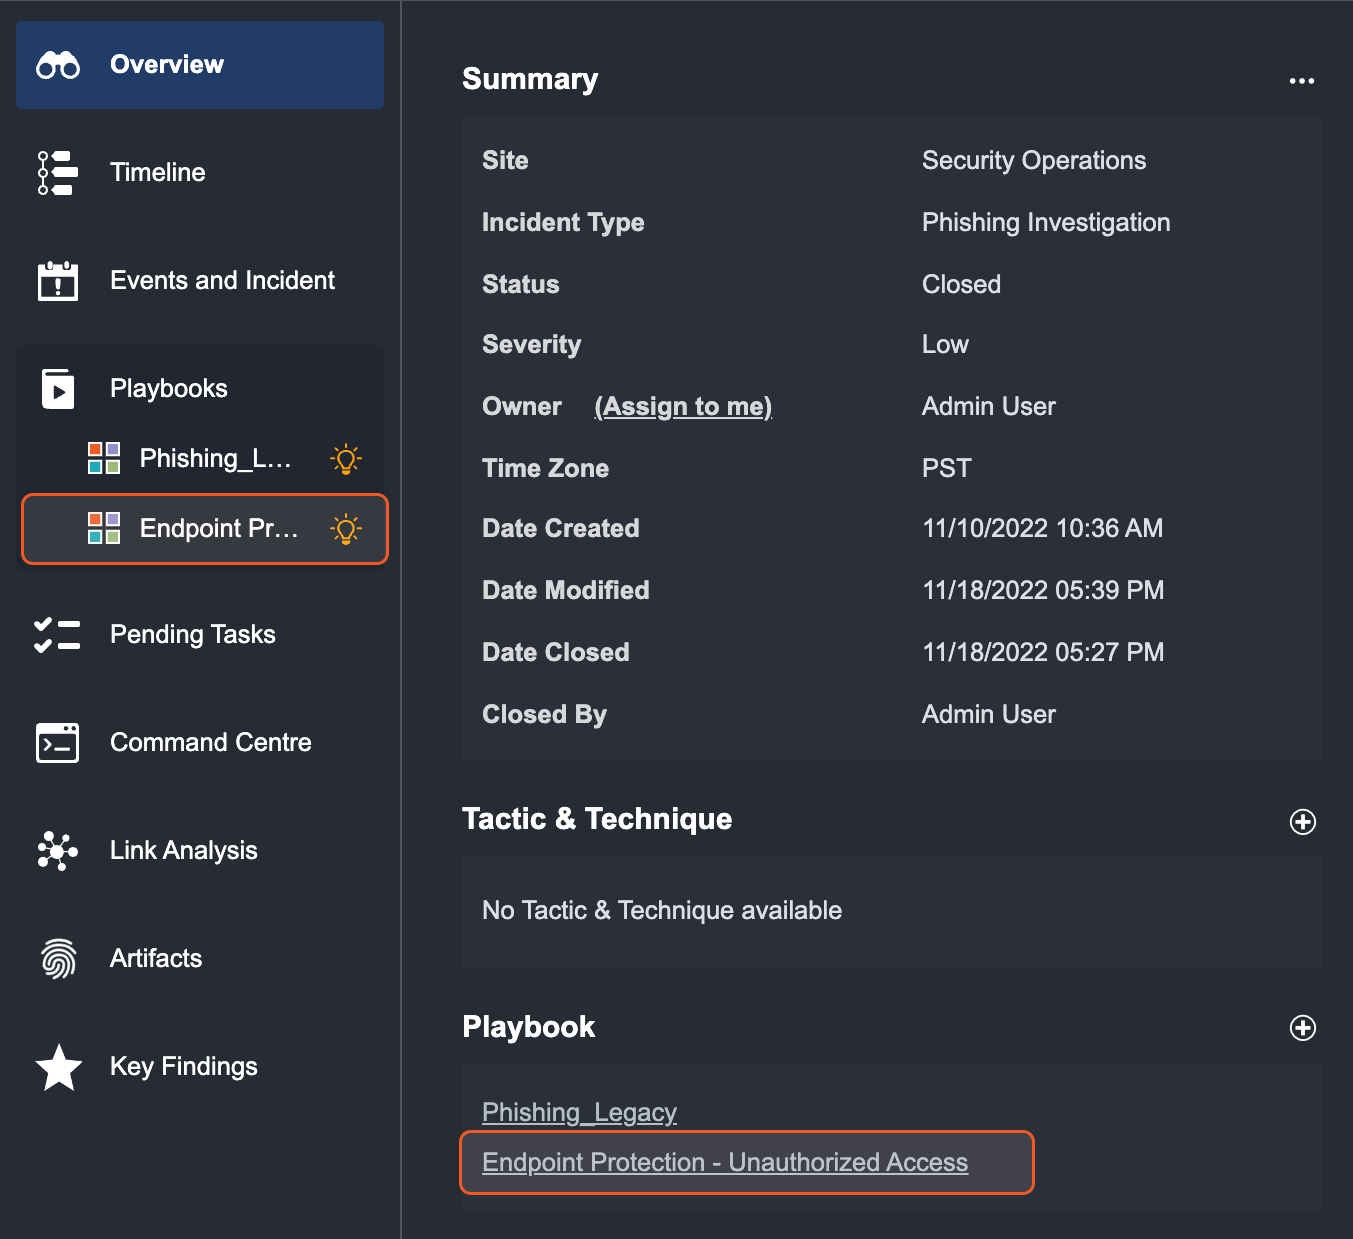
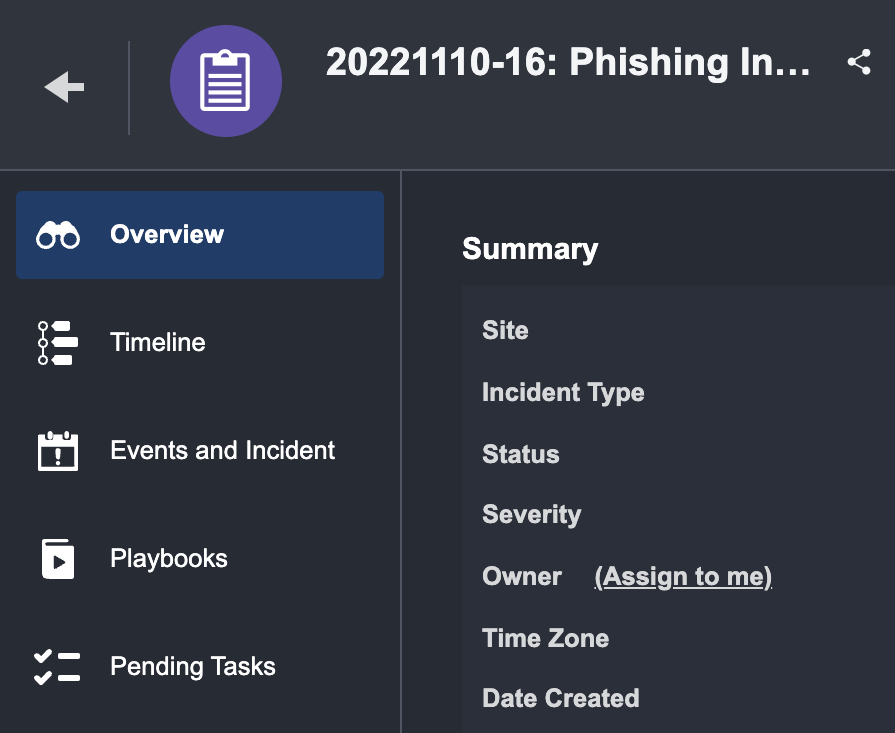
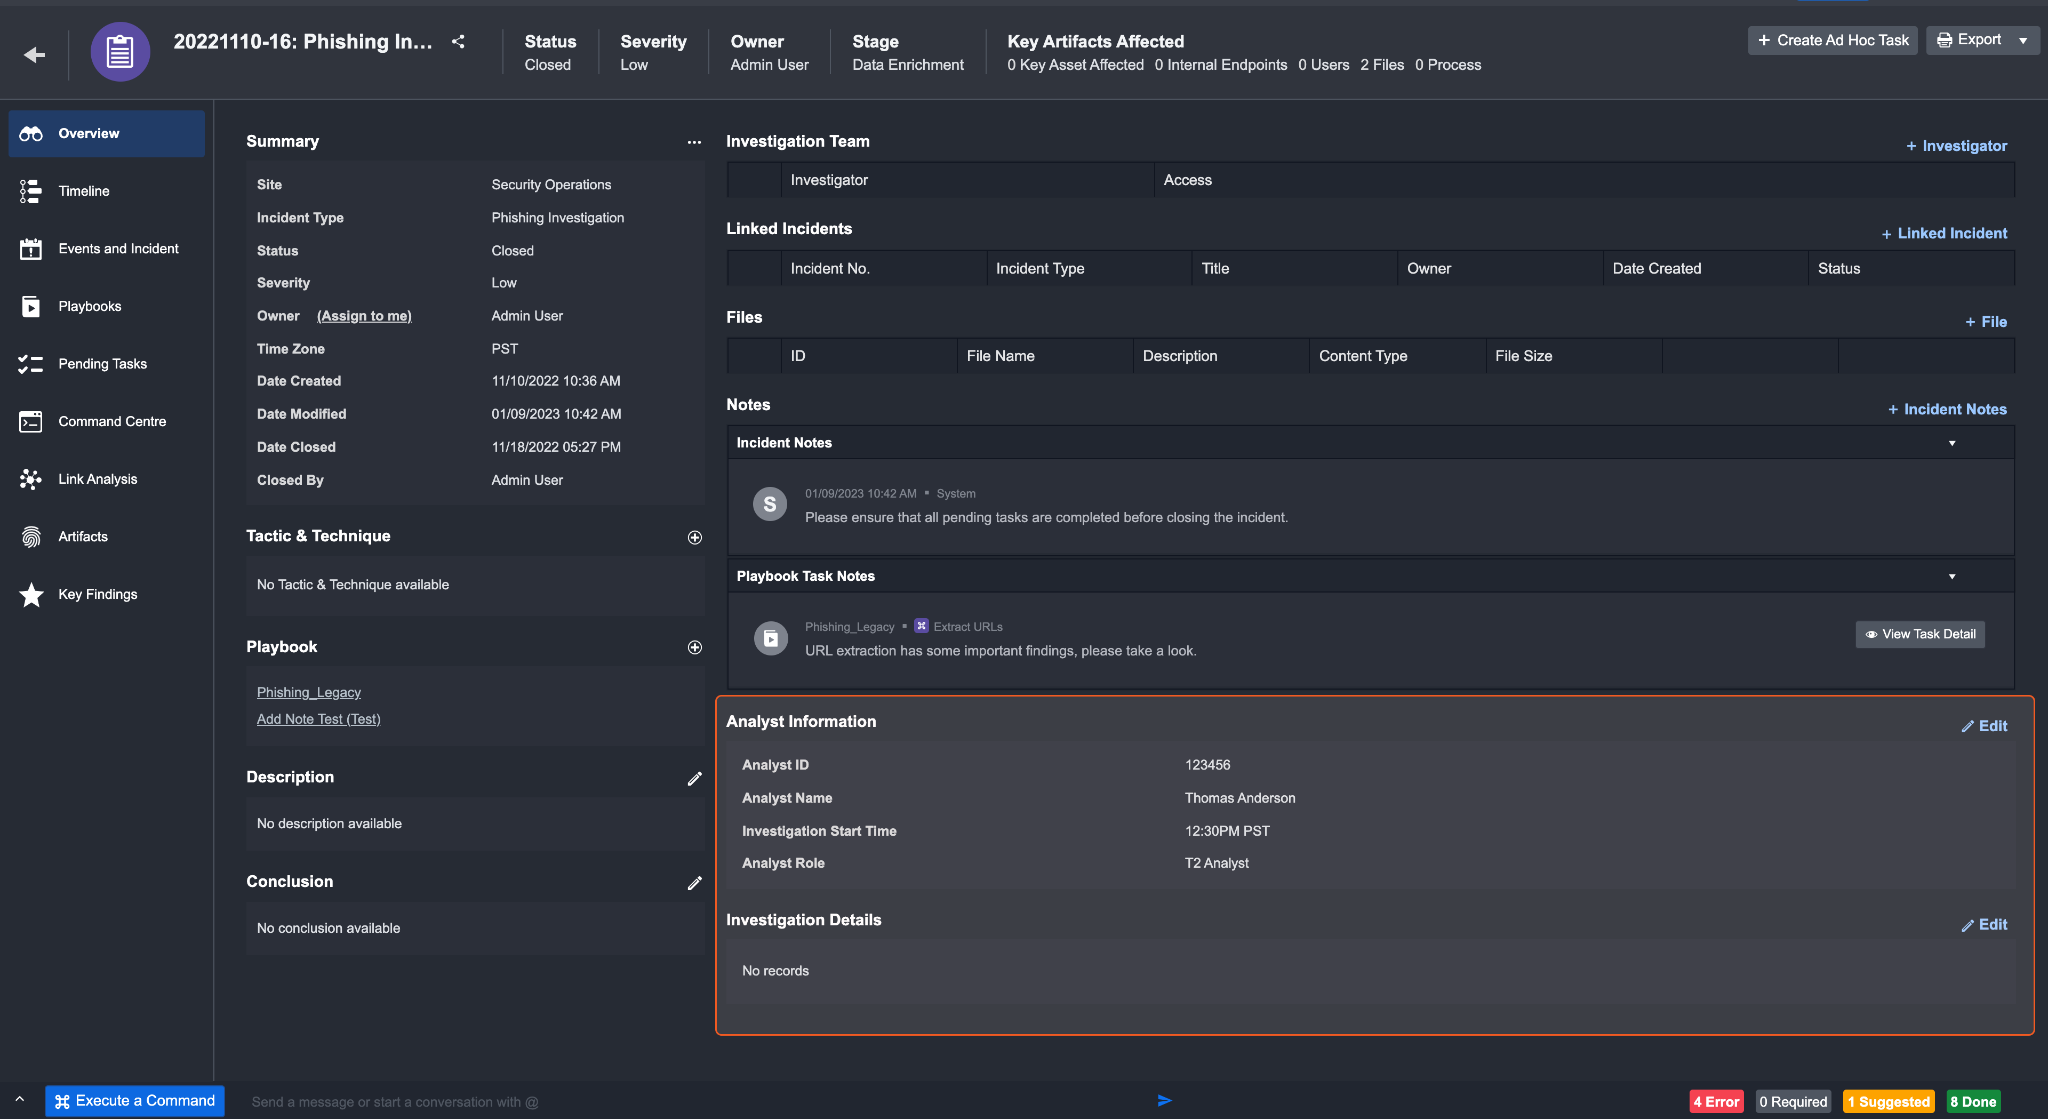
The Overview Tab provides you with a high-level overview of the incident. In this tab, you can make incident-specific changes such as editing Incident’s Summary details, adding additional Tactics & Techniques, running multiple Playbooks and more. The sections below highlight the workflows you can conduct in the Overview Tab.
Incident Summary
The Summary section contains details originally inputted by an analyst or playbook during the event escalation or incident intake process, including custom sections created in Incident Form Editor. You can update any of the details within the Summary section. Hovering your cursor over the ellipses icon will display all the editable options.
Reader Note
If you want to quickly assign an Incident owned by another investigator to yourself, you can click on the Assign to me link beside the Owner label.
Assigning Additional Playbooks to an Incident
When an Incident is initially created or escalated from an Event, you will be prompted to select a Playbook from the dropdown list. If you need more automated or orchestrated workflows to supplement the investigation, you can assign additional Playbooks to the Incident.
To assign multiple playbooks to an Incident:
Select an Incident from the Incidents List.
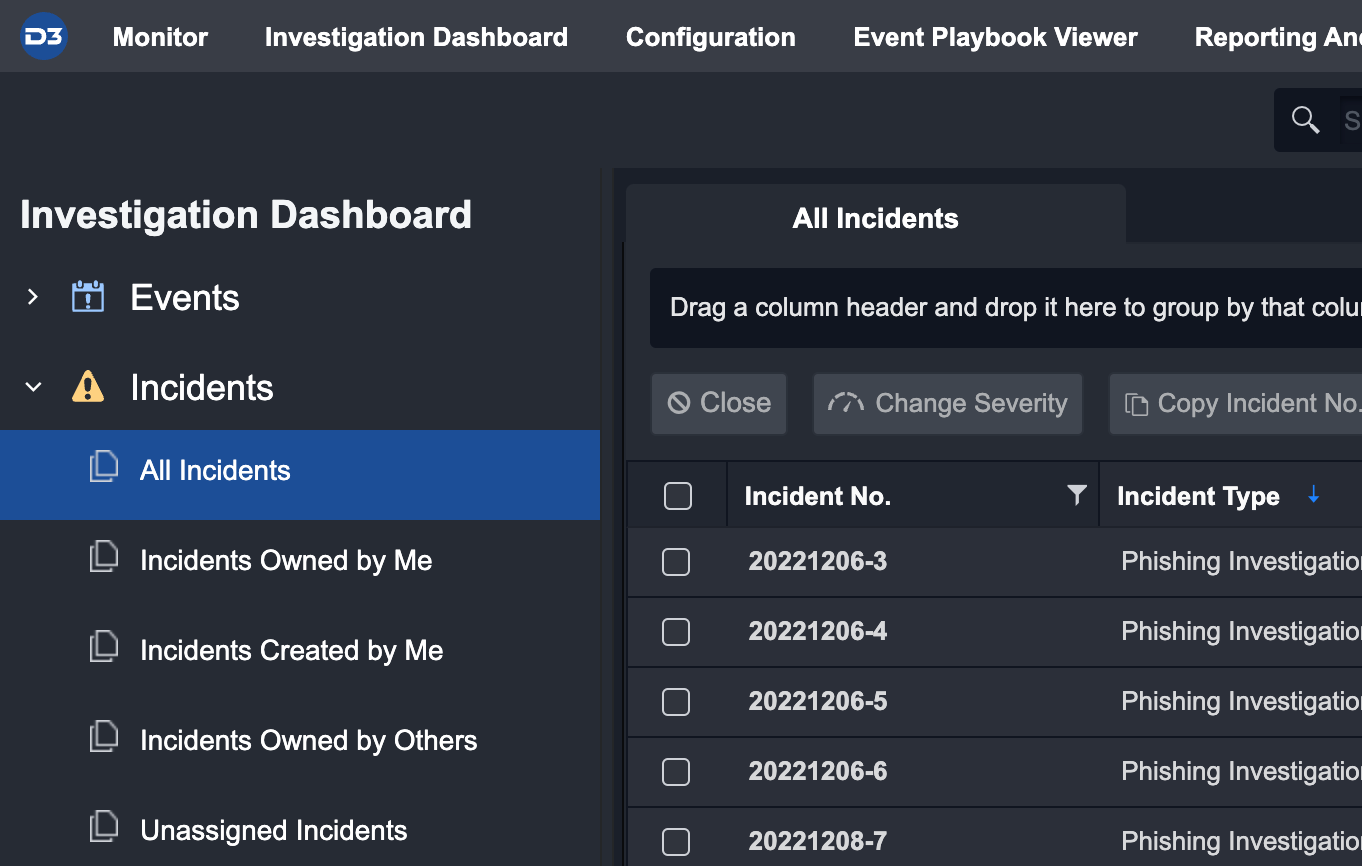
The Overview tab will display the Playbook(s) currently assigned to the Incident under the Playbook header.
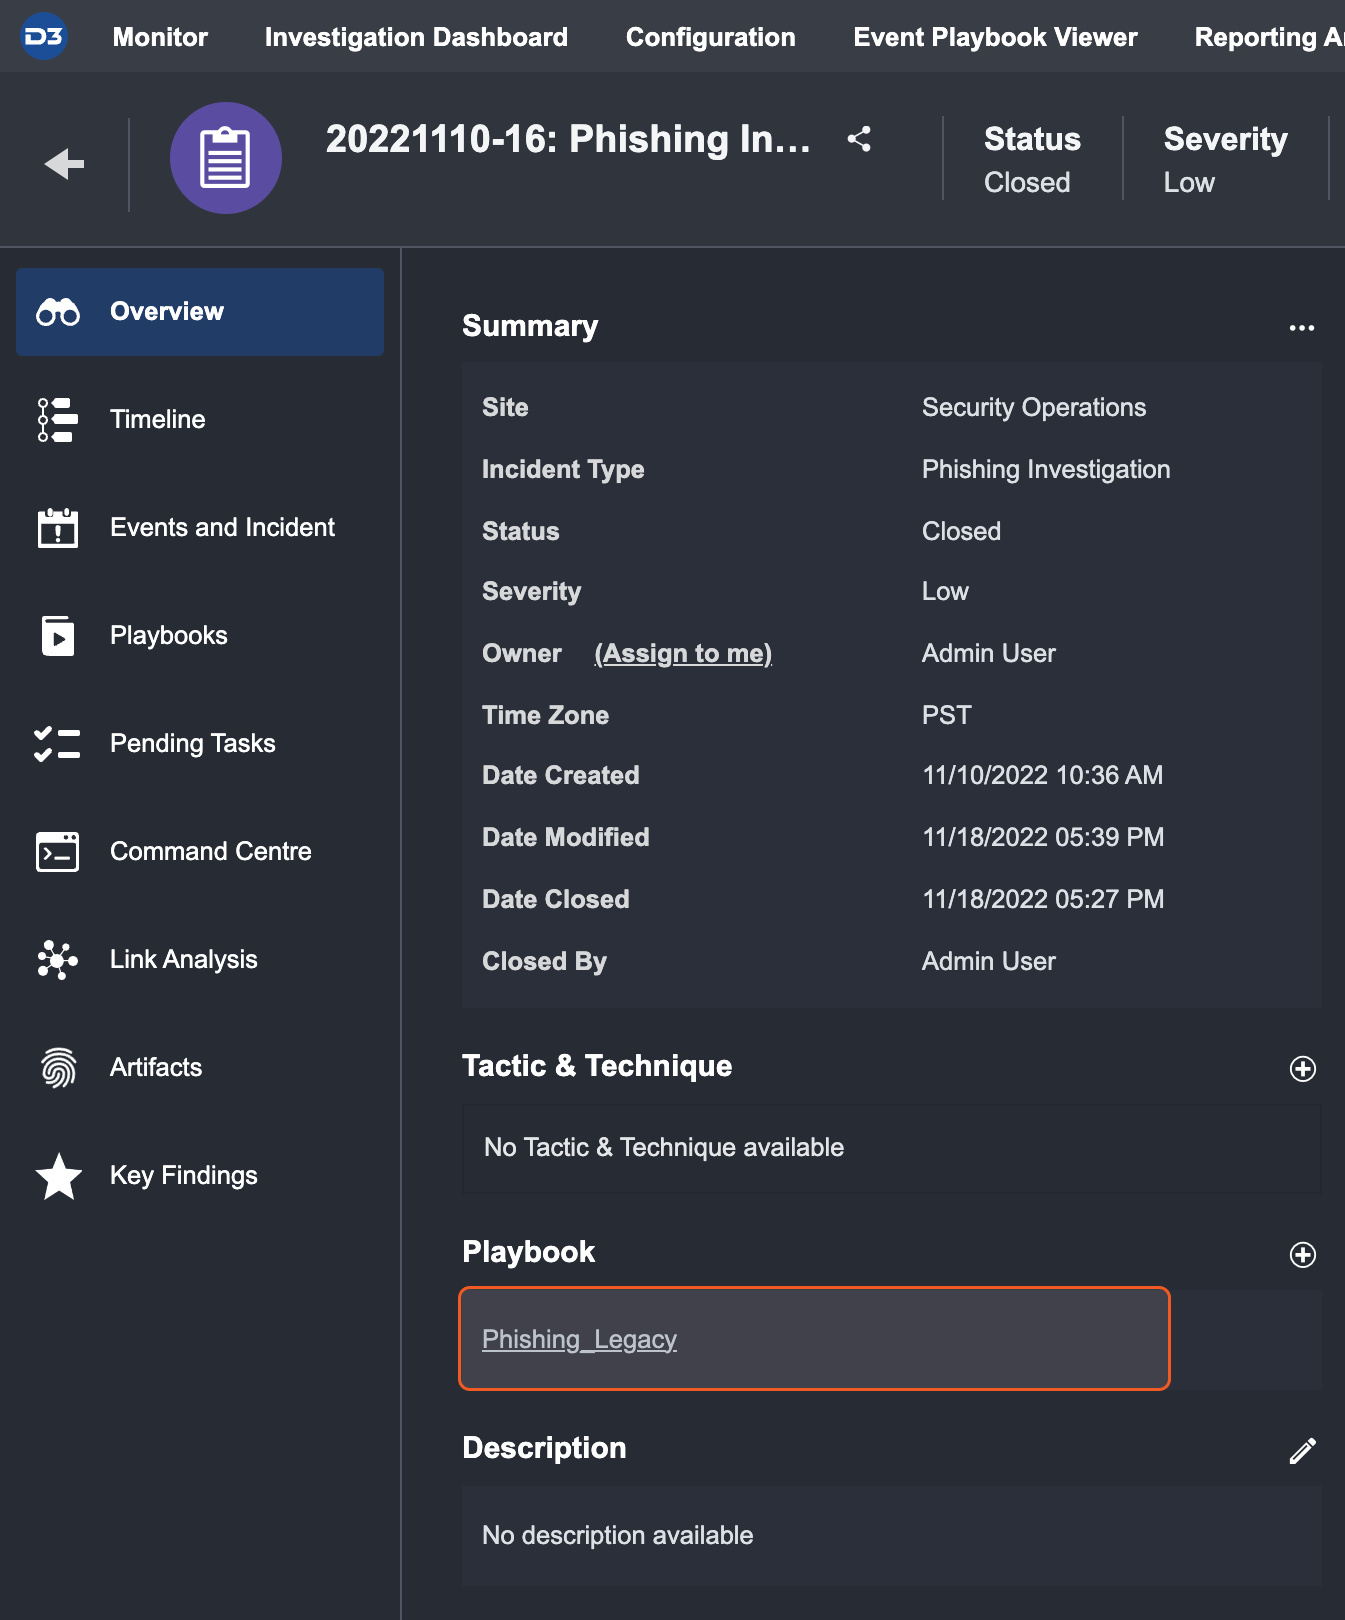
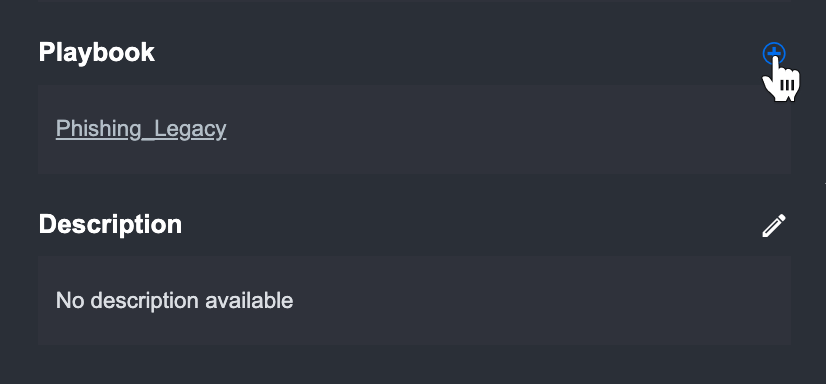
Click on the "+" icon next to the Playbook header to open the “add” popup window.
From the window, select a new Playbook to add to the Incident.
Reader Note
You can apply Role-based access privileges in the Organization Management module to restrict certain Roles from viewing any Playbook-related information in the Incidents Workspace.
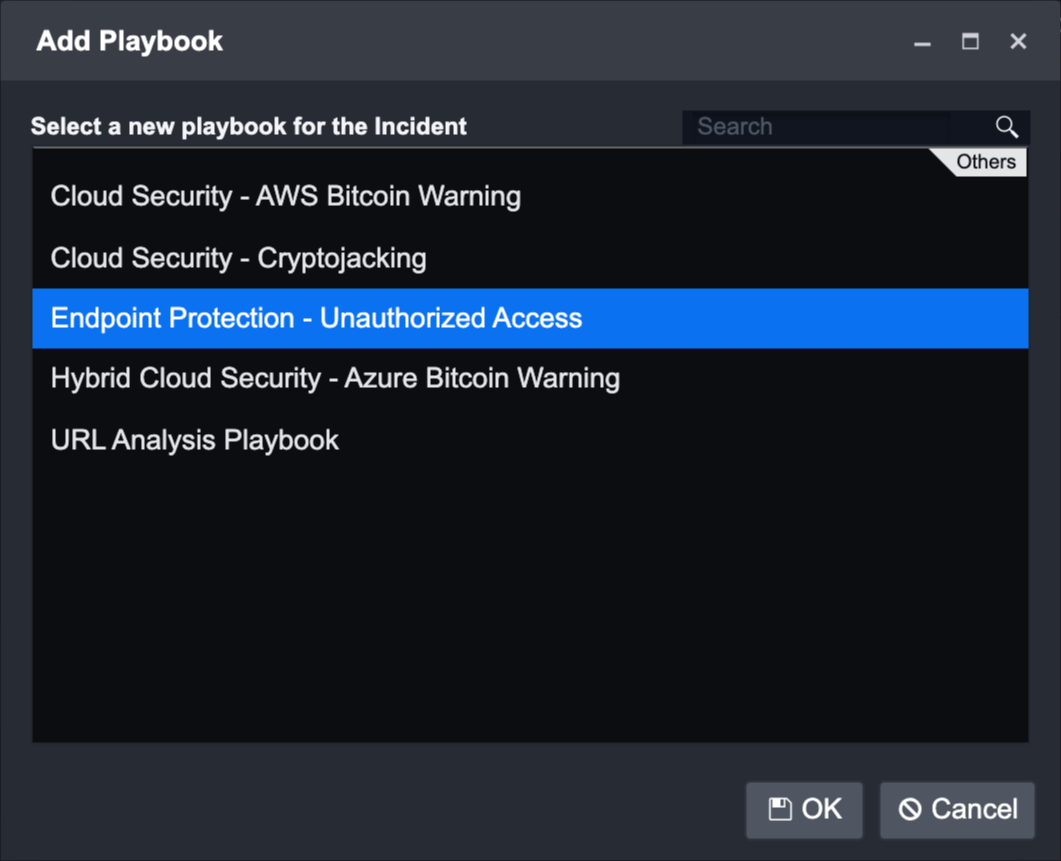
Click on OK to add.
Result
The selected Playbook will appear in the Playbooks tab. Click on any of them to be directed to the respective Playbook View.
Tactics & Techniques in Incidents
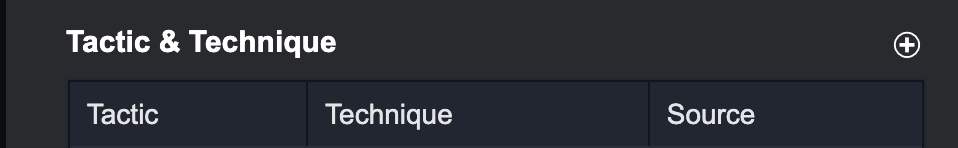
In the new Tactic & Technique table, you can manually add and/or remove Tactics, Techniques and Procedures (TTP) to an Incident.
Using these TTP labels, you can categorize incoming Incidents and Events that happen to your organization based on the MITRE ATT&CK framework. This categorization helps the ingested data to be visualized in the Monitor Workspace, where you can have a high-level overview of the organization’s security status.
Features | Tactic & Technique Table |
1. This table displays all Tactics & Techniques of the current Incident, related Incidents, and related Events. If the current Incident was escalated from an Event, that Event’s TTP will also be displayed in this table. 2. TTP details are accessible via clicking on the highlighted title. 3. Each Tactic & Technique has a Source Tag to indicate whether they belong to an Incident or an Event.  Tactics & Techniques with the incident tag are removable from the Incident Workspace.  Tactics & Techniques with the event tag are unremovable from the Incident Workspace, and can only be added/removed in the Event Details. Reader Note In Event Details, if you add/remove Tactics & Techniques of a related Event, it will be added/removed from this table in the Incident Workspace. The converse cannot happen. | 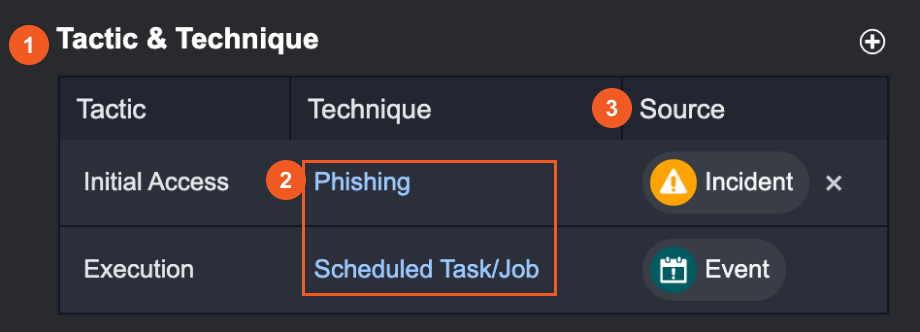 |
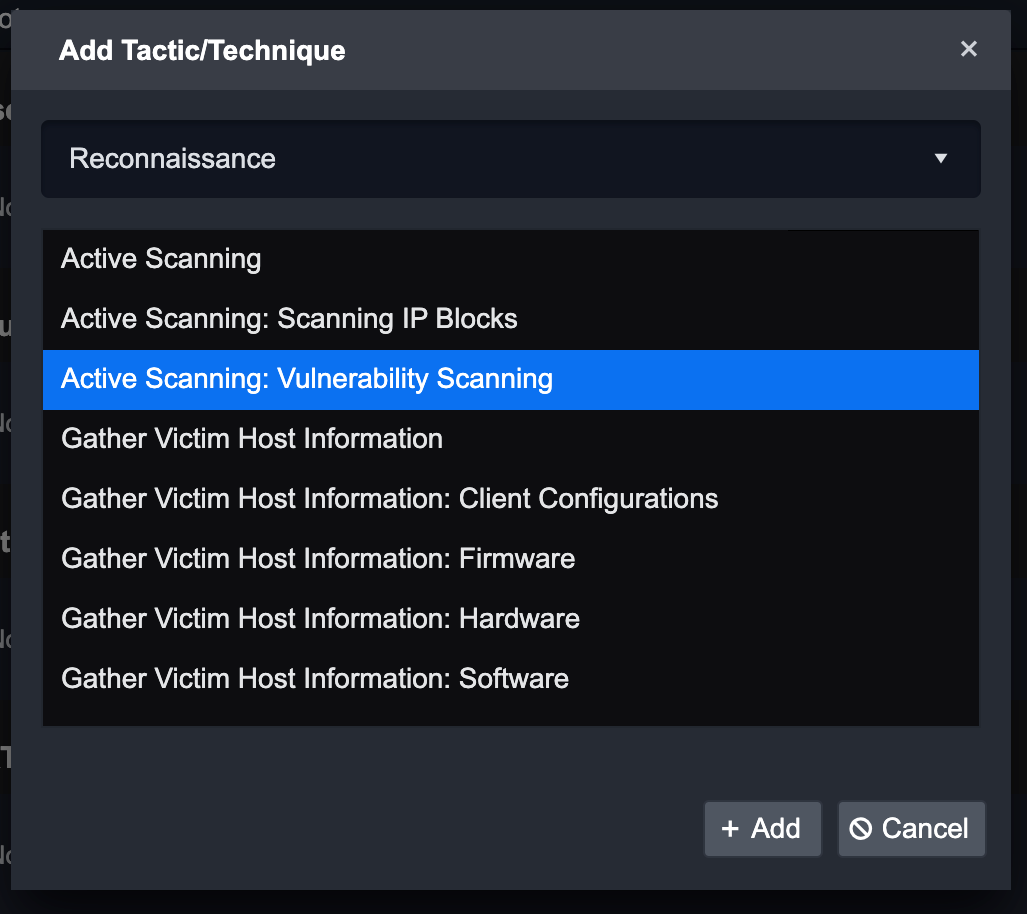
To manually label Tactics & Techniques for Incidents
Click on +.
Click on the dropdown to browse through the Tactic List.
Choose a Tactic.
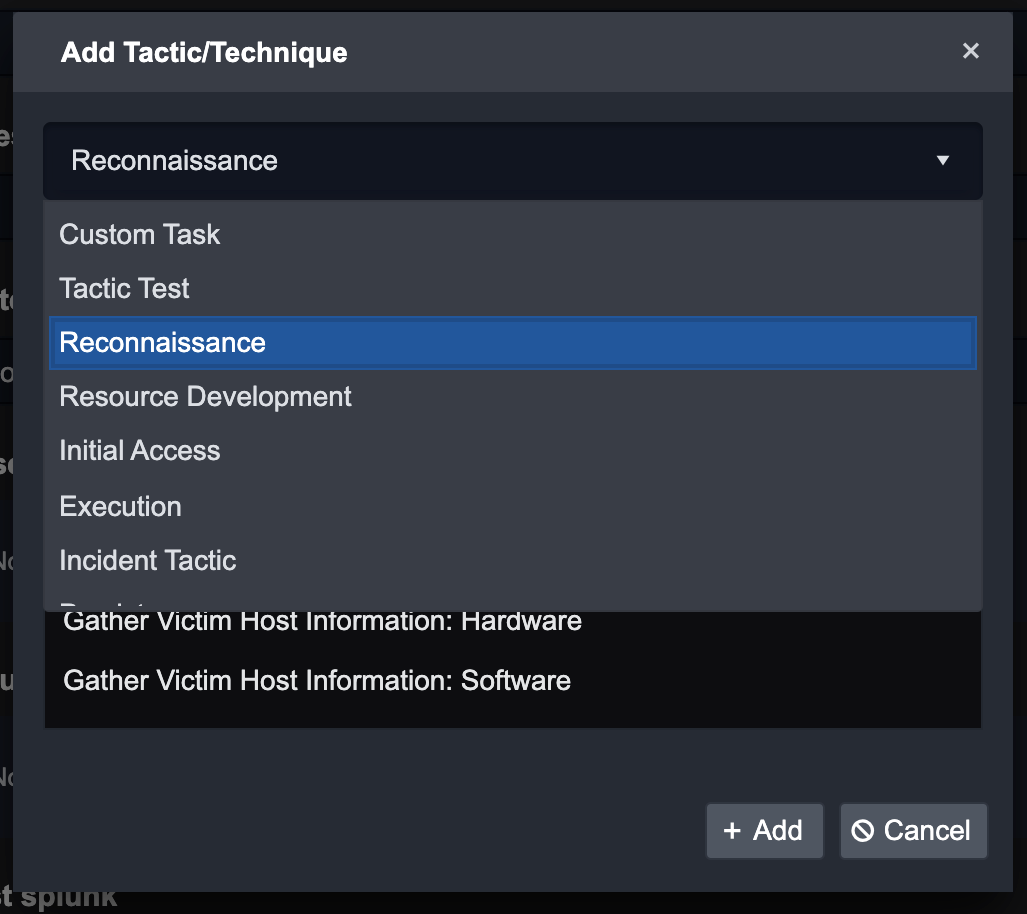
Then choose a Technique.
Click on the + Add button to add Tactic and Technique.
Incident Investigation Team
You can build different sizes of investigation teams to correspond to the complexity of an Incident. When building your team and adding investigators, you can set Incident-specific and Stage-based access controls. This ensures clear boundaries of responsibilities within an investigation.
Any analyst with access privileges to view/edit Incidents can be selected and added as an investigator by following the steps below:
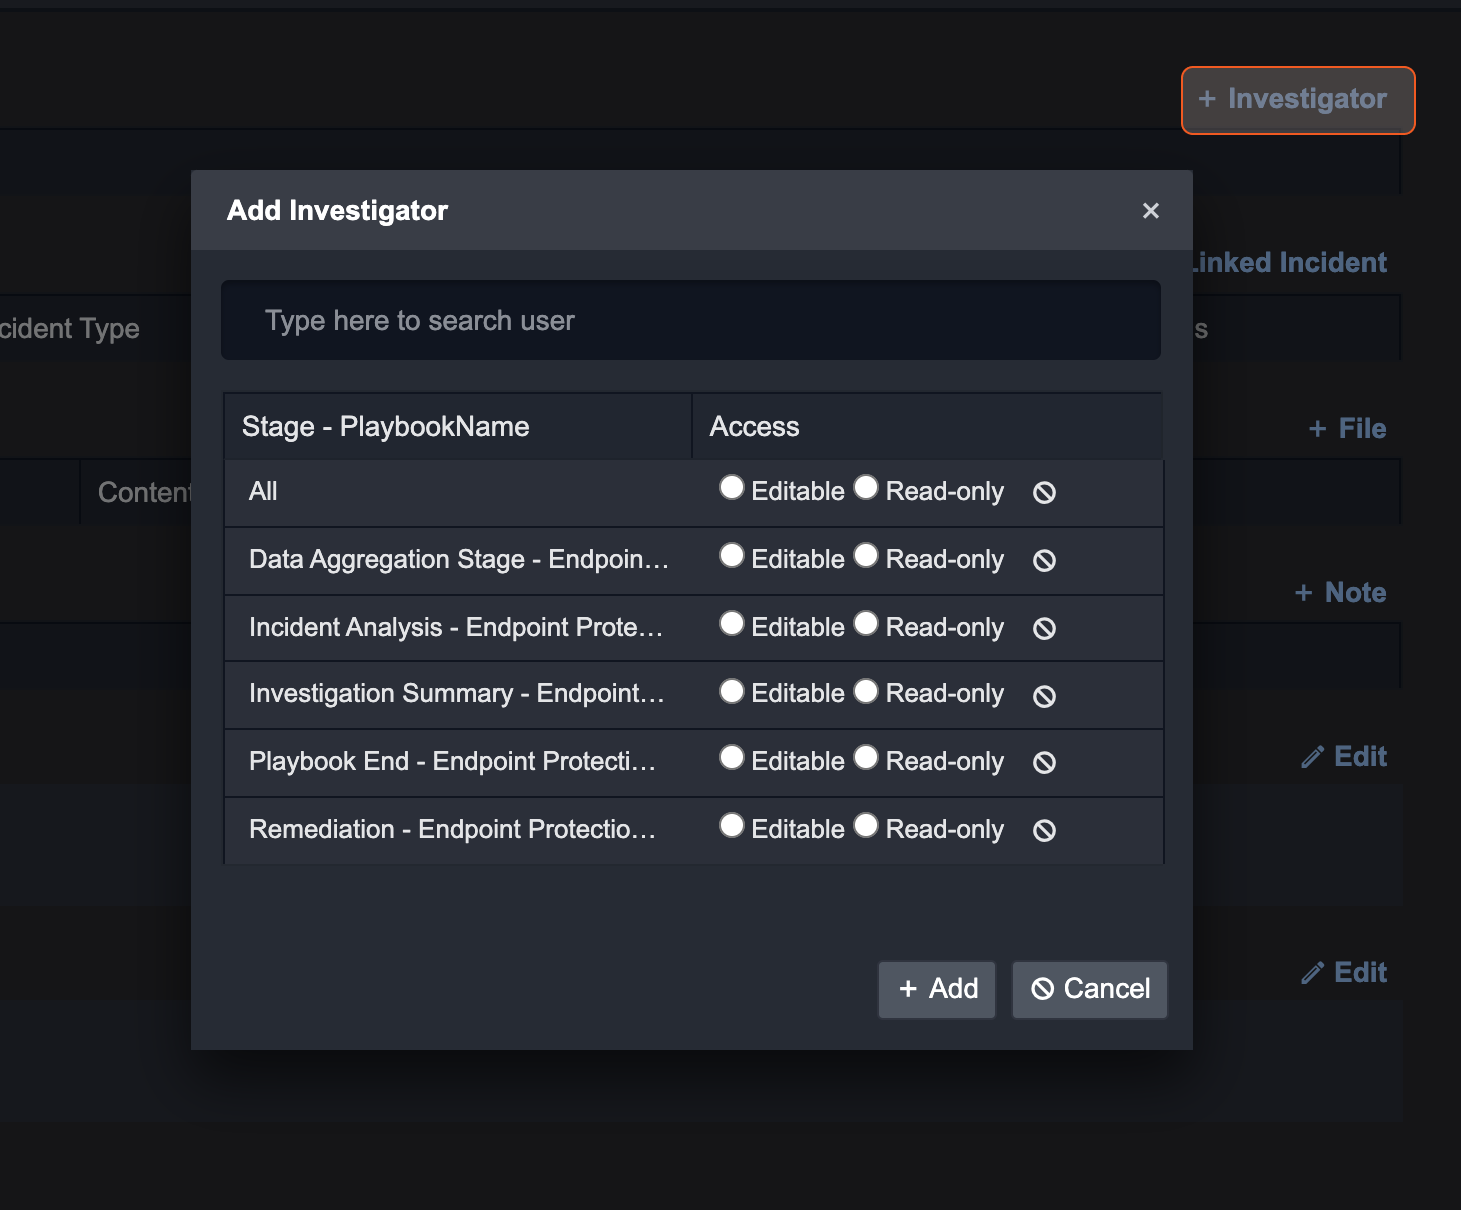
Click on + Investigator on the top right corner of this page.
Search for a User in the search bar. You can select all by pressing Ctrl + A on your keyboard.
For each Incident Stage, select the appropriate access level: Editable or Read-only. Clicking the All radio button for either option will apply the same access to all Incident Stages. If you want to remove the access, click on the cancel icon.
Click + Add to add the investigators with corresponding access.
Repeat the above steps to add more investigators with different levels of access.
Notes
The notes section is a space for you and your team members to record notes quickly. These notes can be used as important information or details to reference during or after an investigation. They are sorted chronologically by the most recently added.
There are two types of notes: Incident note and playbook task notes.
Incident Notes
Incident notes can be added manually or by running Set Incident Notes and Set Incident Notes HTML commands.
To add incident notes manually:
Navigate to the Overview tab in the Incident Workspace.
Click the + Incident Notes button on the far right.
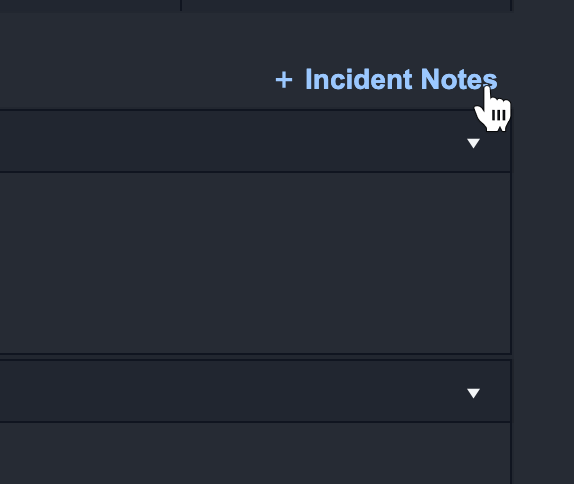
Add in your notes
Click Save to confirm.
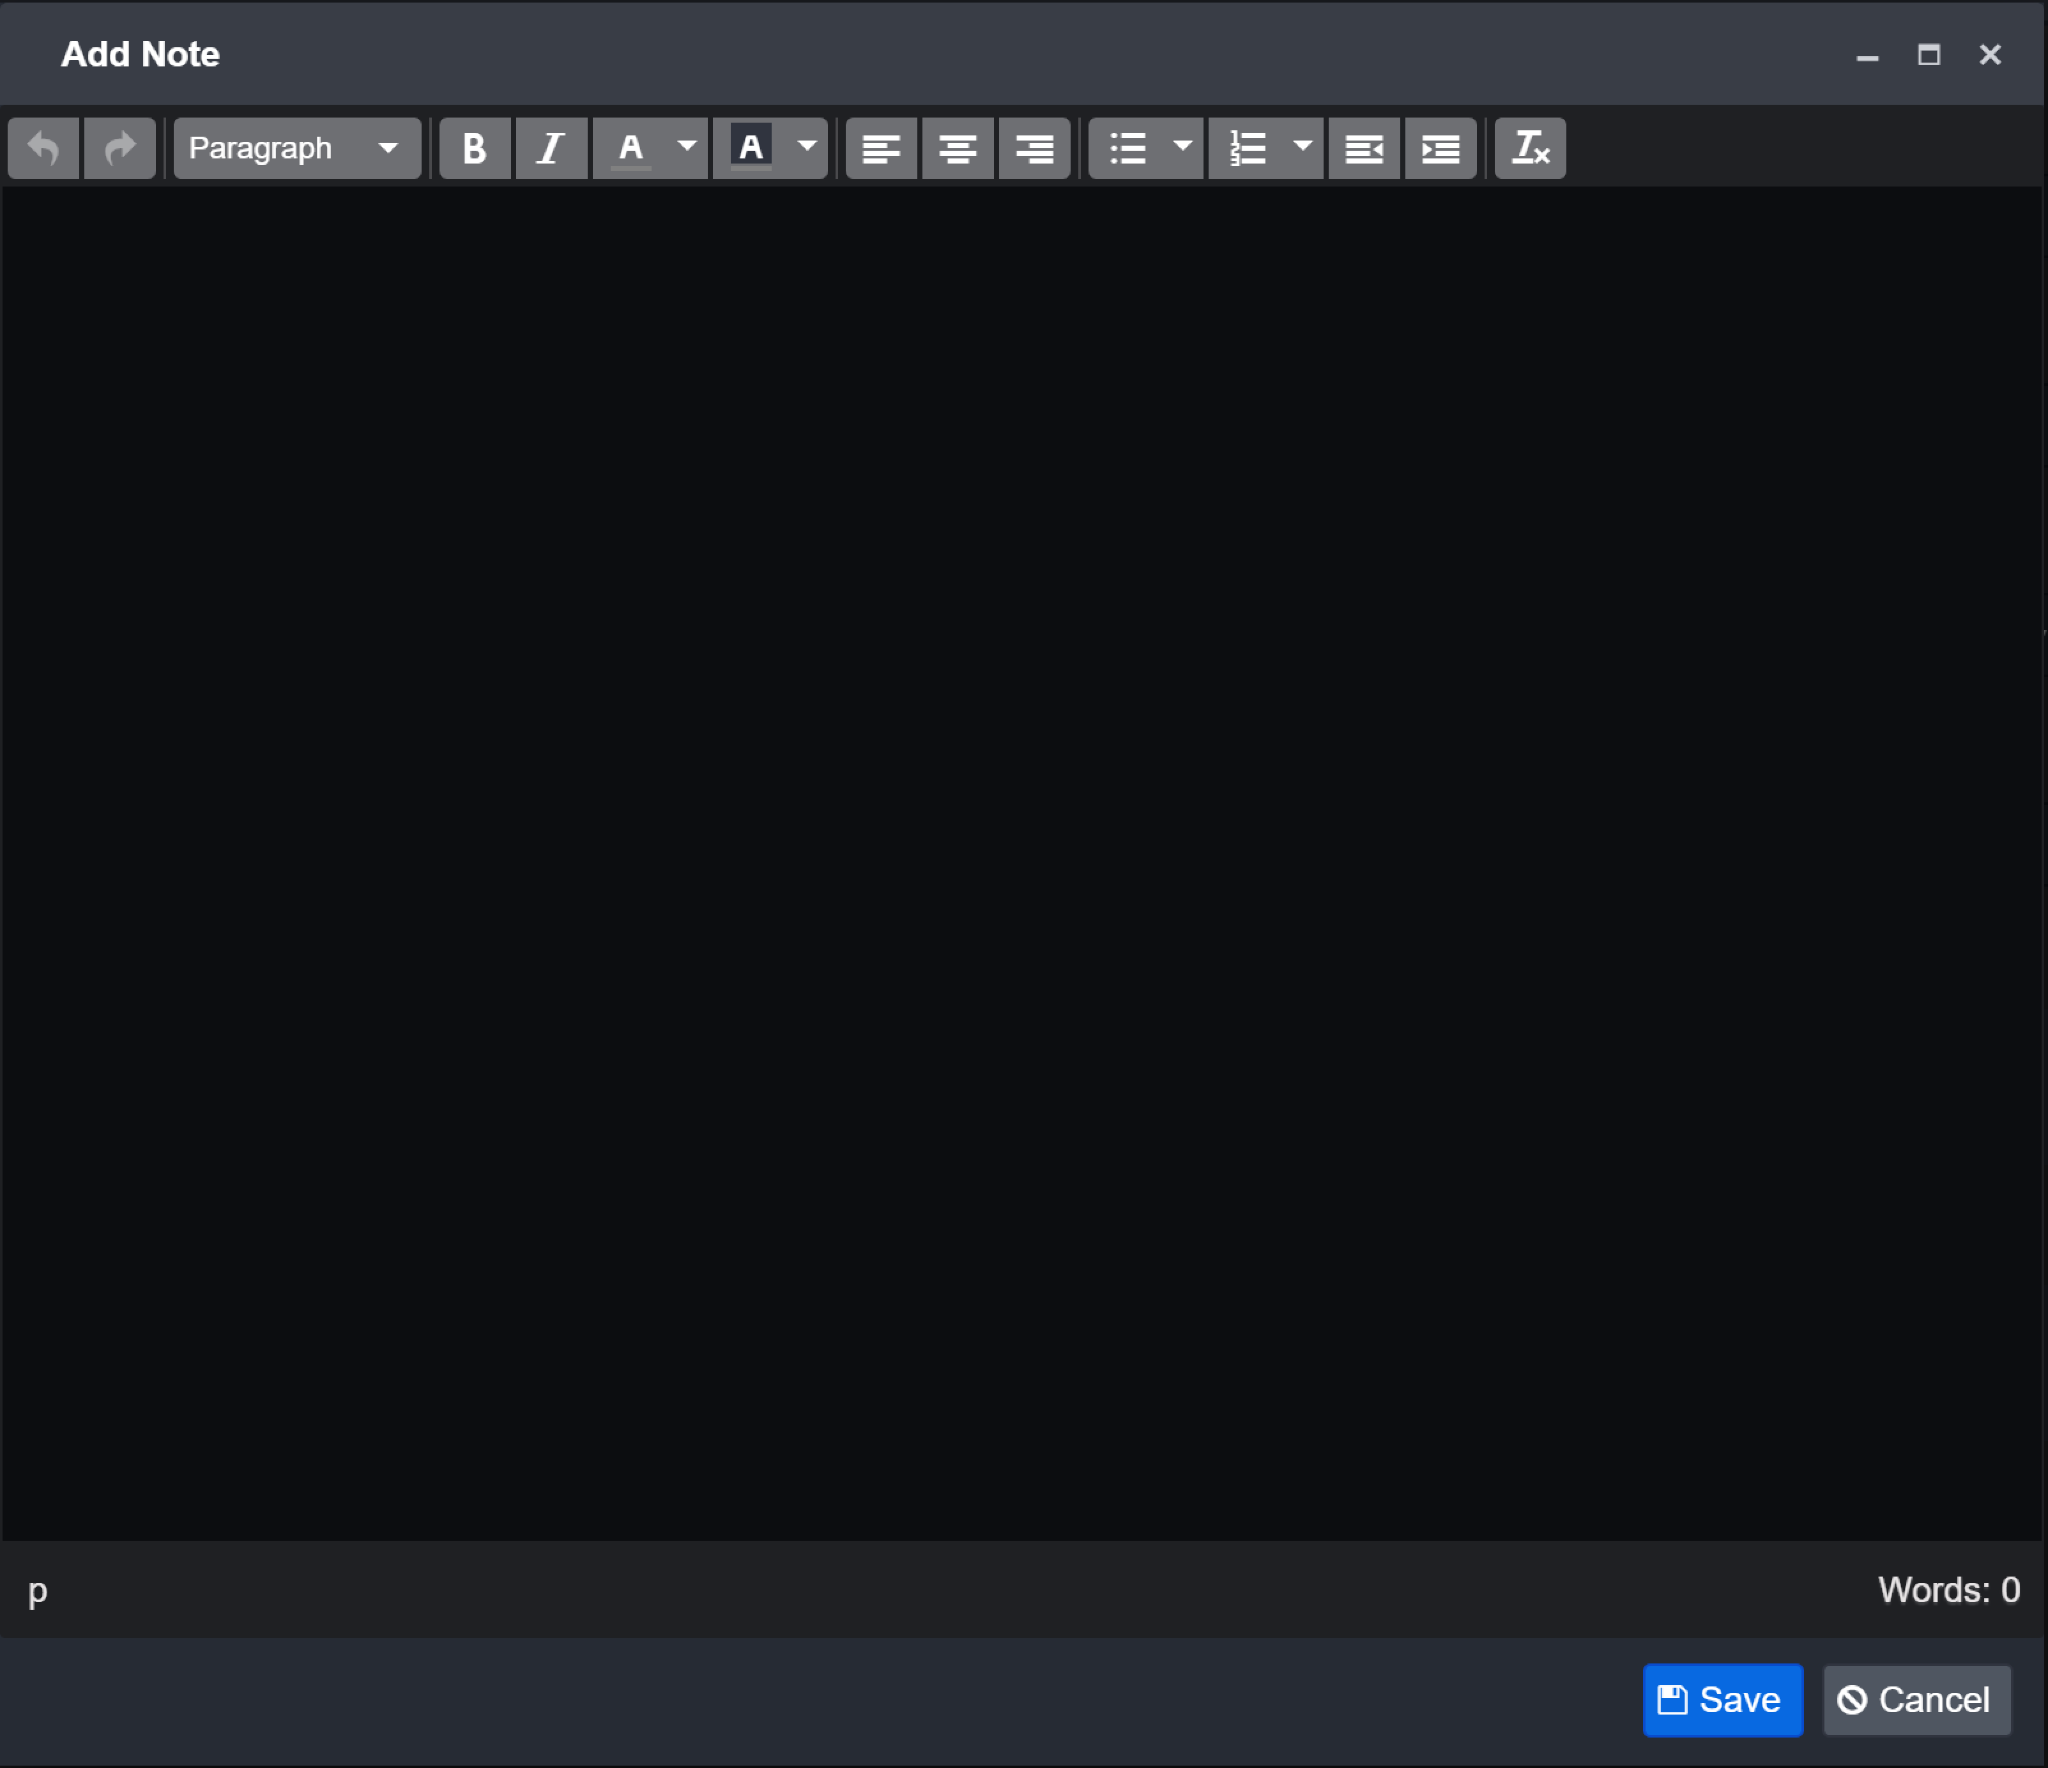
Result: your Notes will be added in a table
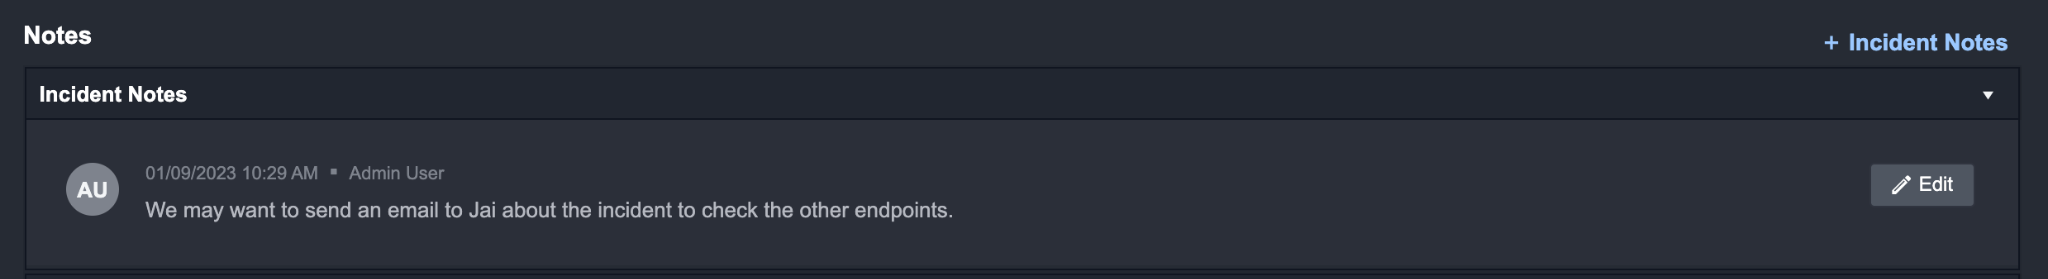
Reader Note
You can also paste (Ctrl + V) images into an Incident’s Notes, Descriptions, and Conclusions to add extra information to your investigation.
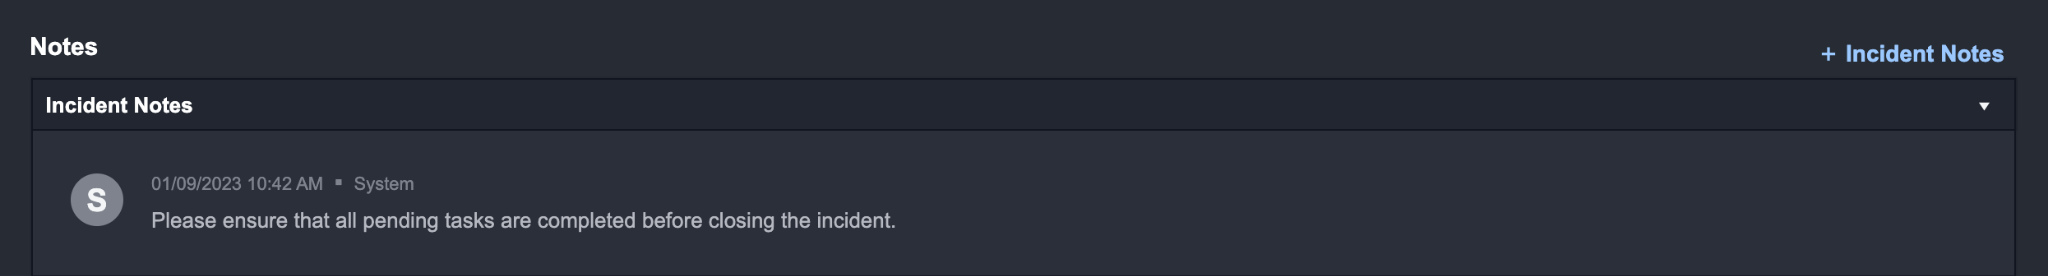
Notes that are added via commands will appear with the system icon.
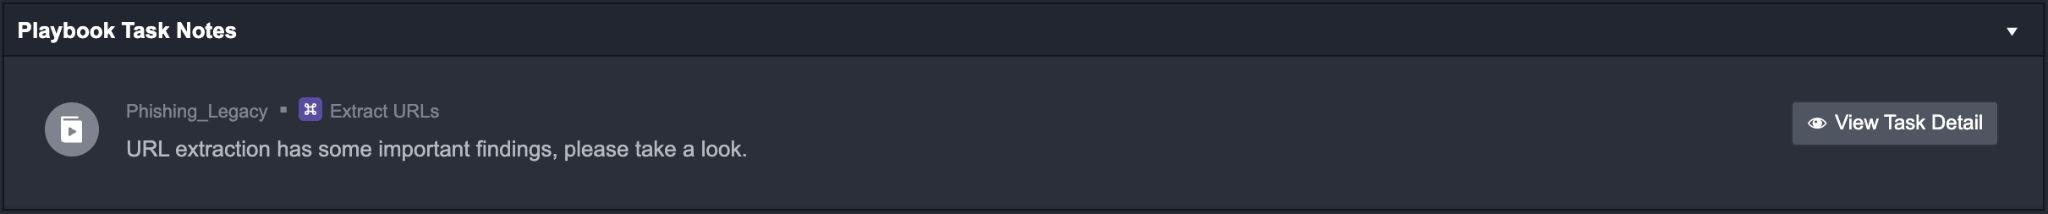
Playbook Task Notes
Notes in this section can be added when you click into a playbook task. It will open the playbook task details window and there will be a prompt to add notes, such as important findings from the task.
To add a playbook task note:
Navigate to the Playbooks tab in the Incident Workspace.
Click on the status of a relevant playbook task. This will open the playbook task details window.
Click the edit button in the notes section on the right-hand side to add your note.
Click Save to confirm.
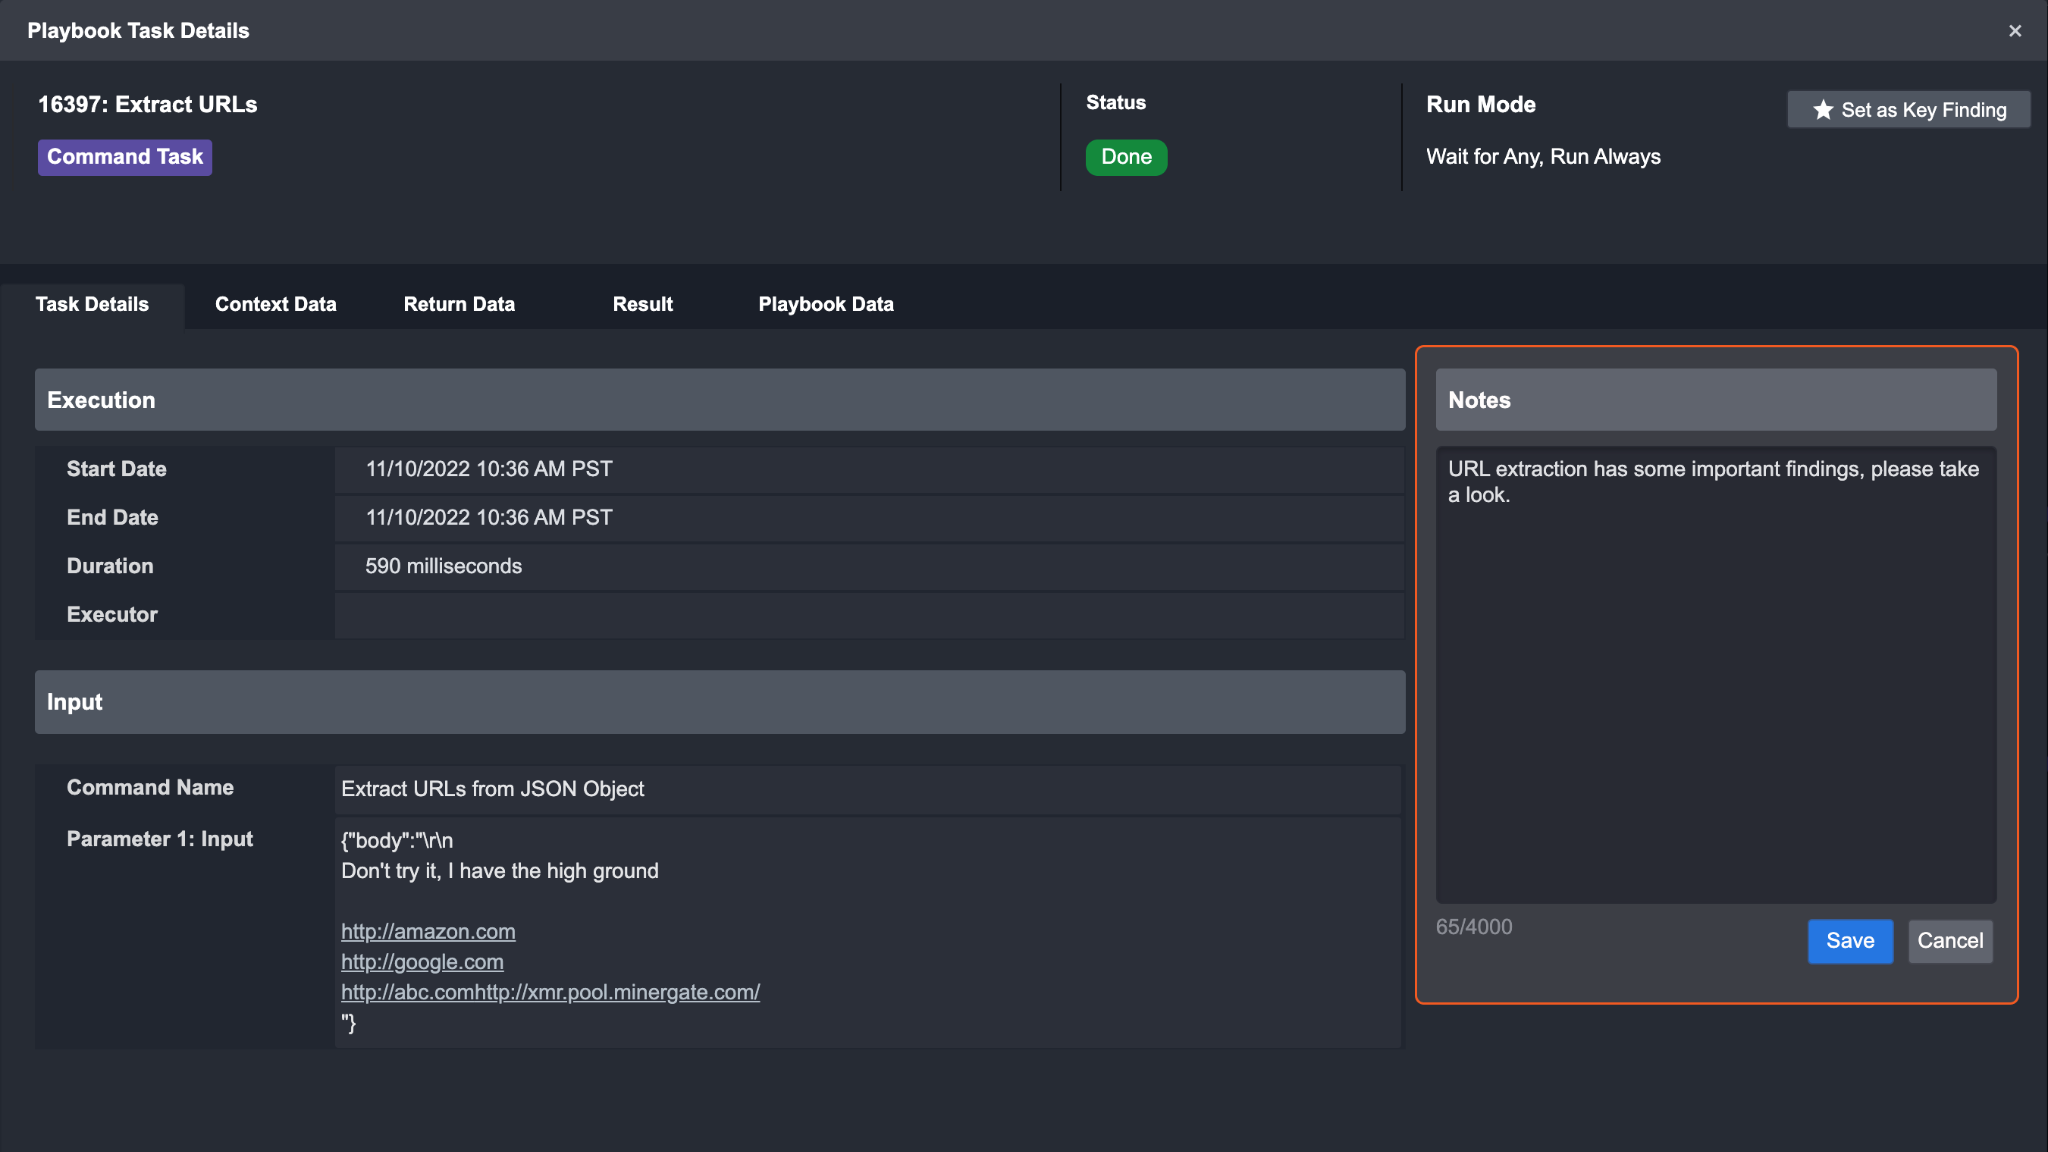
Result: your note will appear in the playbook task notes section.
Linked Incidents
During the Incident response process, you can link other related Incidents to your investigation. This can provide further insight on potentially larger organized attacks.
To link Incidents:
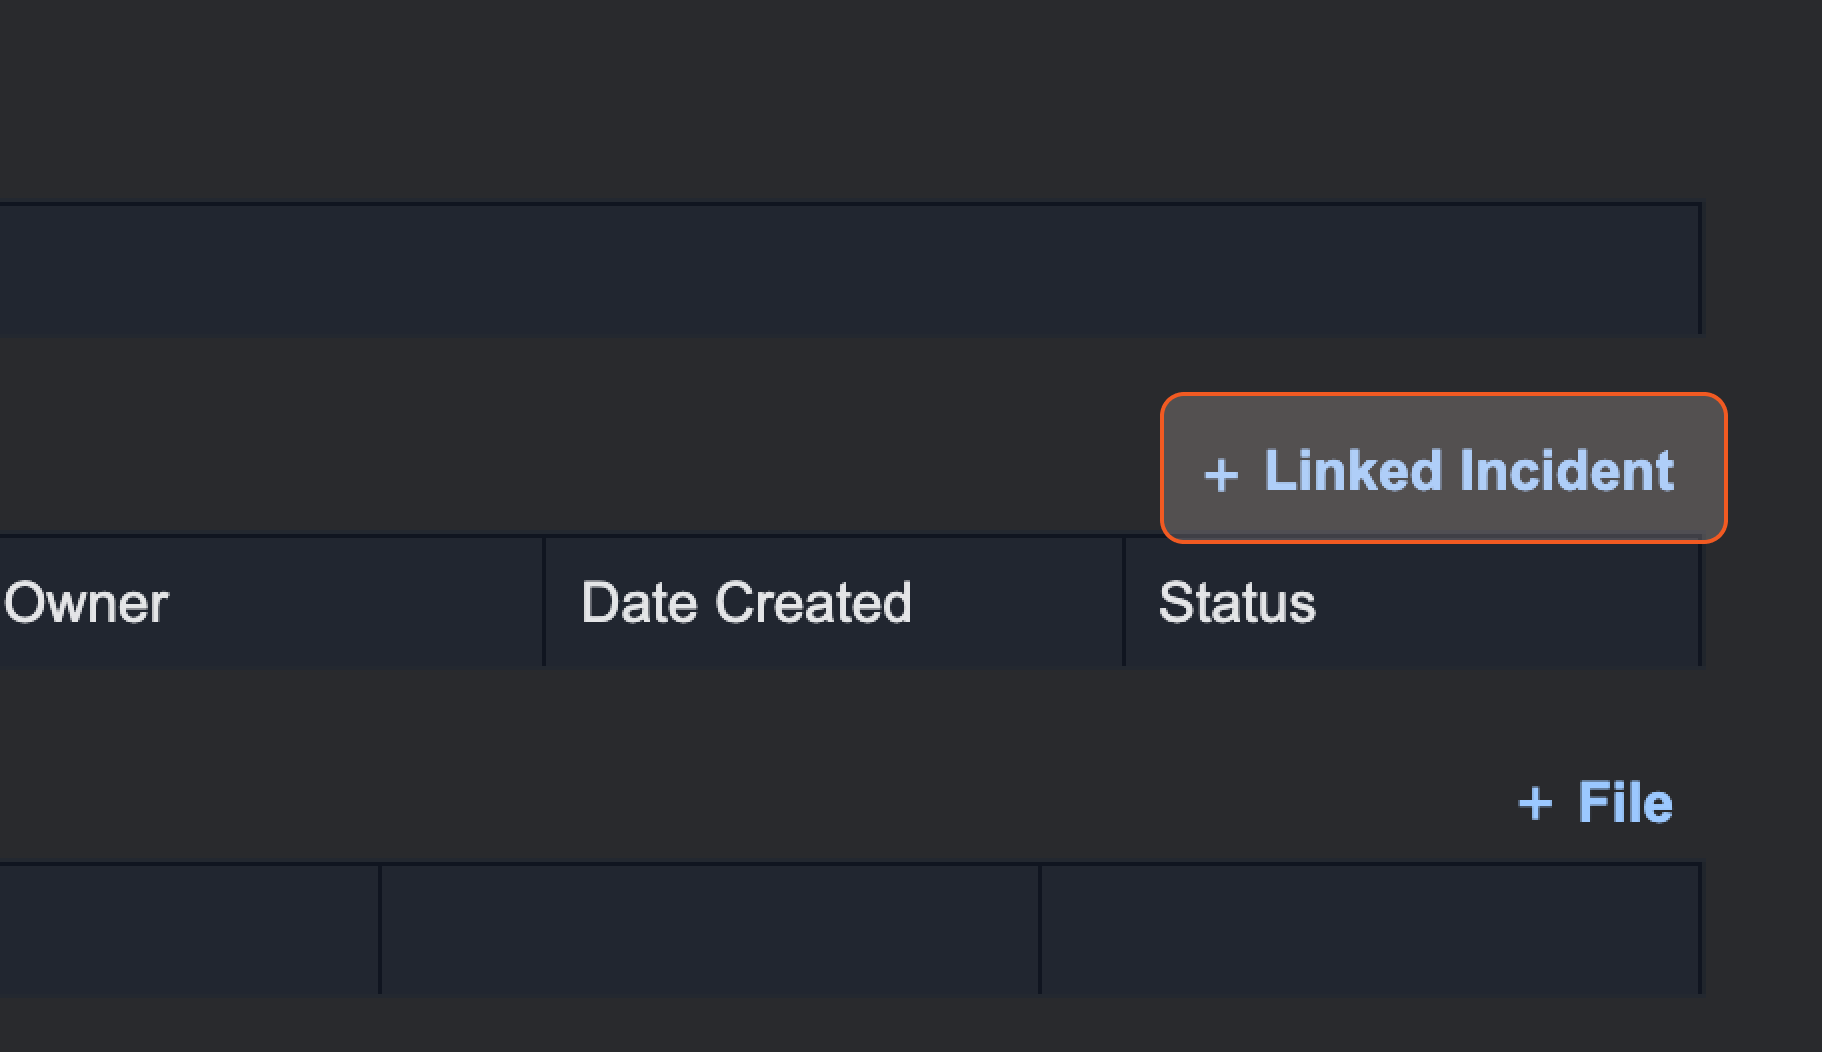
Navigate to the Overview tab in the Incident Workspace.
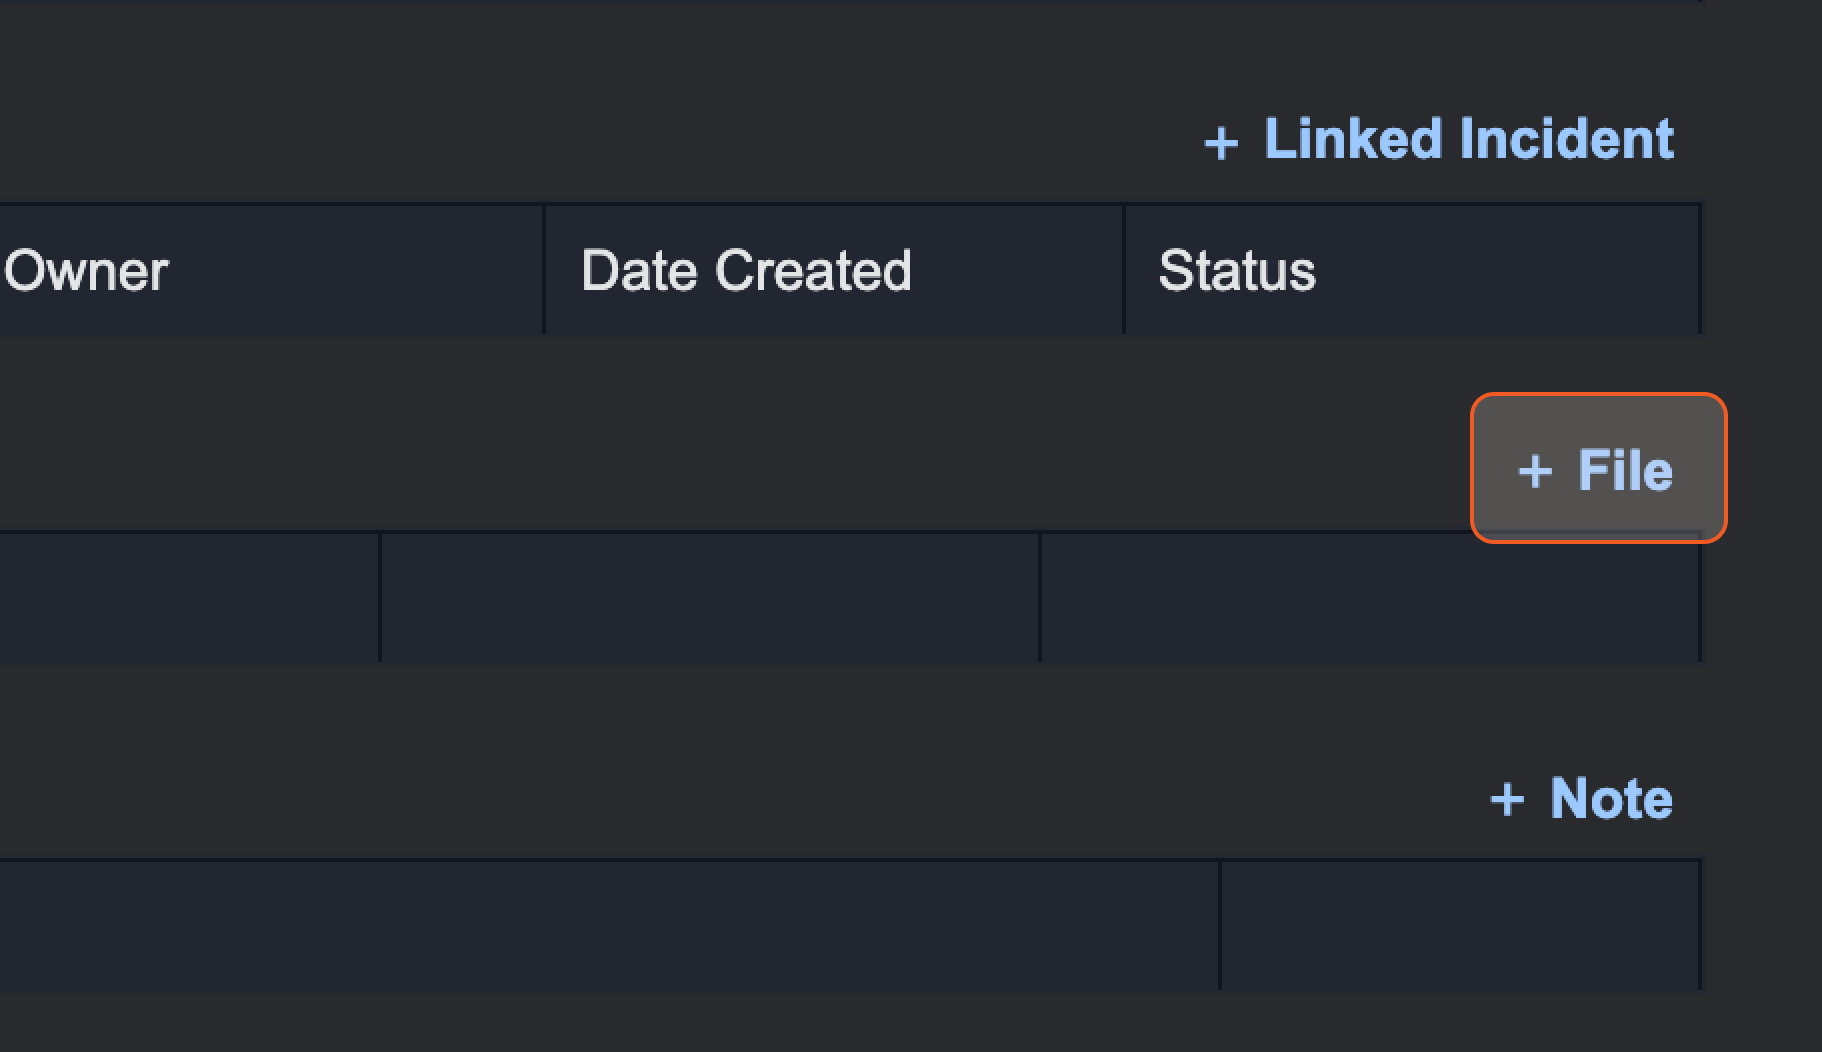
Click on + Linked Incident.
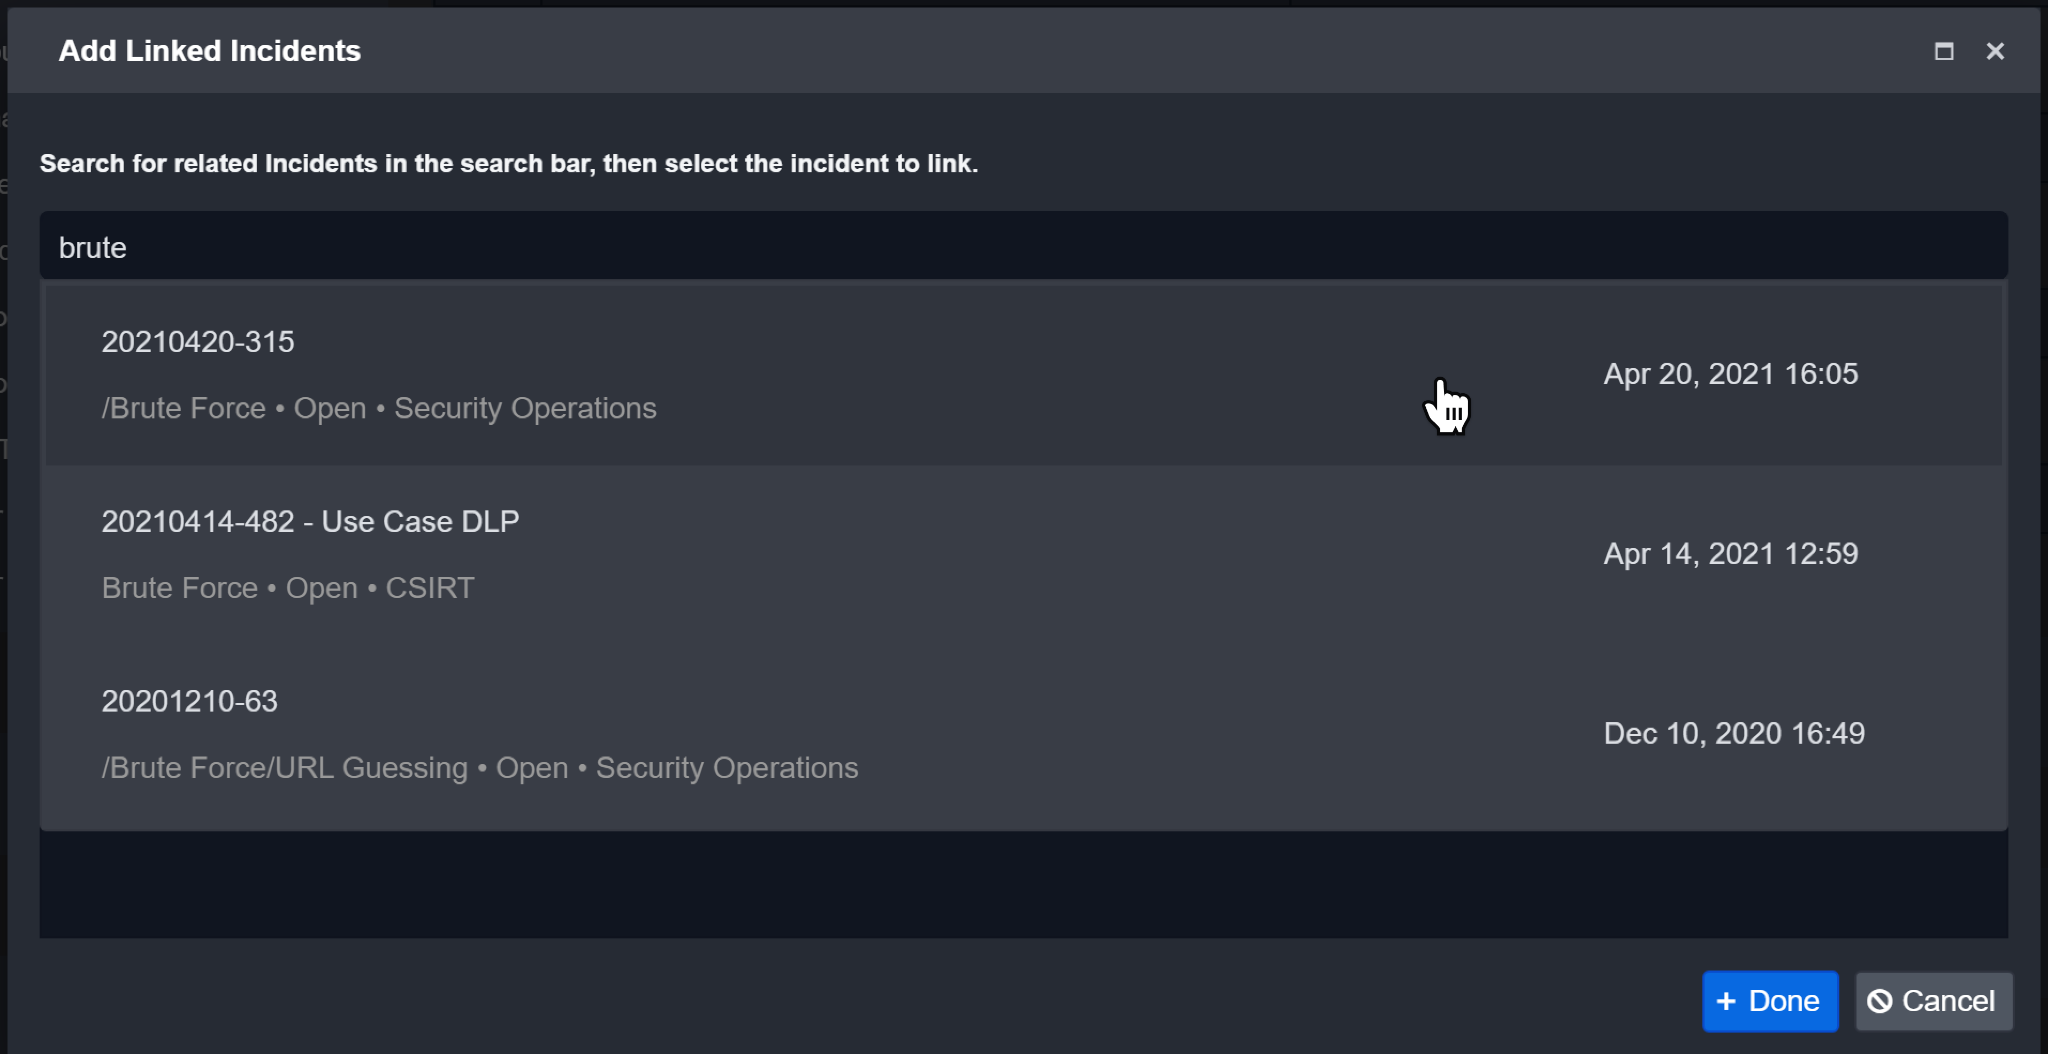
Type in the keywords relevant to your Incident to search.
Example: Brute ForceSelect the Incident you wish to link.
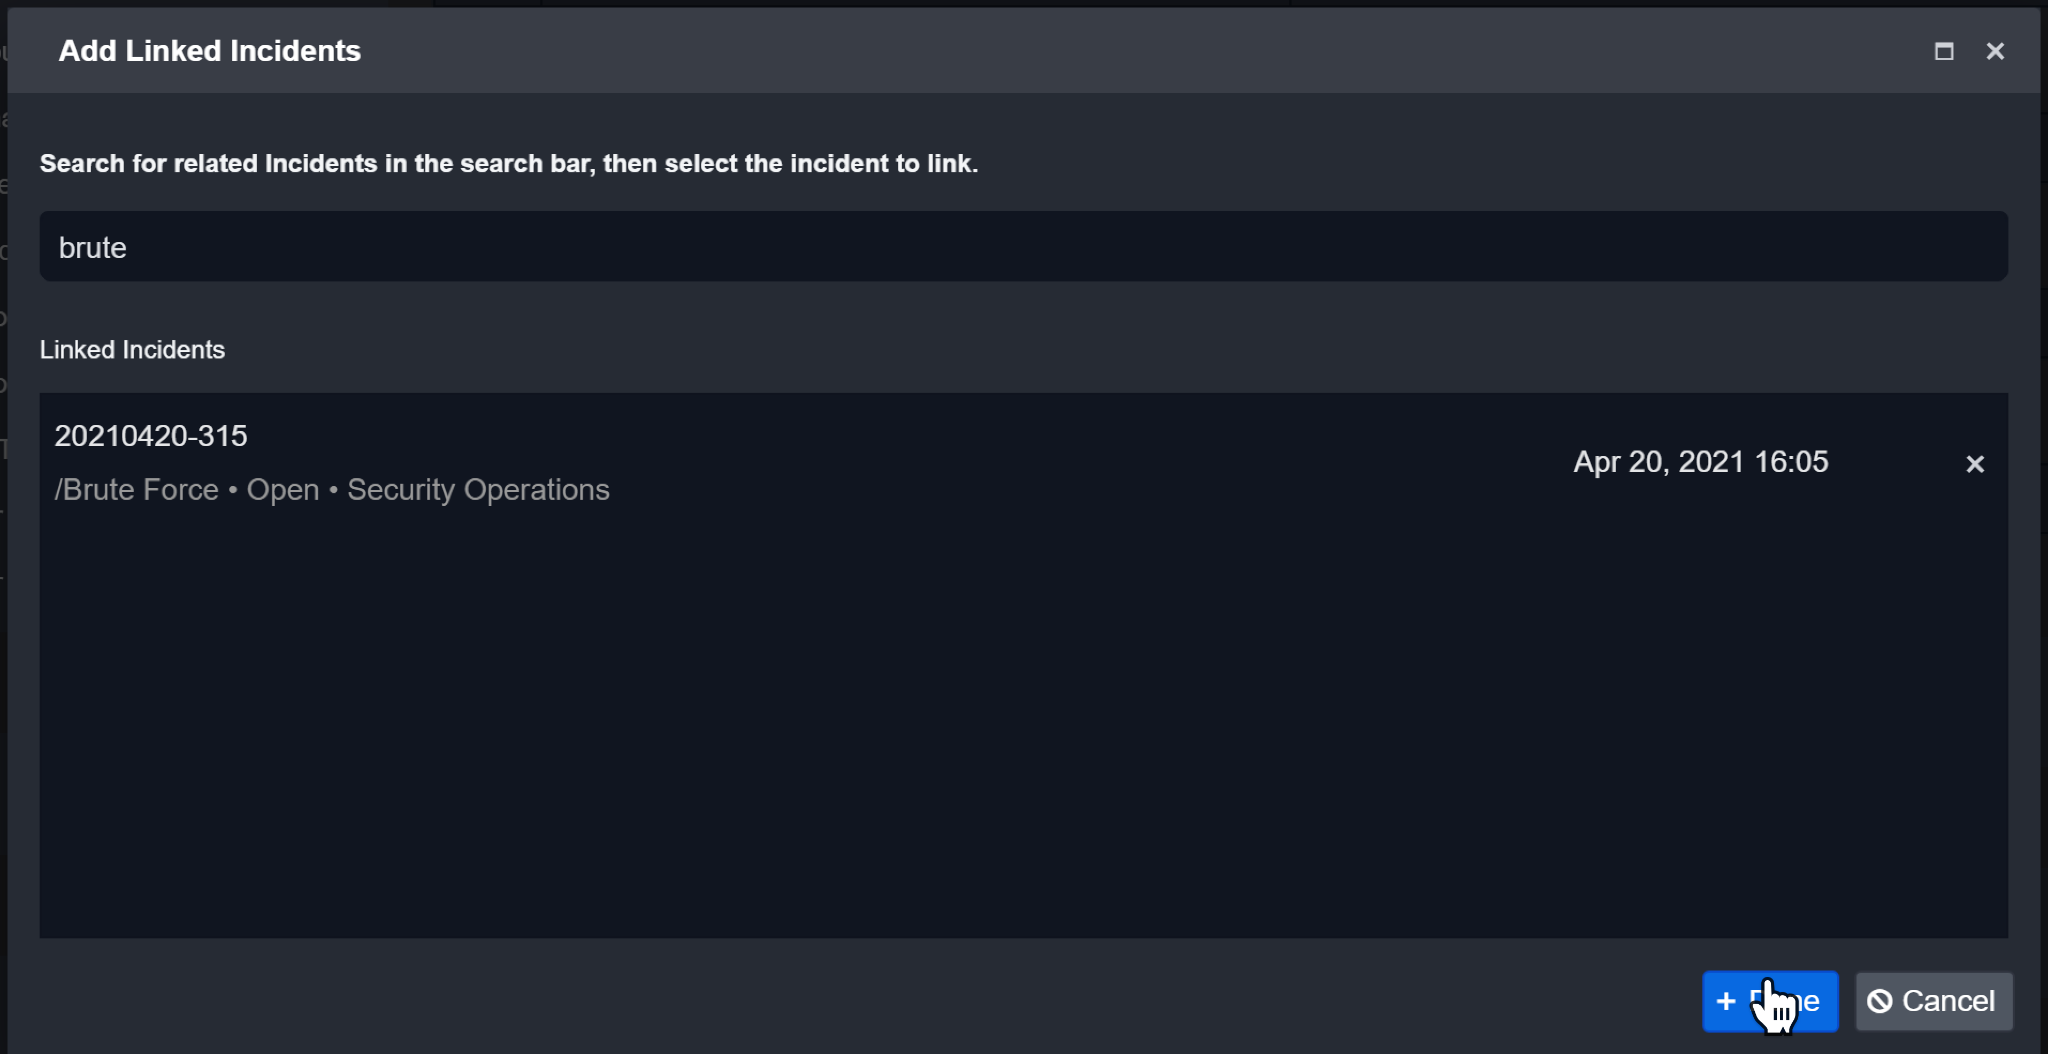
Result
The Linked Incident will be displayed in the Linked Incidents box.
Click on Done to confirm.
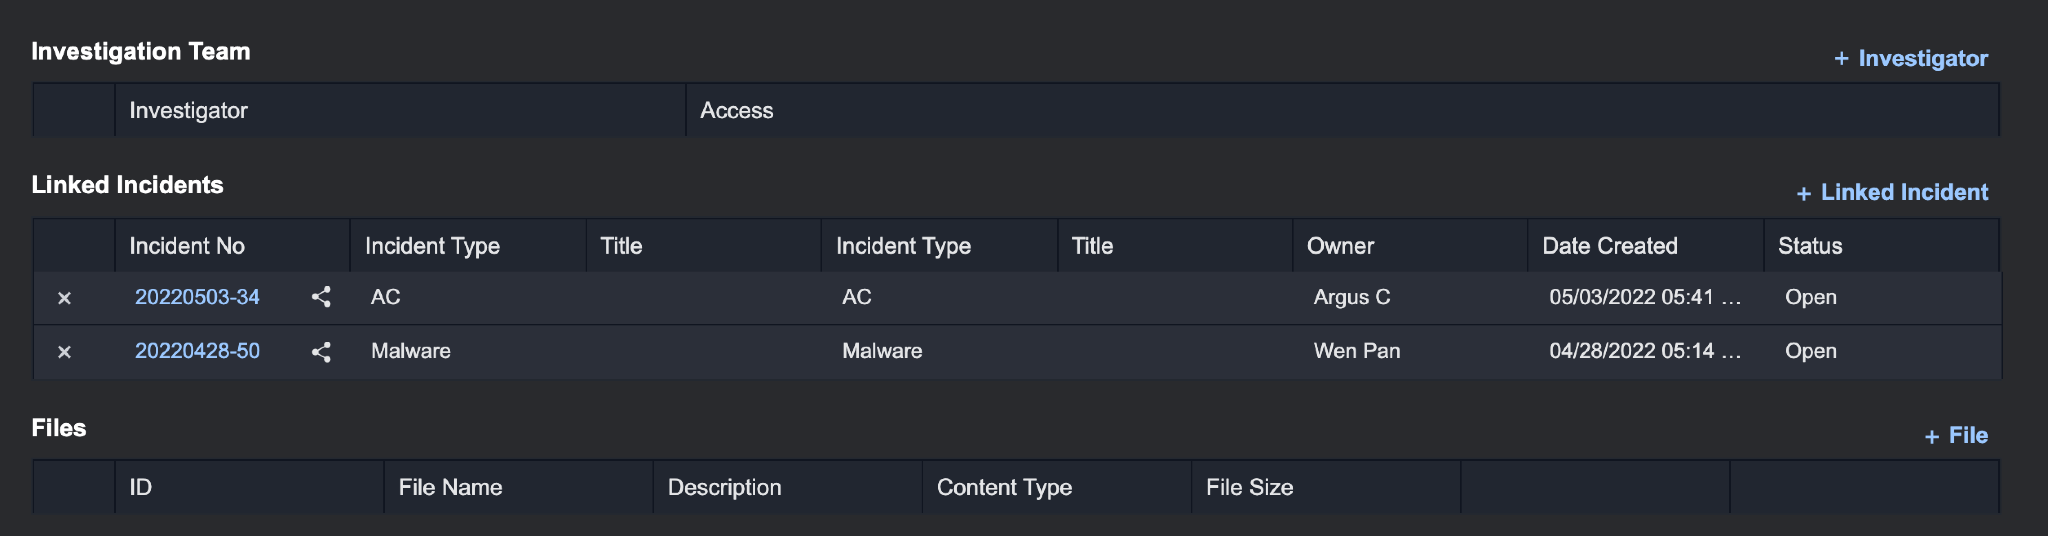
Result
The Linked Incident will be displayed in the corresponding Linked Incidents section.
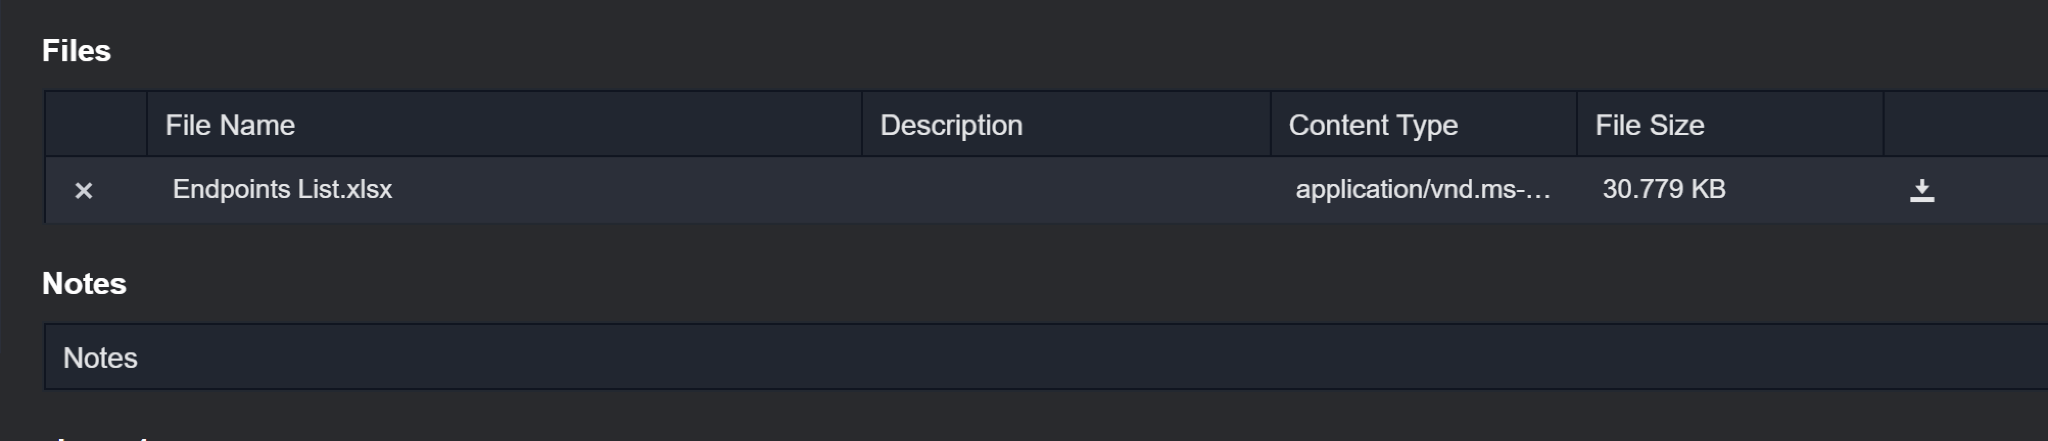
Incident Attachments/Files
You can also attach various important files to your Incident such as PDFs, images, etc.
To attach files:
Click on + File.
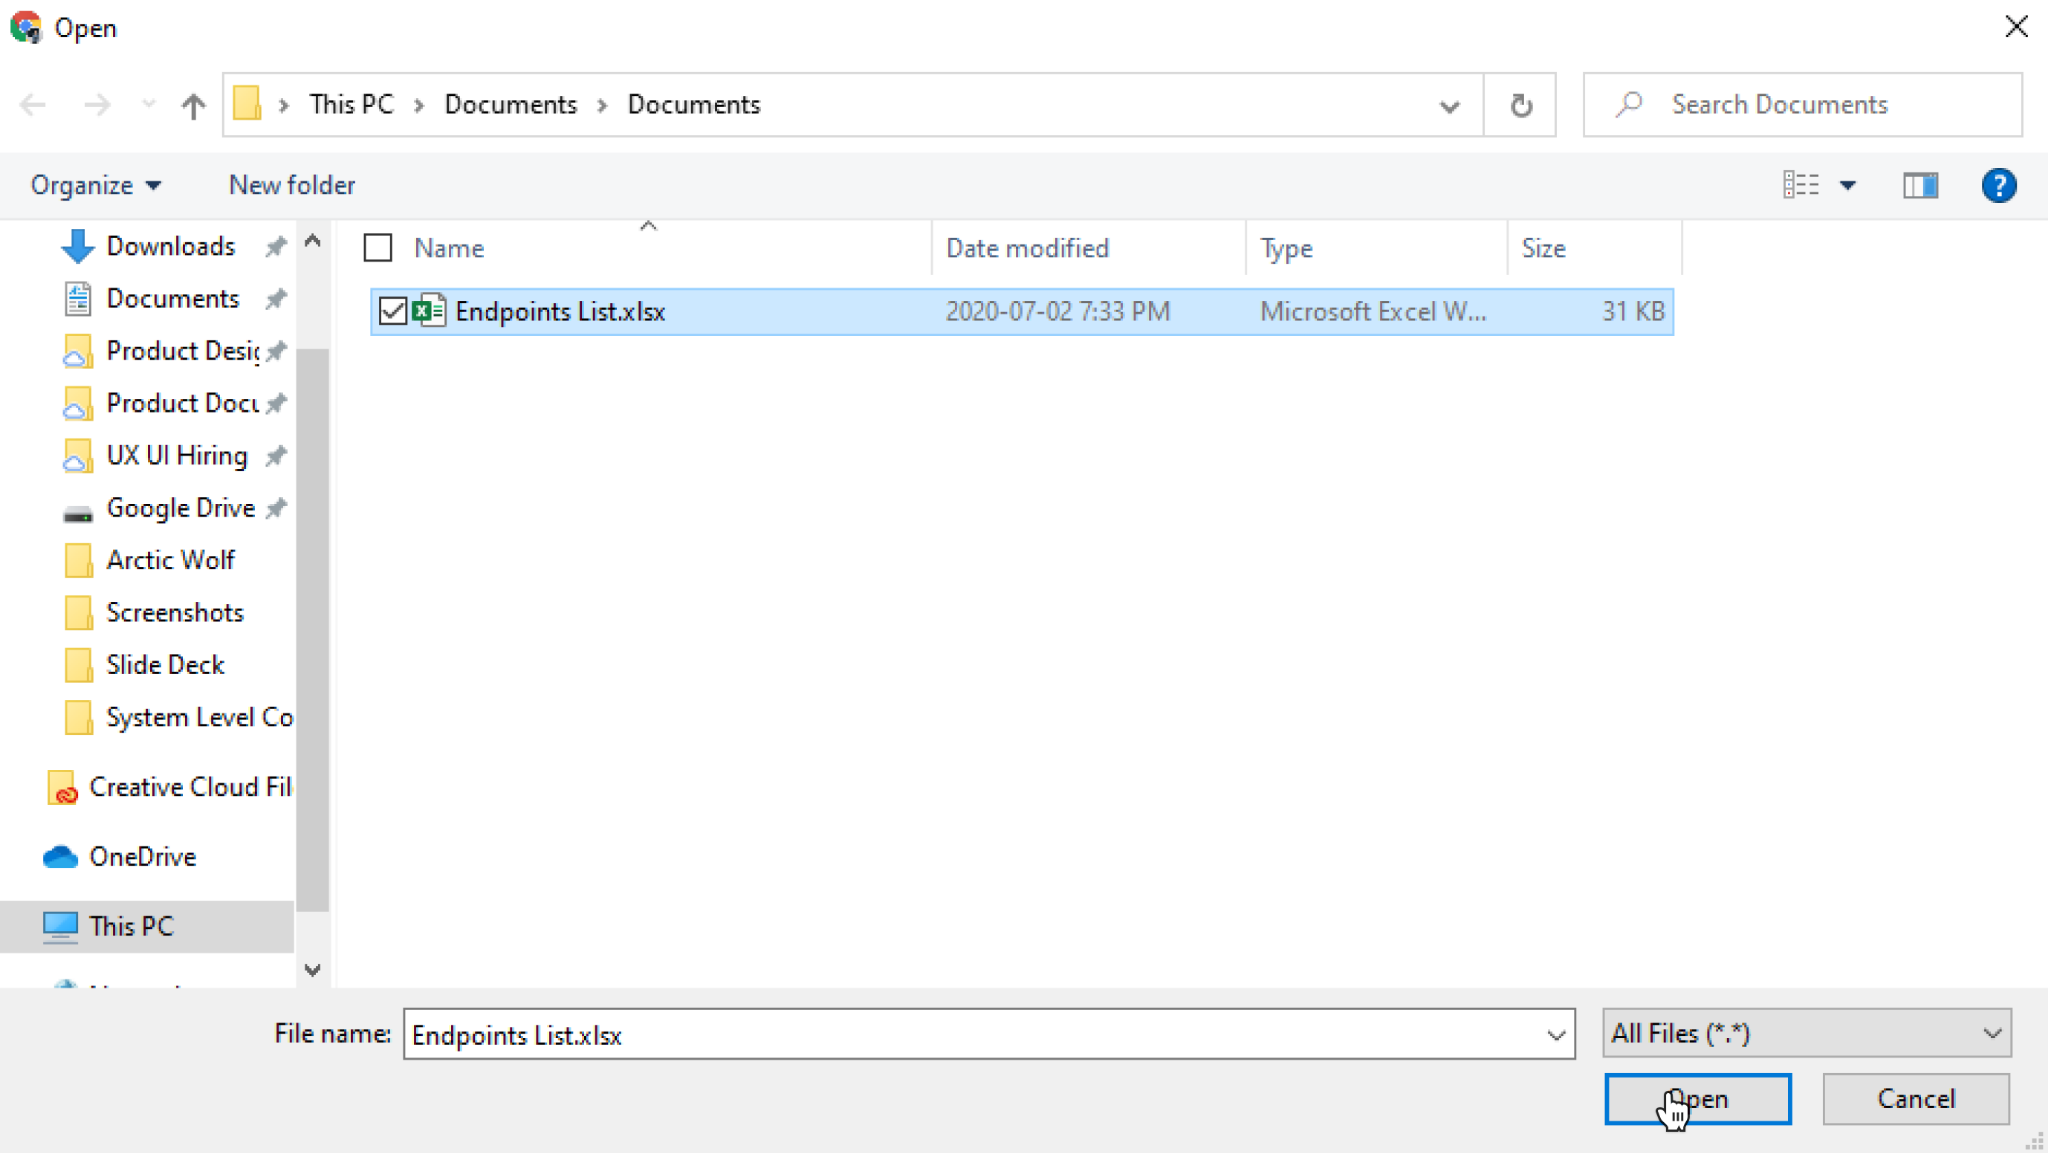
Click on Select Files.
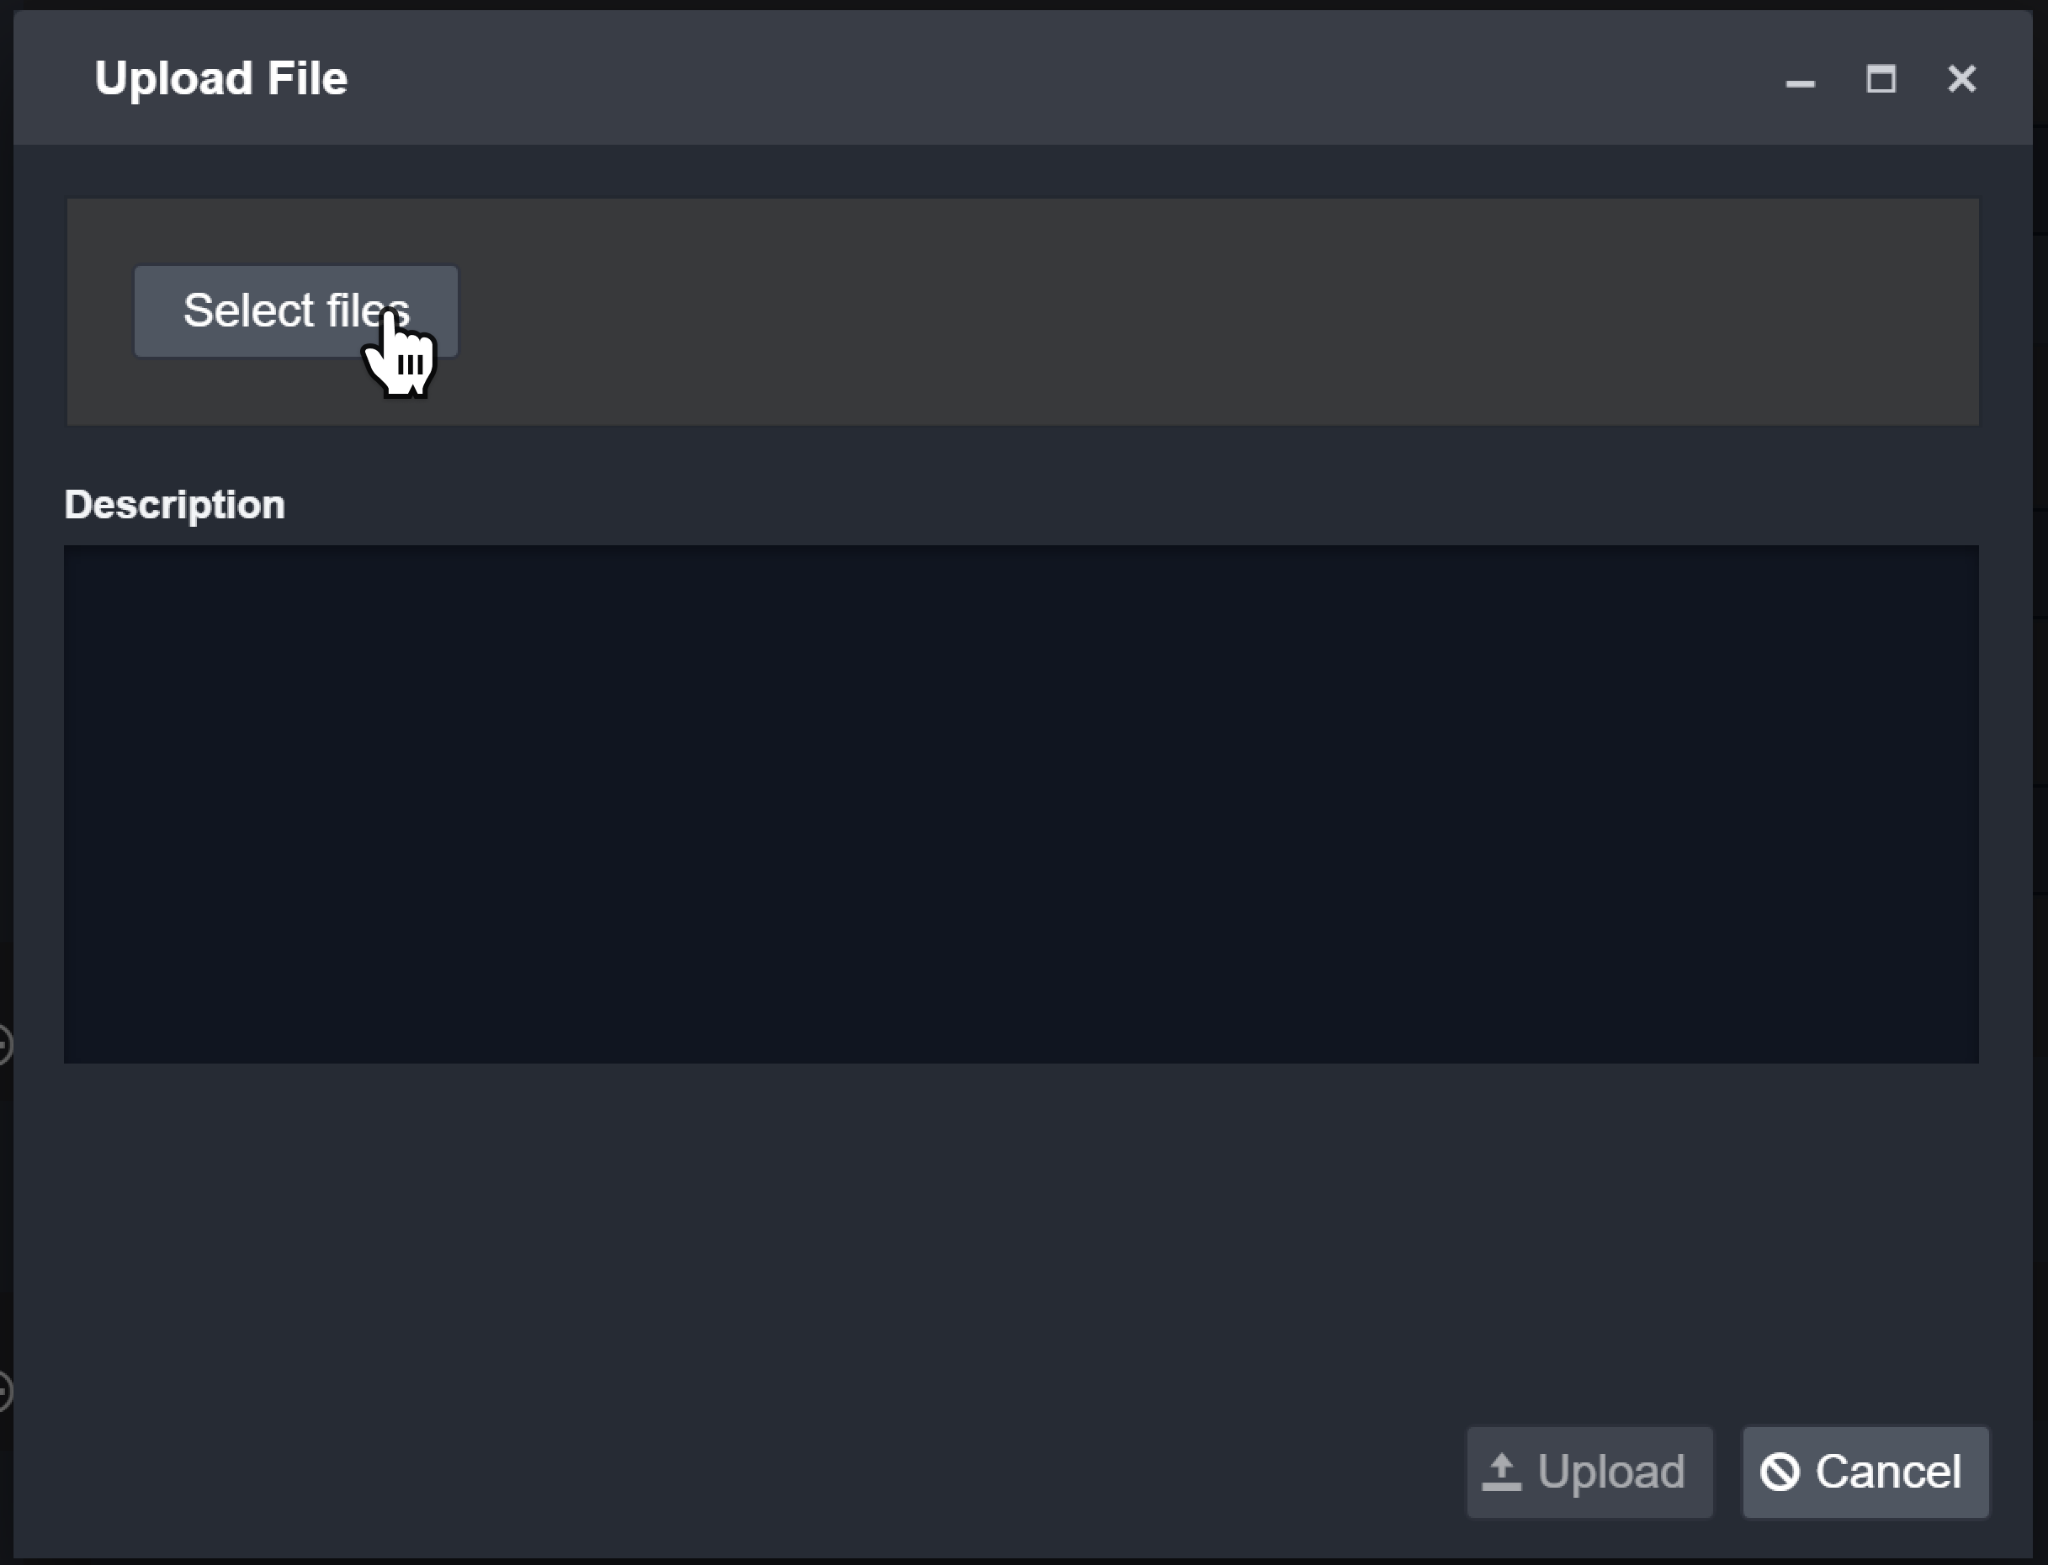
Choose the file to attach and click Open.
(Optional) Enter a description for the attachment.
Click Upload to add the attachment.
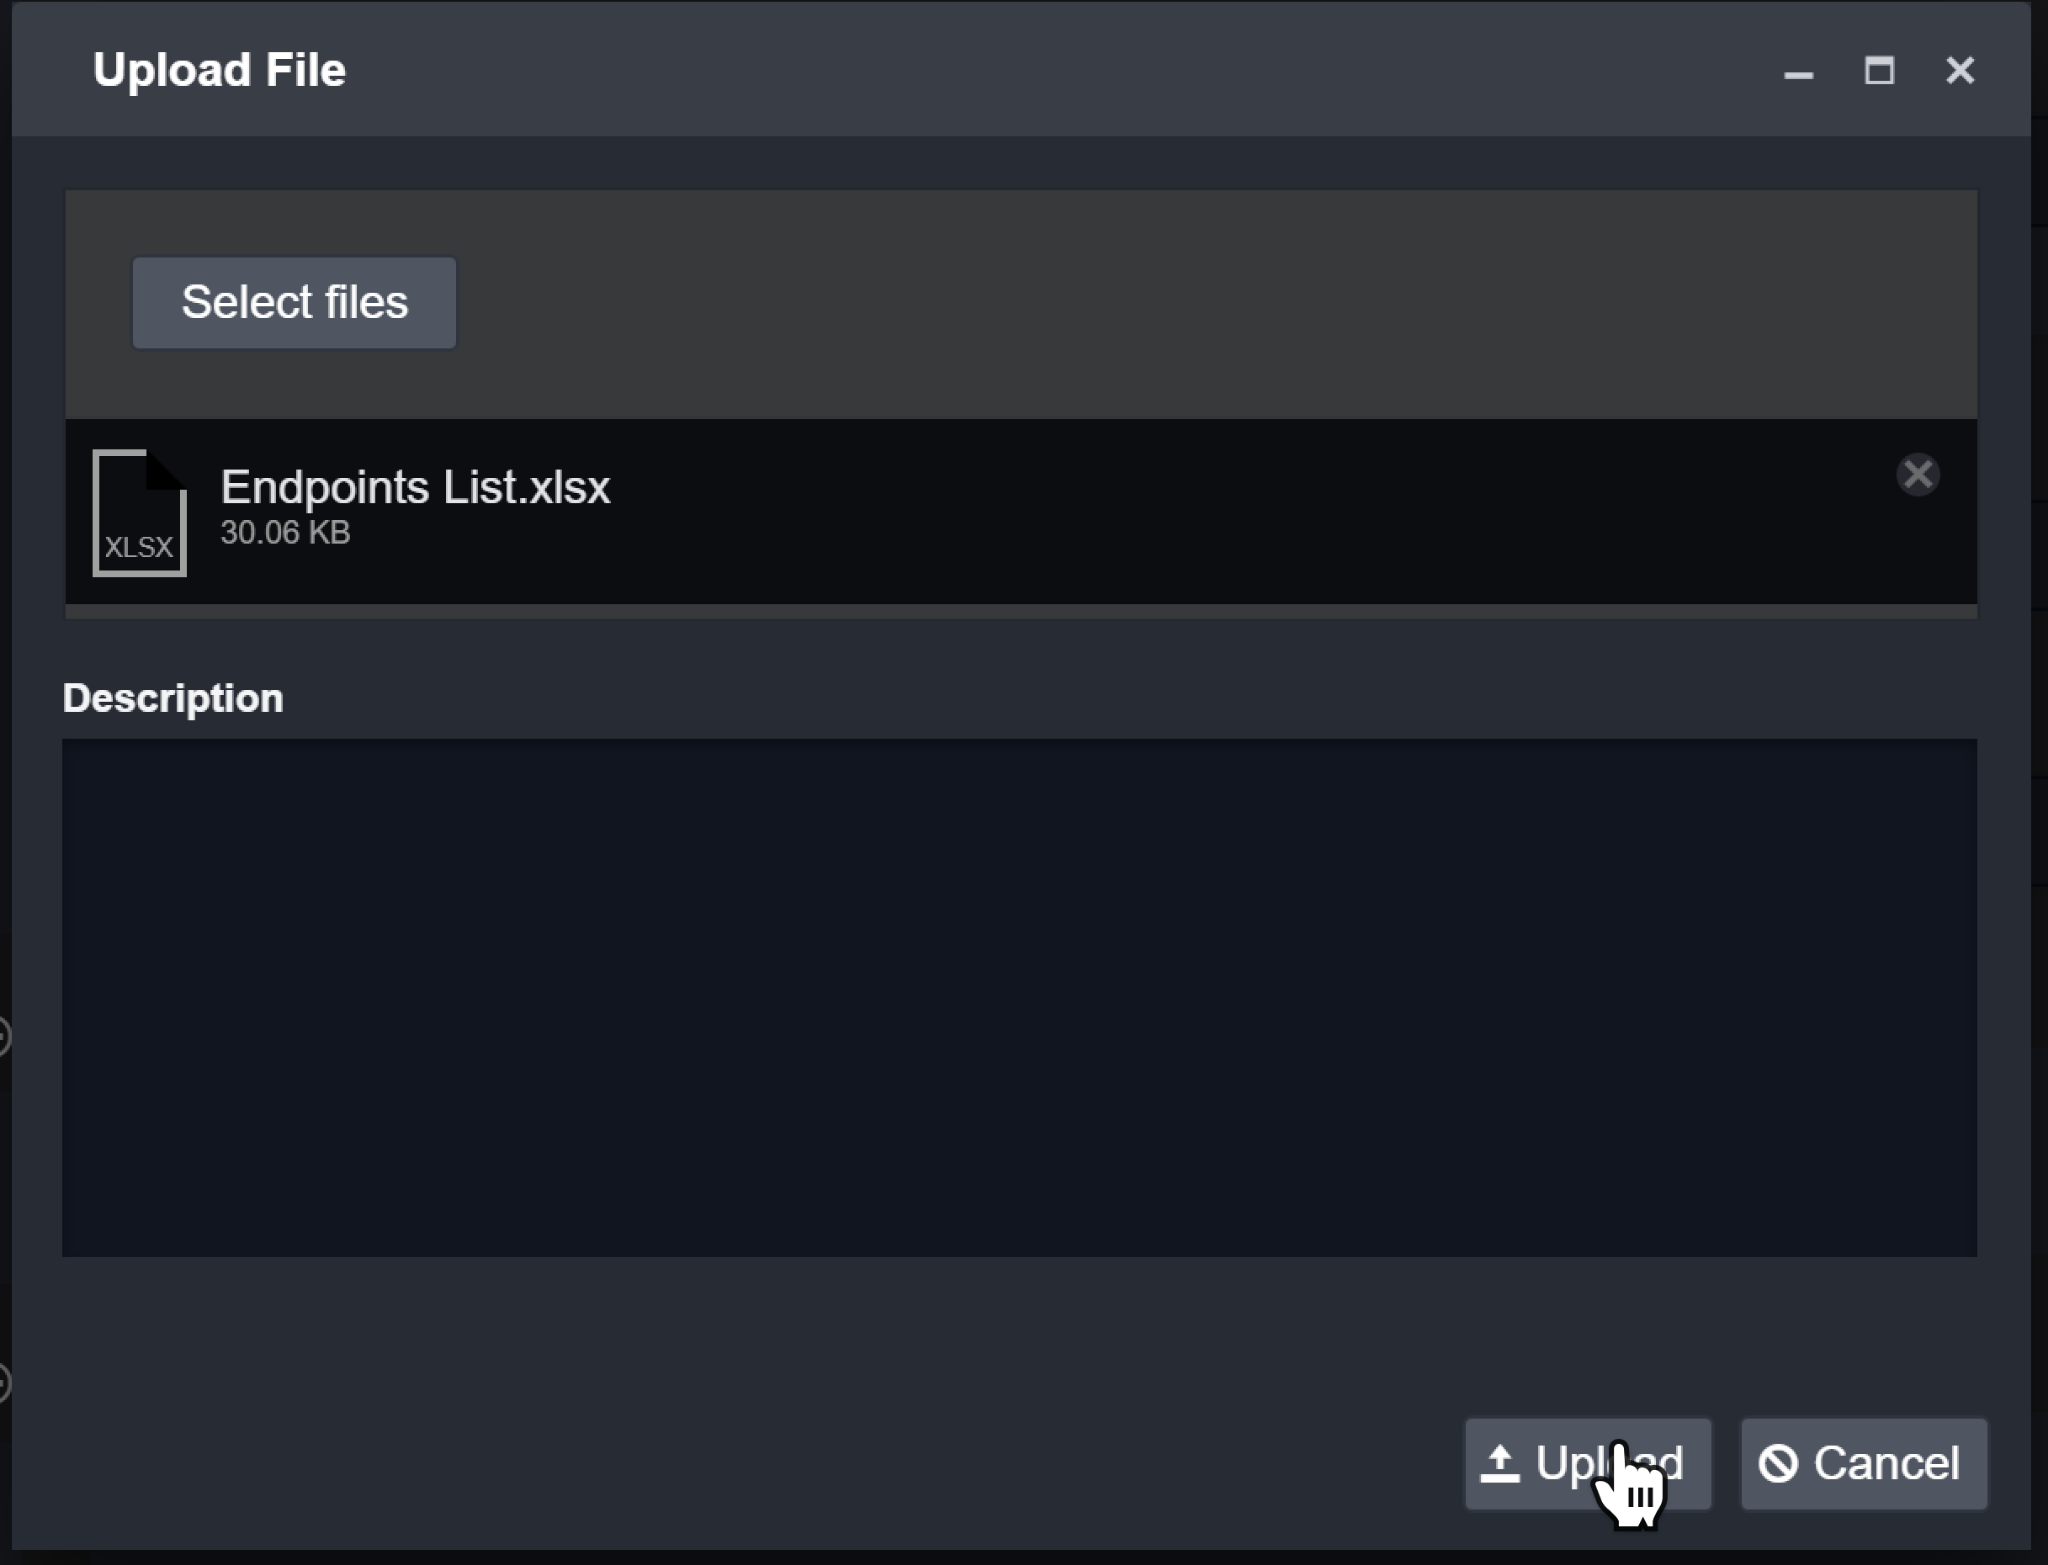
Result
The file will be listed in the Files section.
Reader Note
There are restrictions on certain file types for security reasons. Prohibited file extensions include .dll, .exe, .com, .msi, .bat, .aspx, .ashx, .bin, .msp, .rar, .zip, .jar, .cmd, .vbs, .js, and .inf.
Custom Sections in Incidents
The custom sections in the incident workspace are the user-defined sections created in the Incident Form Editor. The name of the form corresponds to an incident type in D3 SOAR, and each incident type has its own set of sections. For more information on how to create, edit, and delete an incident form, please refer to Incident Form Editor.
Create an Ad Hoc Task
Inside of the Incident Workspace, you can create an Ad Hoc task for that incident, outside of the playbook. The ad hoc task allows the user freedom to name the task, categorize by task type, add task details, assign a user and due date.
For example, the ad hoc task allows a tier 3 analyst to assign a tier 1 security analyst to perform an action on the incident for investigation. This allows for SOC teams to divide up resources and communicate task needs between different security personnel regarding an incident.
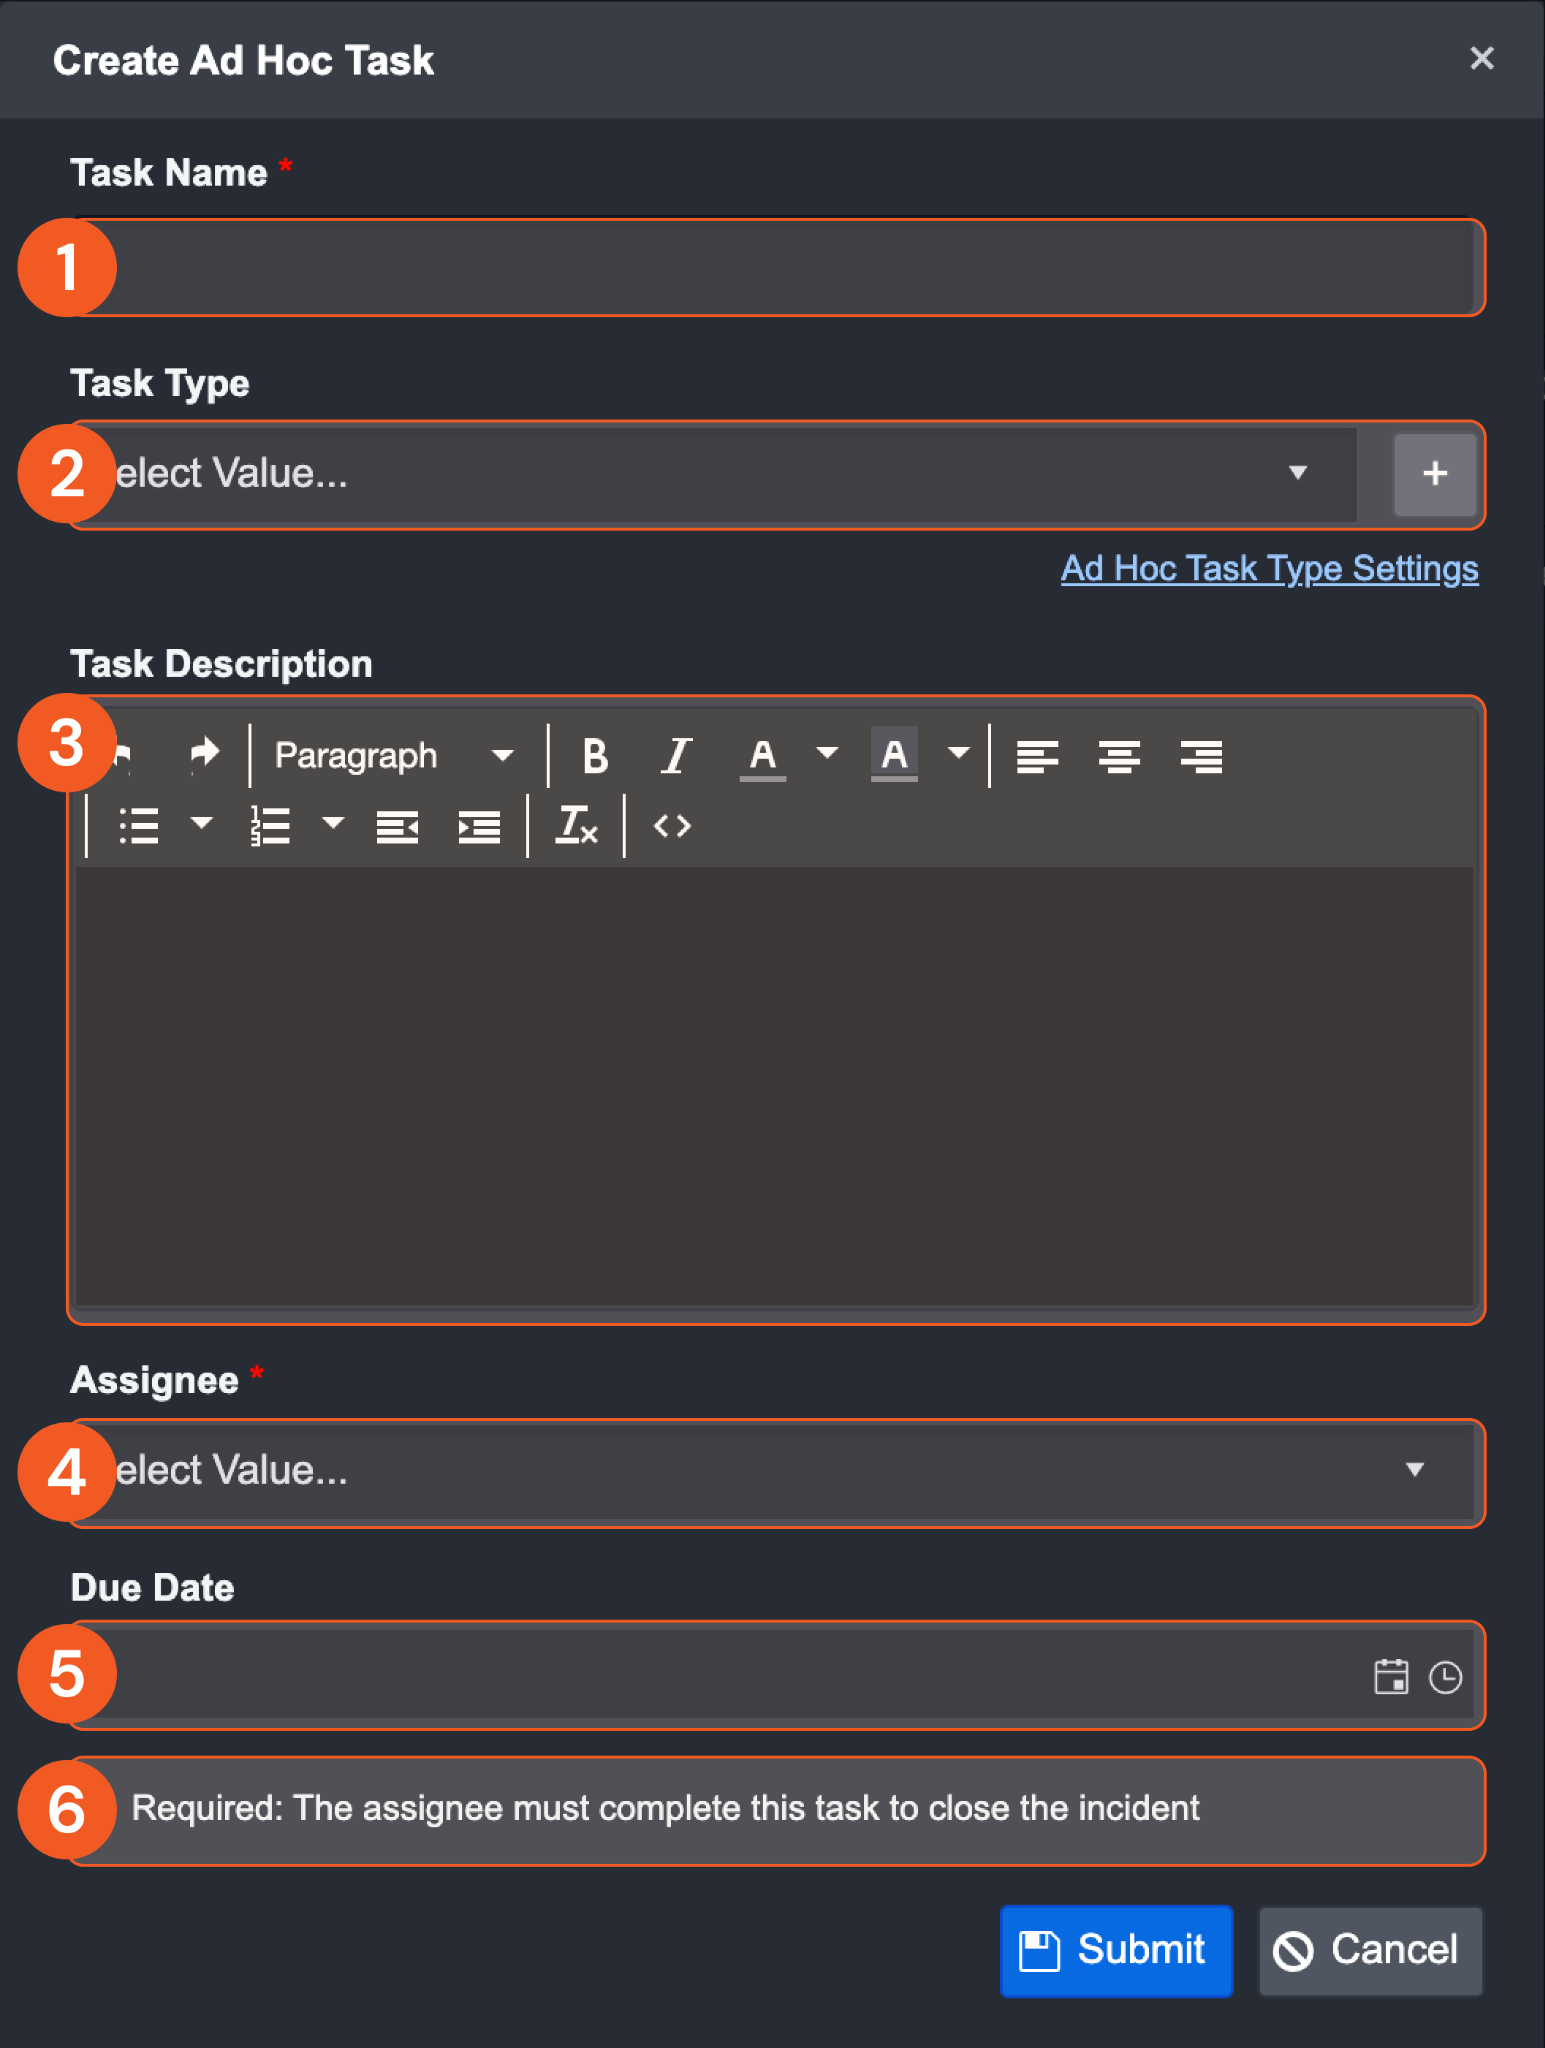
Task Name—Give your task a relevant name
Task Type—Categorize the task into a relevant type. You can quick-add a new task type with the + button or view and edit a list of existing task types. Additional task types can be configured inside of Application Settings.
Task Description—Give your task details about what is to be done or performed. This text input box supports HTML.
Assignee—Assign your task to a user you wish to perform this task.
Due Date—Give the task a due date if applicable.
Required—Check this box to make the task required upon closing the incident.
Reader Note
In order to assign a user to this task, that user must have access to the incident workspace and this specific incident
Once the ad hoc task is created, it will be displayed in the Pending Tasks and Command Centre, detailed below in the Pending tasks and Command centre sections.
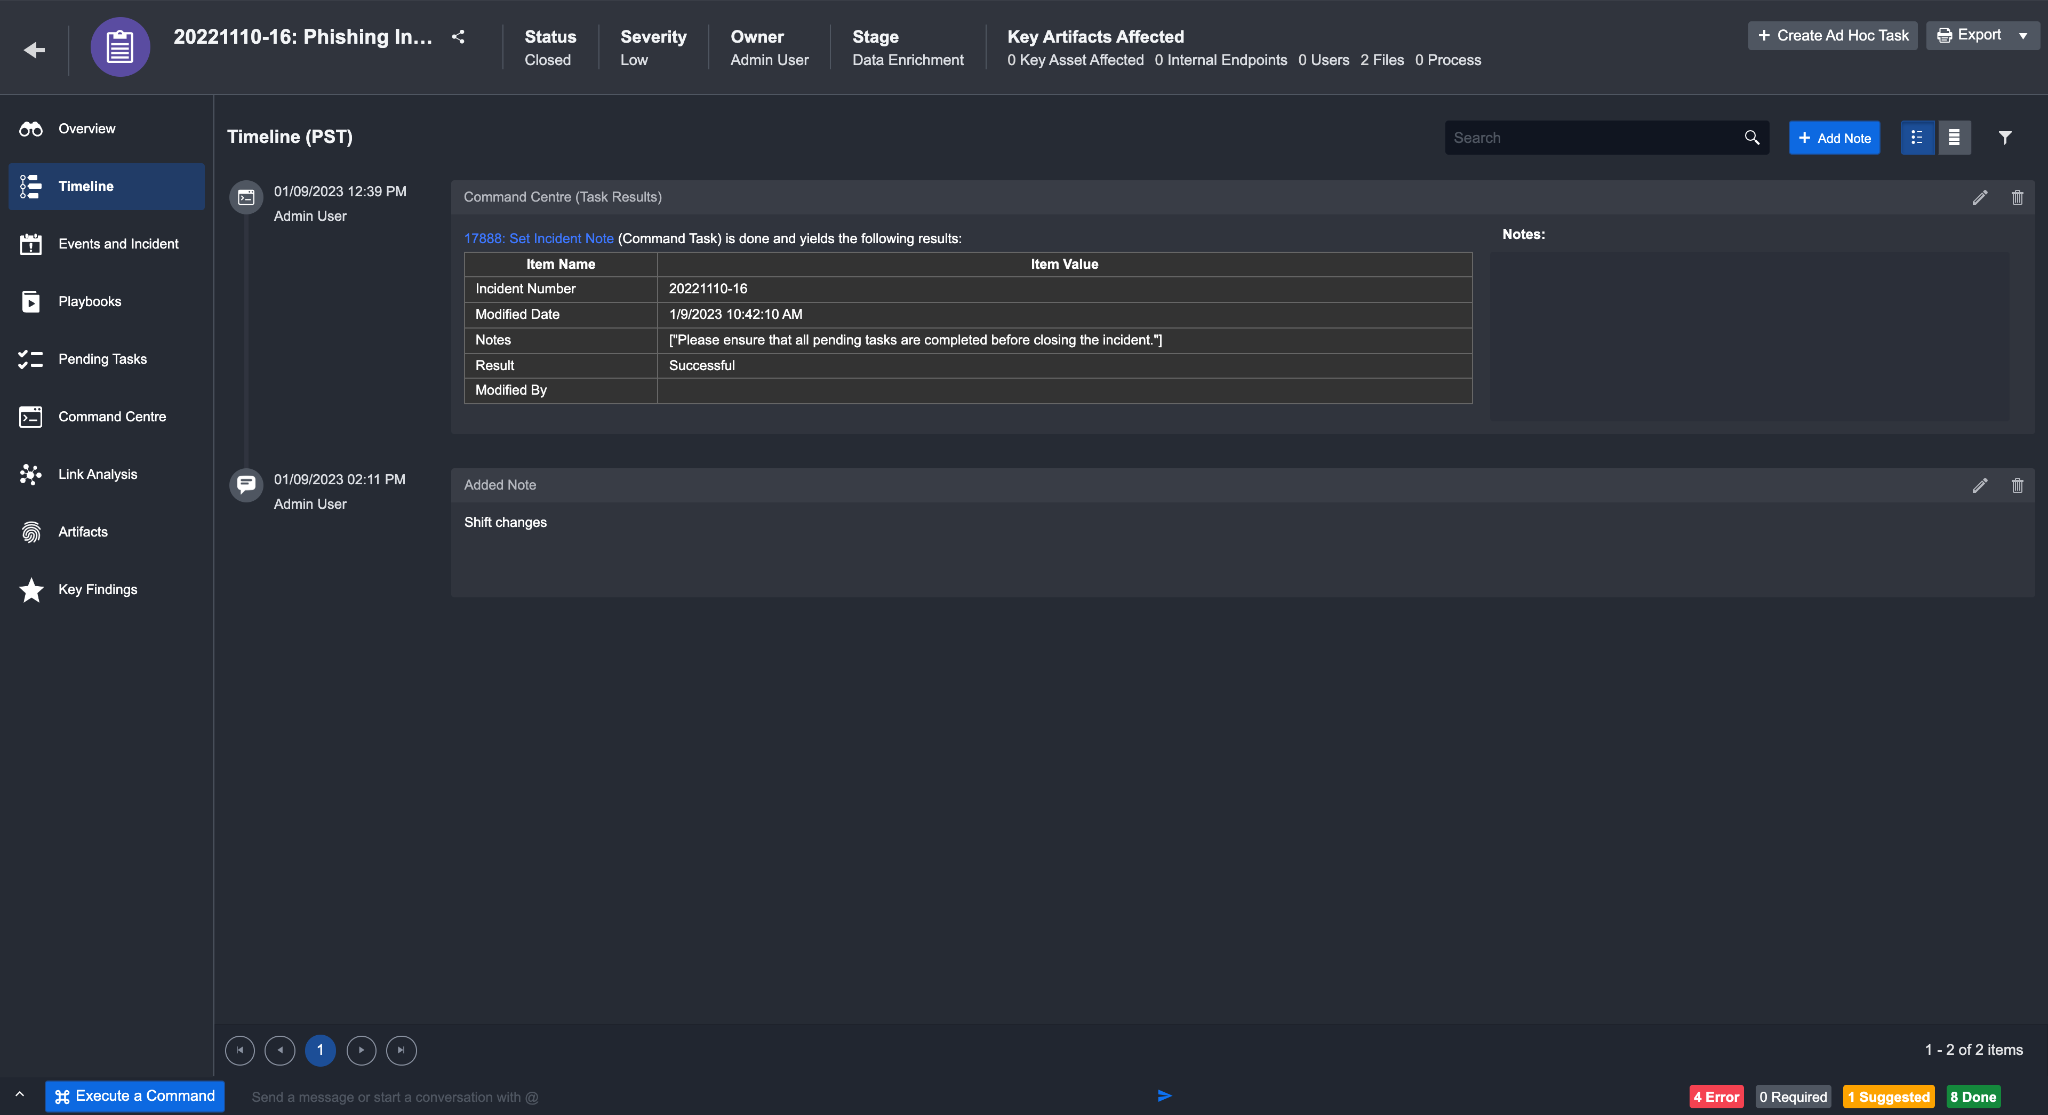
Timeline Tab
The timeline feature within the incident workspace allows you to add investigation details and order them chronologically to visualize the lifecycle of the incident. You may add details from the command centre or related events and incidents, or create your own custom supplementary notes.
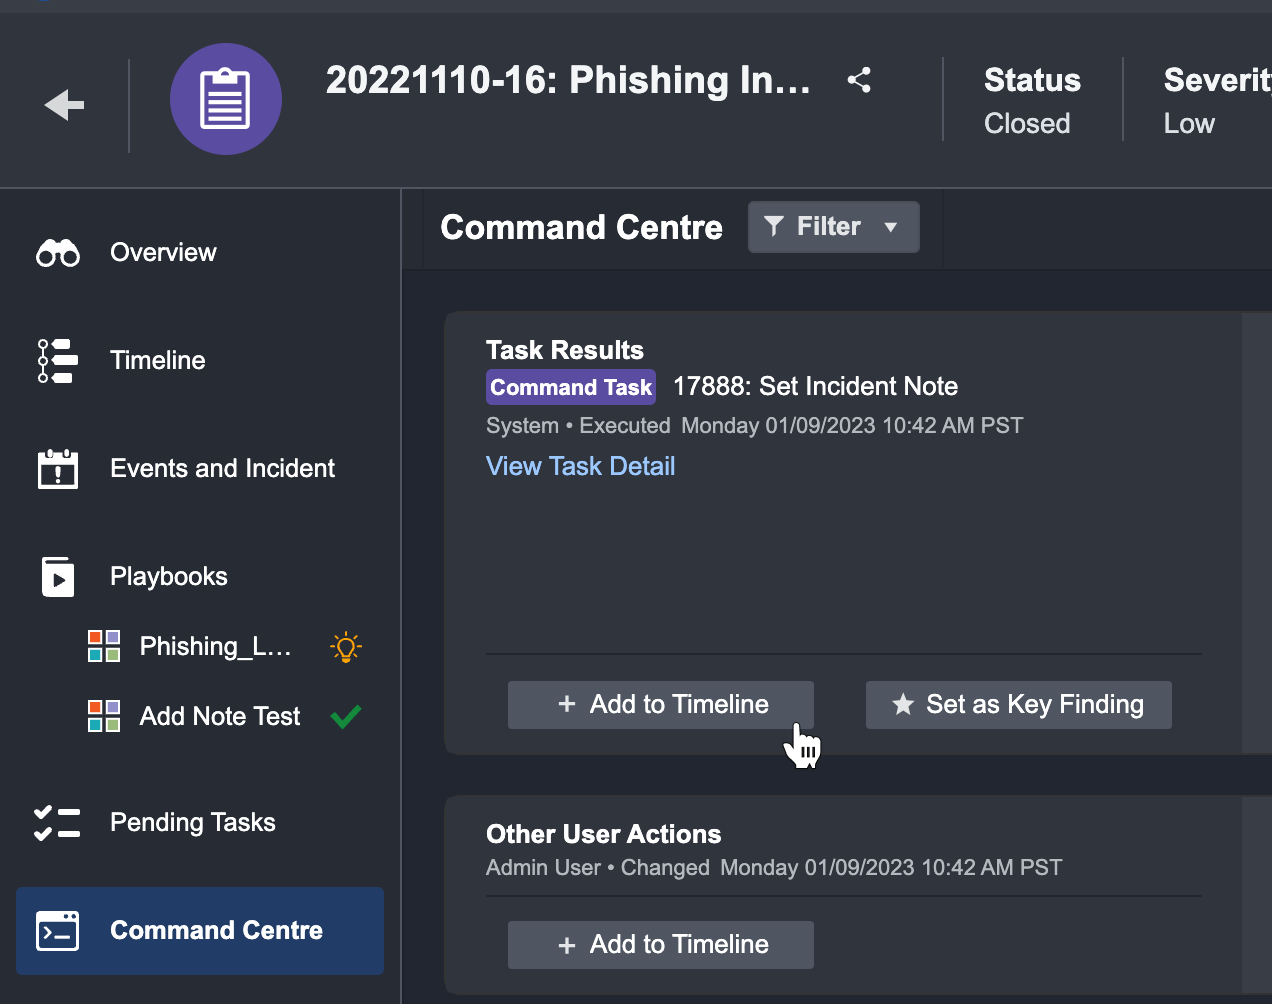
Adding items from the command center
Navigate to the command center in the investigation dashboard
Look for an item that may be important to the investigation (such as a task result) and click + Add to Timeline
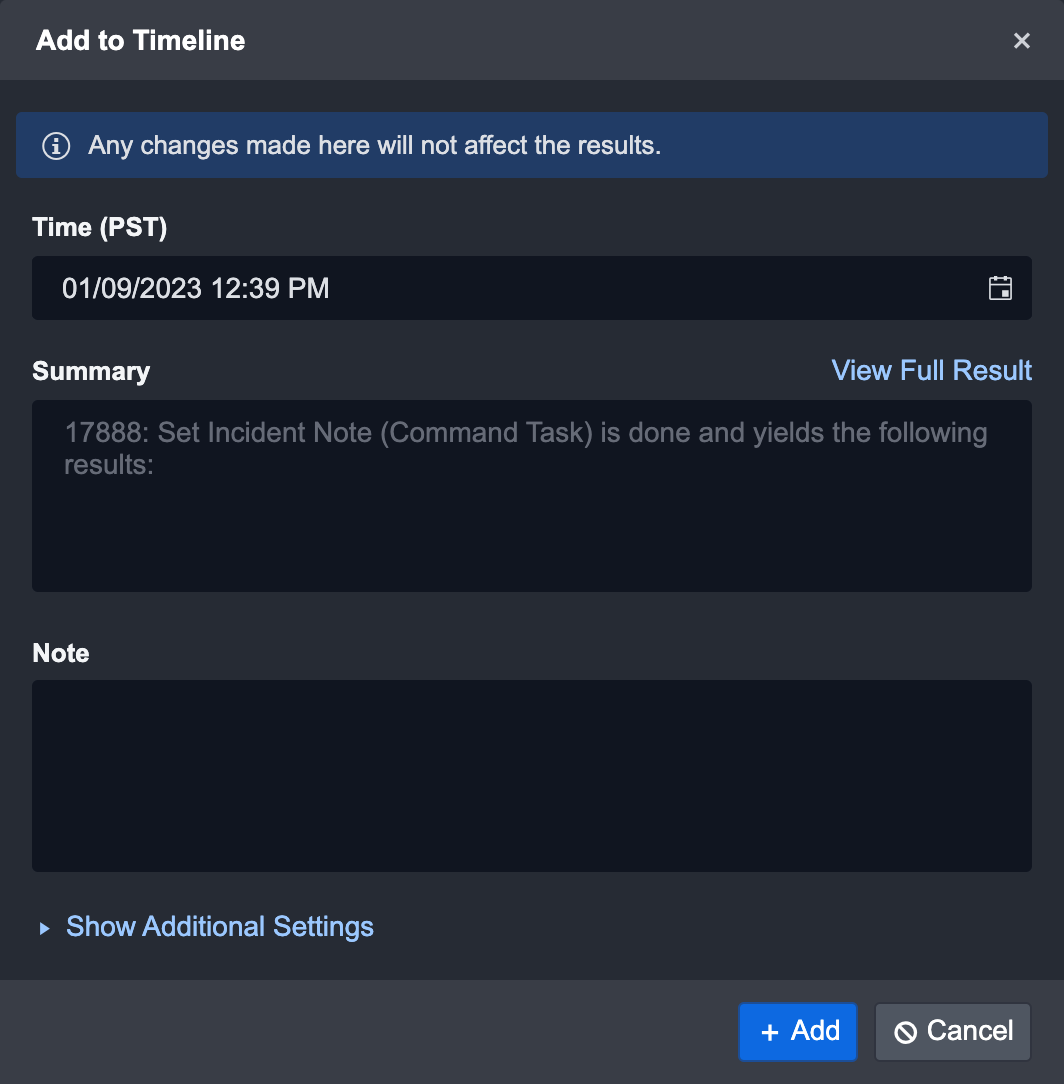
A window will appear to allow you to review the details of the item you wish to add to the timeline.
The default time assigned to this item will be the current time, not the time of execution. This can be manually adjusted as needed.
Click + Add to add the item.
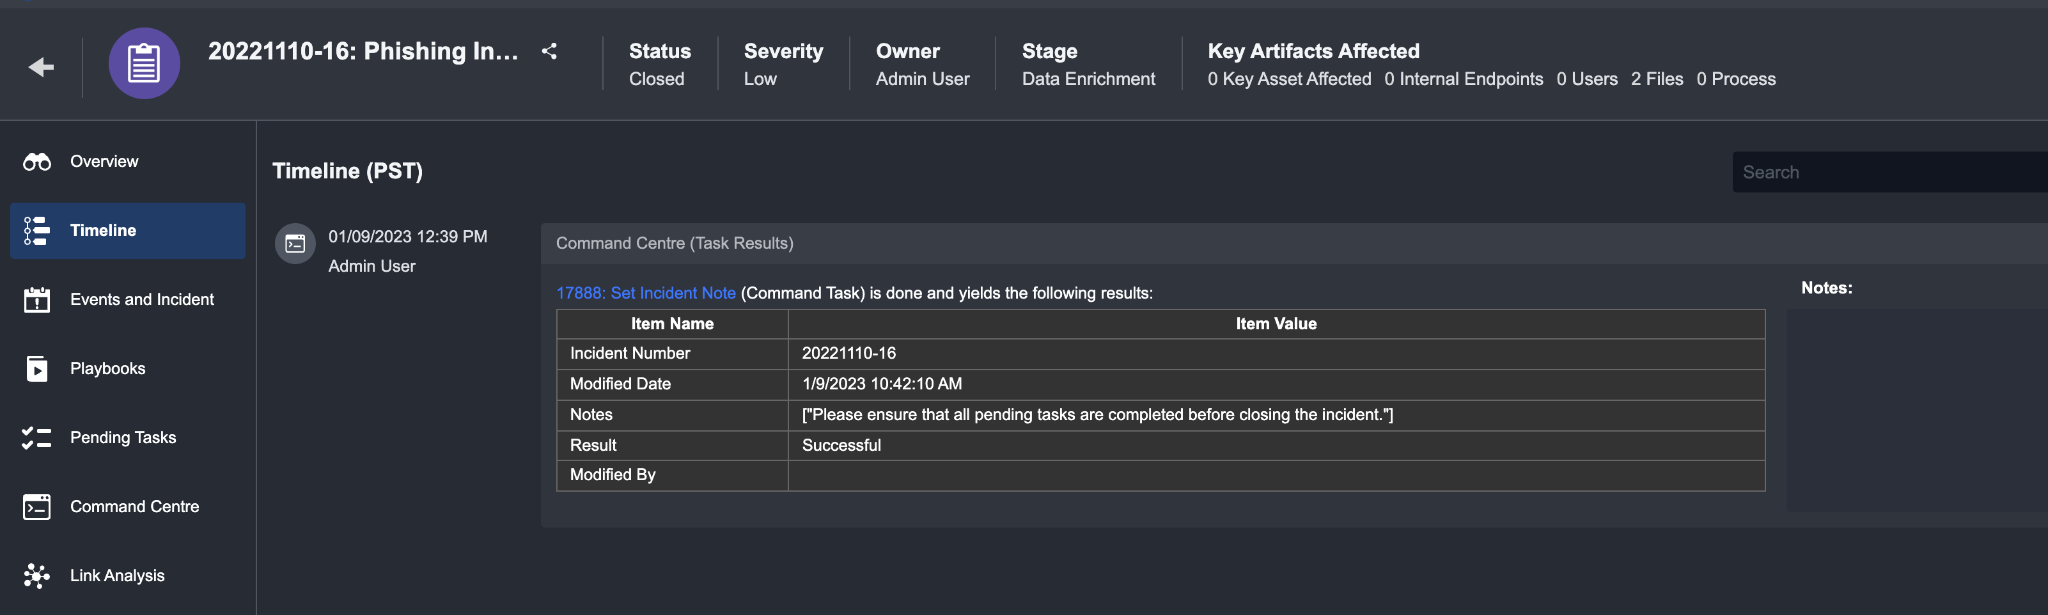
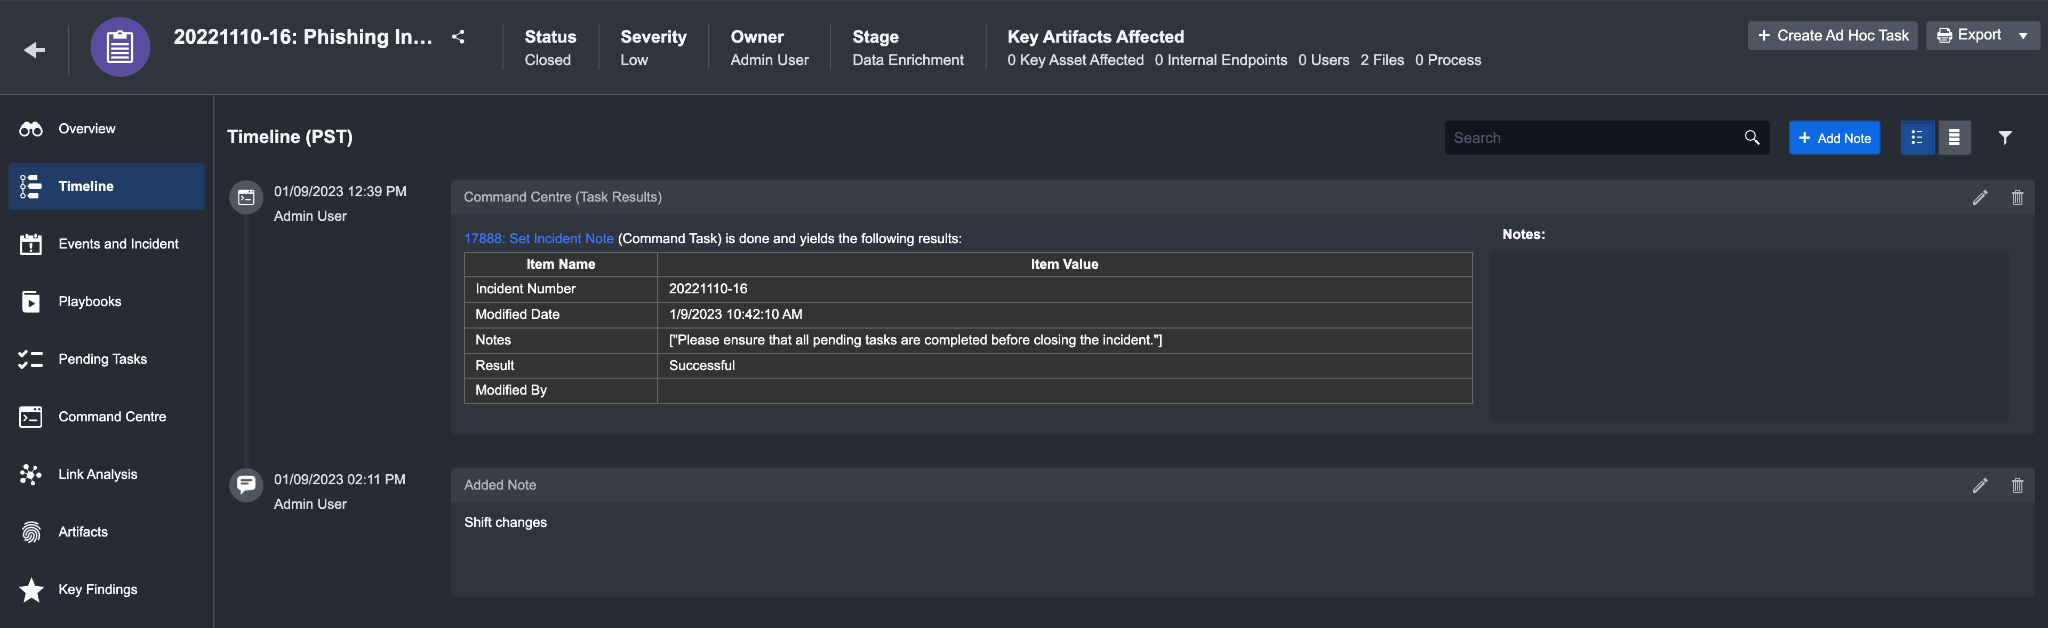
Result
The item you have added will appear in the timeline tab.
Adding items manually
Navigate to the top right corner of the timeline tab and click + Add Note
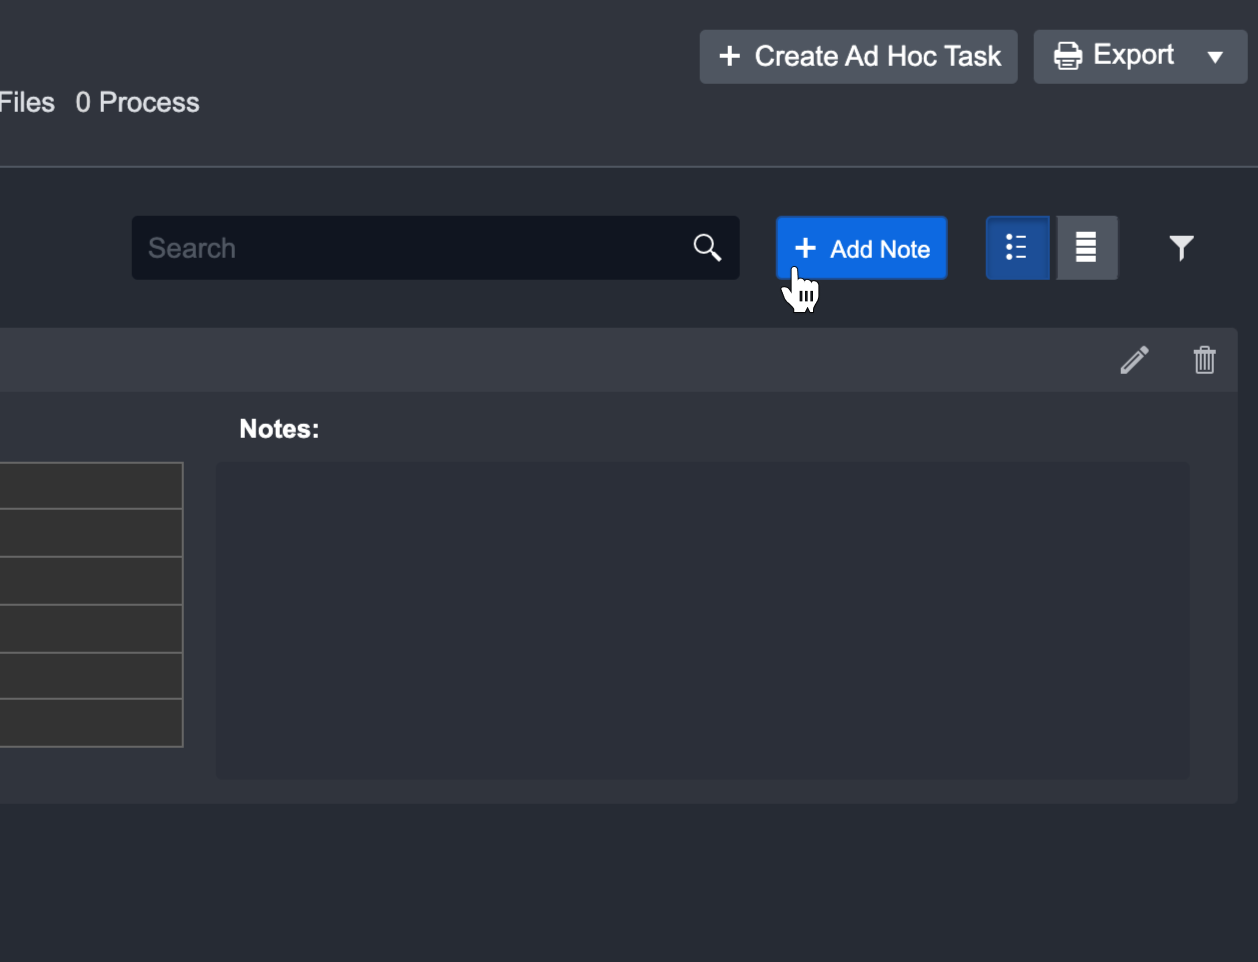
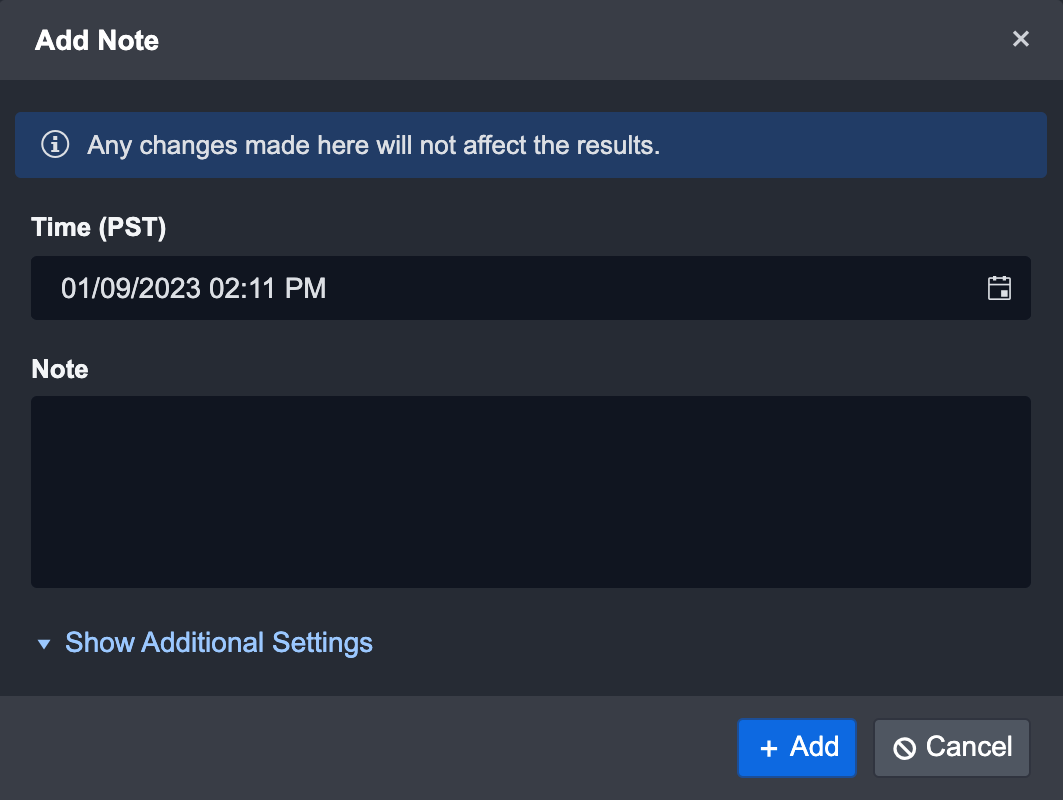
Fill in the details of the note you wish to add to the timeline.
By default, the time will be the current time. You may change this as needed.
Click + Add to add the note.
Result
Your note will be added to the end of the timeline.
Events and Incidents Tab
The Events and Incidents tab consists of Event List and Incident.
Event List
The Event List view shows a comprehensive list of all related events for this incident. In this view, you can sort by clicking on each column to better organize events.
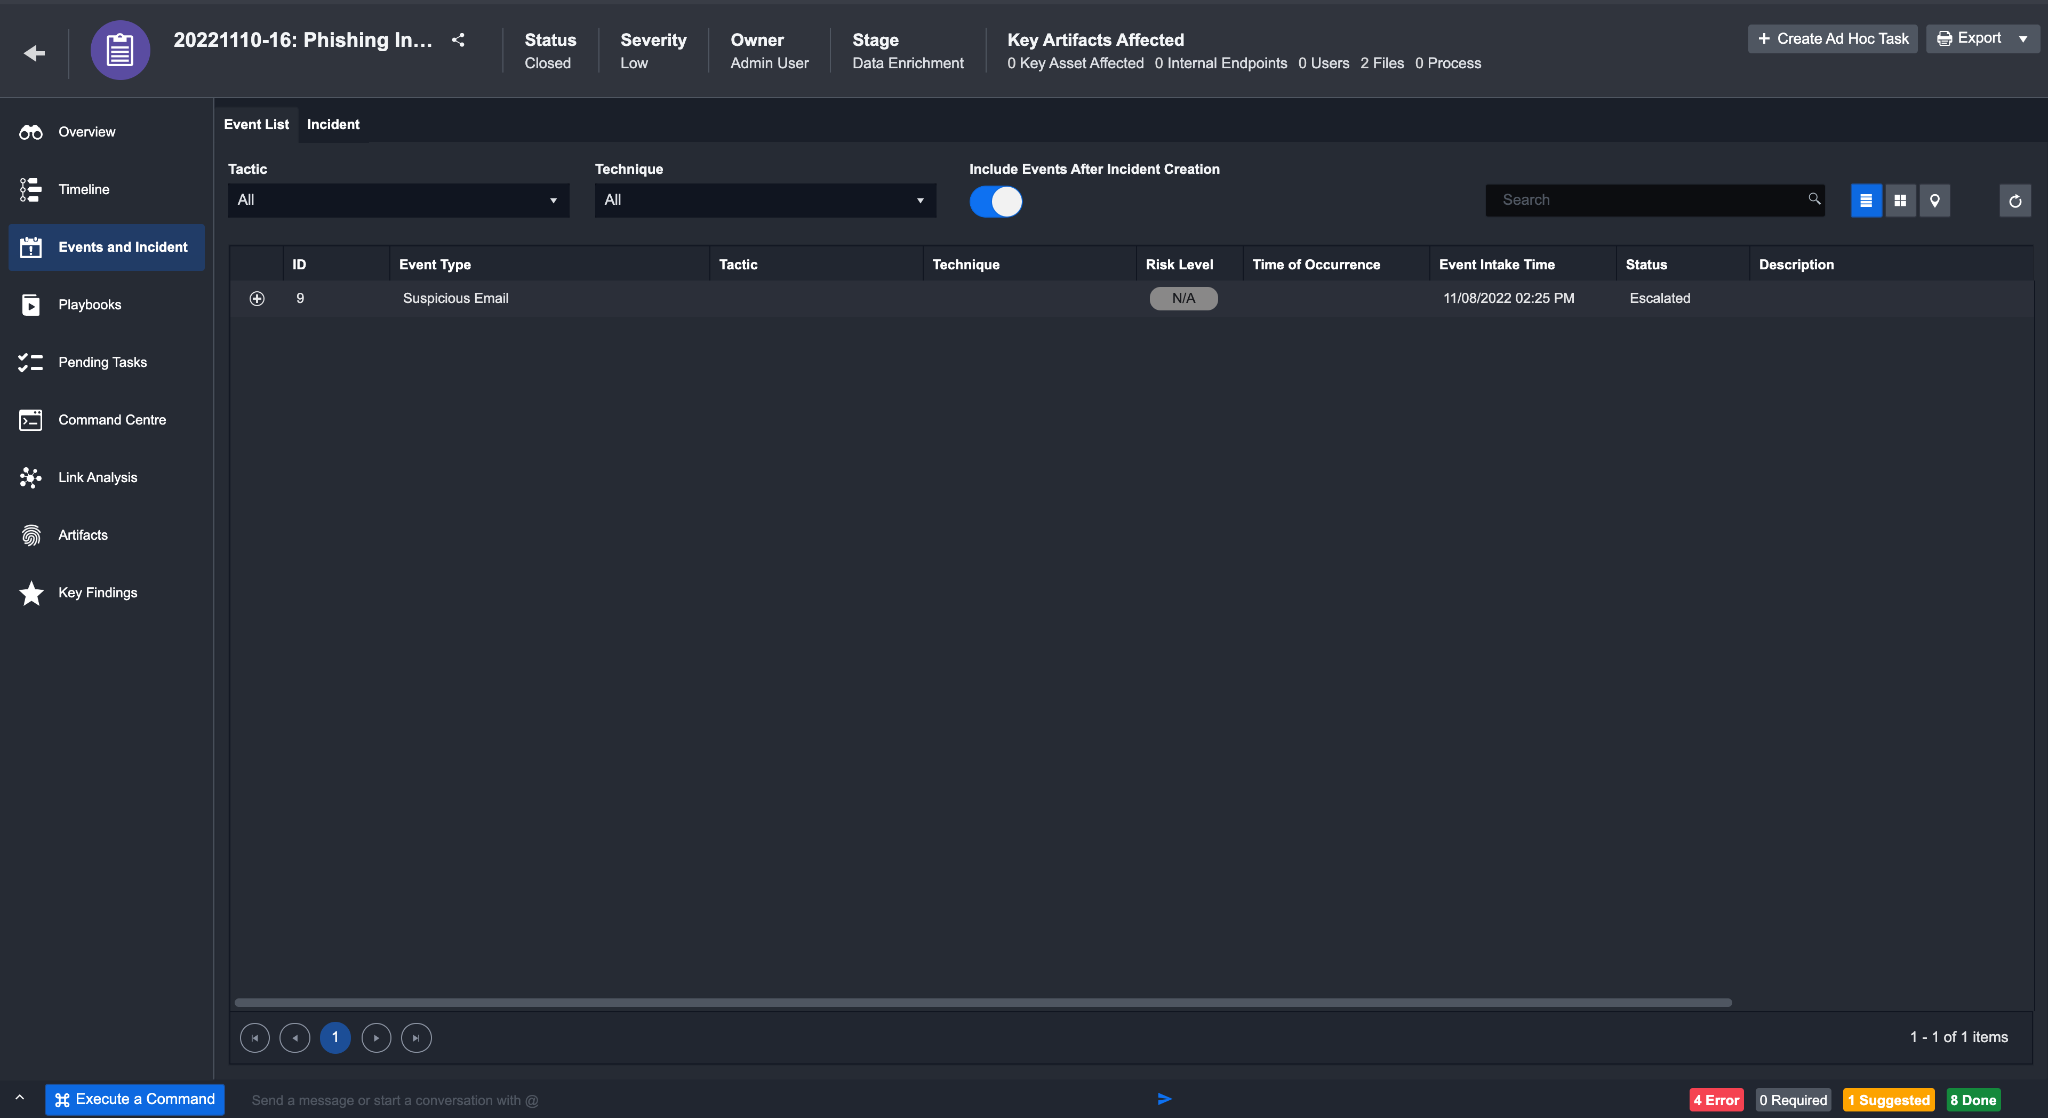
You can also sort the events by Tactics & Techniques and locations by clicking on the corresponding buttons in the top right area.
Incident
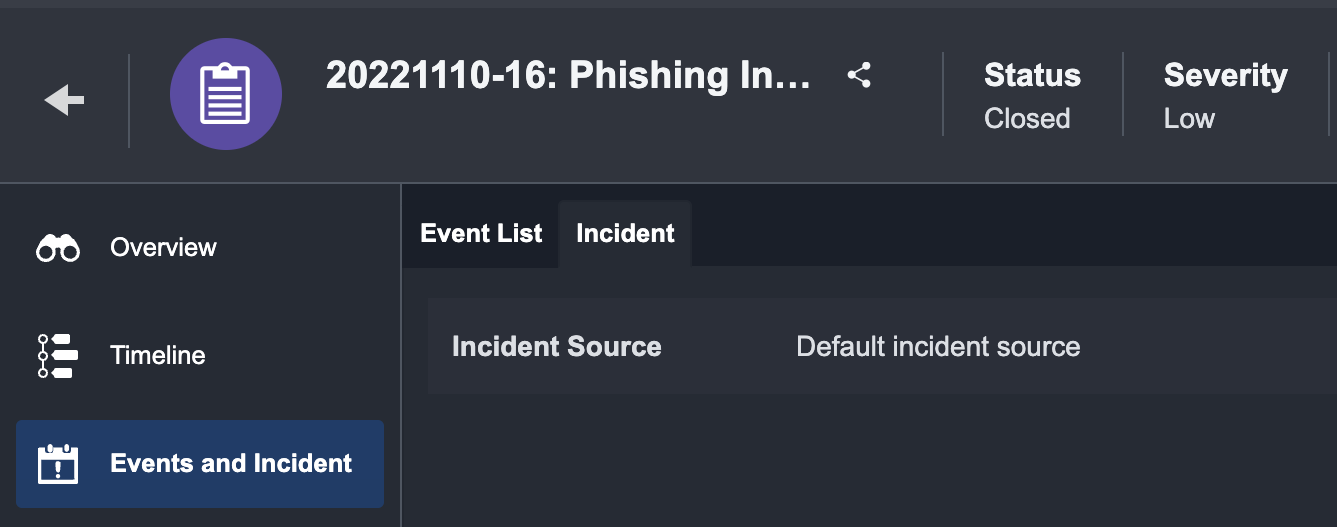
The Incident Section displays the name of the Incident Source and raw JSON data of the current incident. This allows you to determine whether the third-party events have been fetched correctly and if any revisions to their Incident field mapping is required.
If the incident is created from an escalated event, it will only display Default incident source. However, the escalated event raw data can be found under the event log tab in event details.
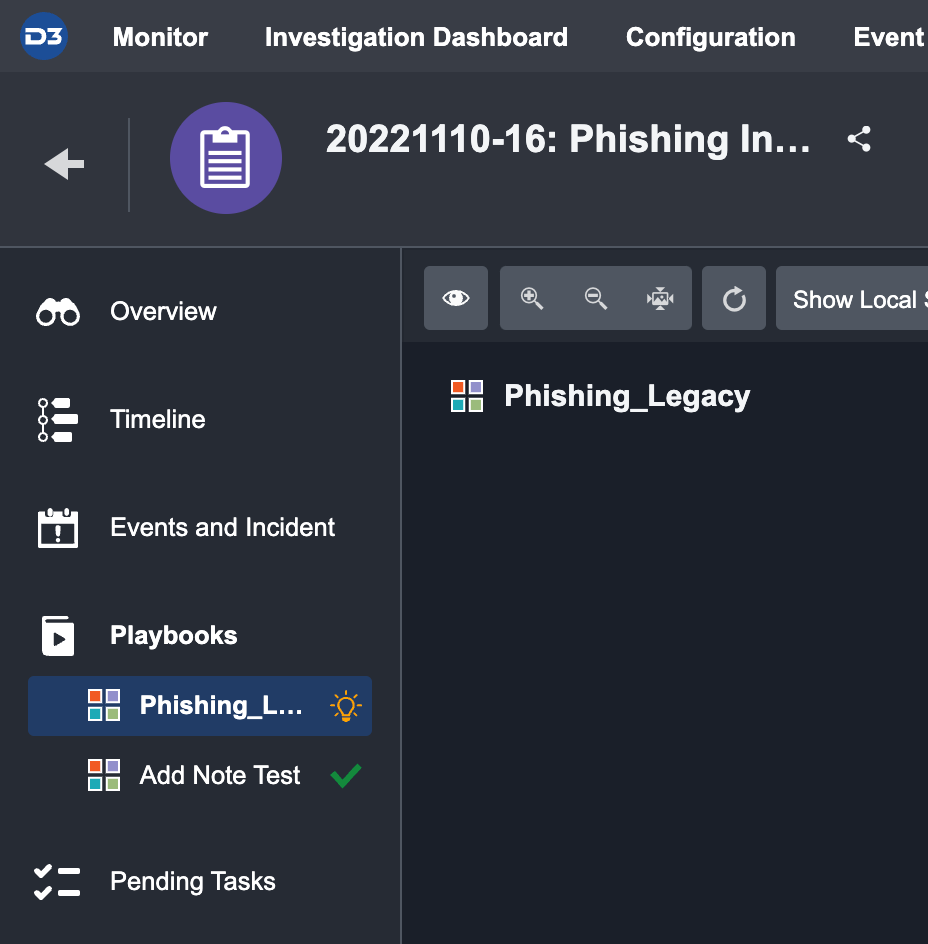
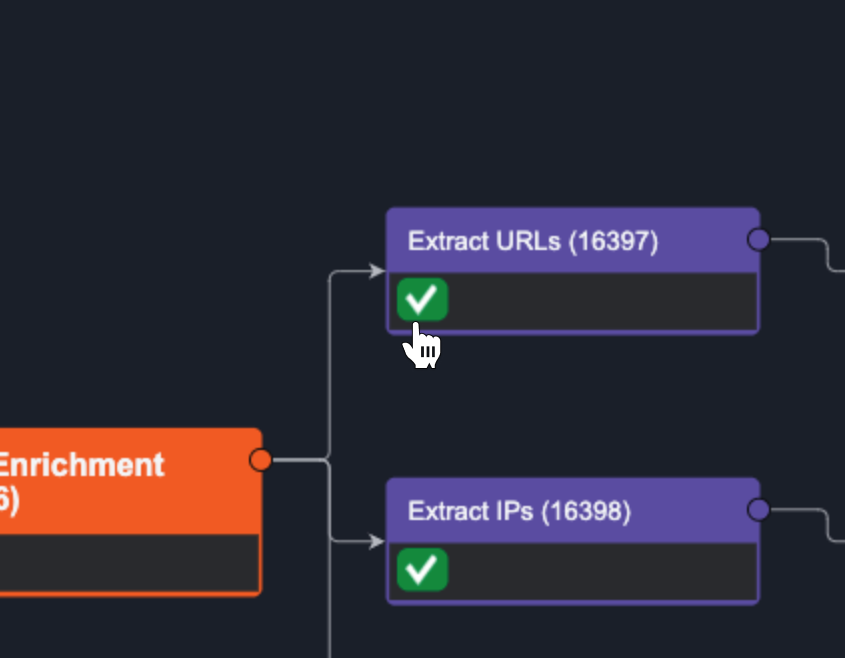
Playbooks Tab
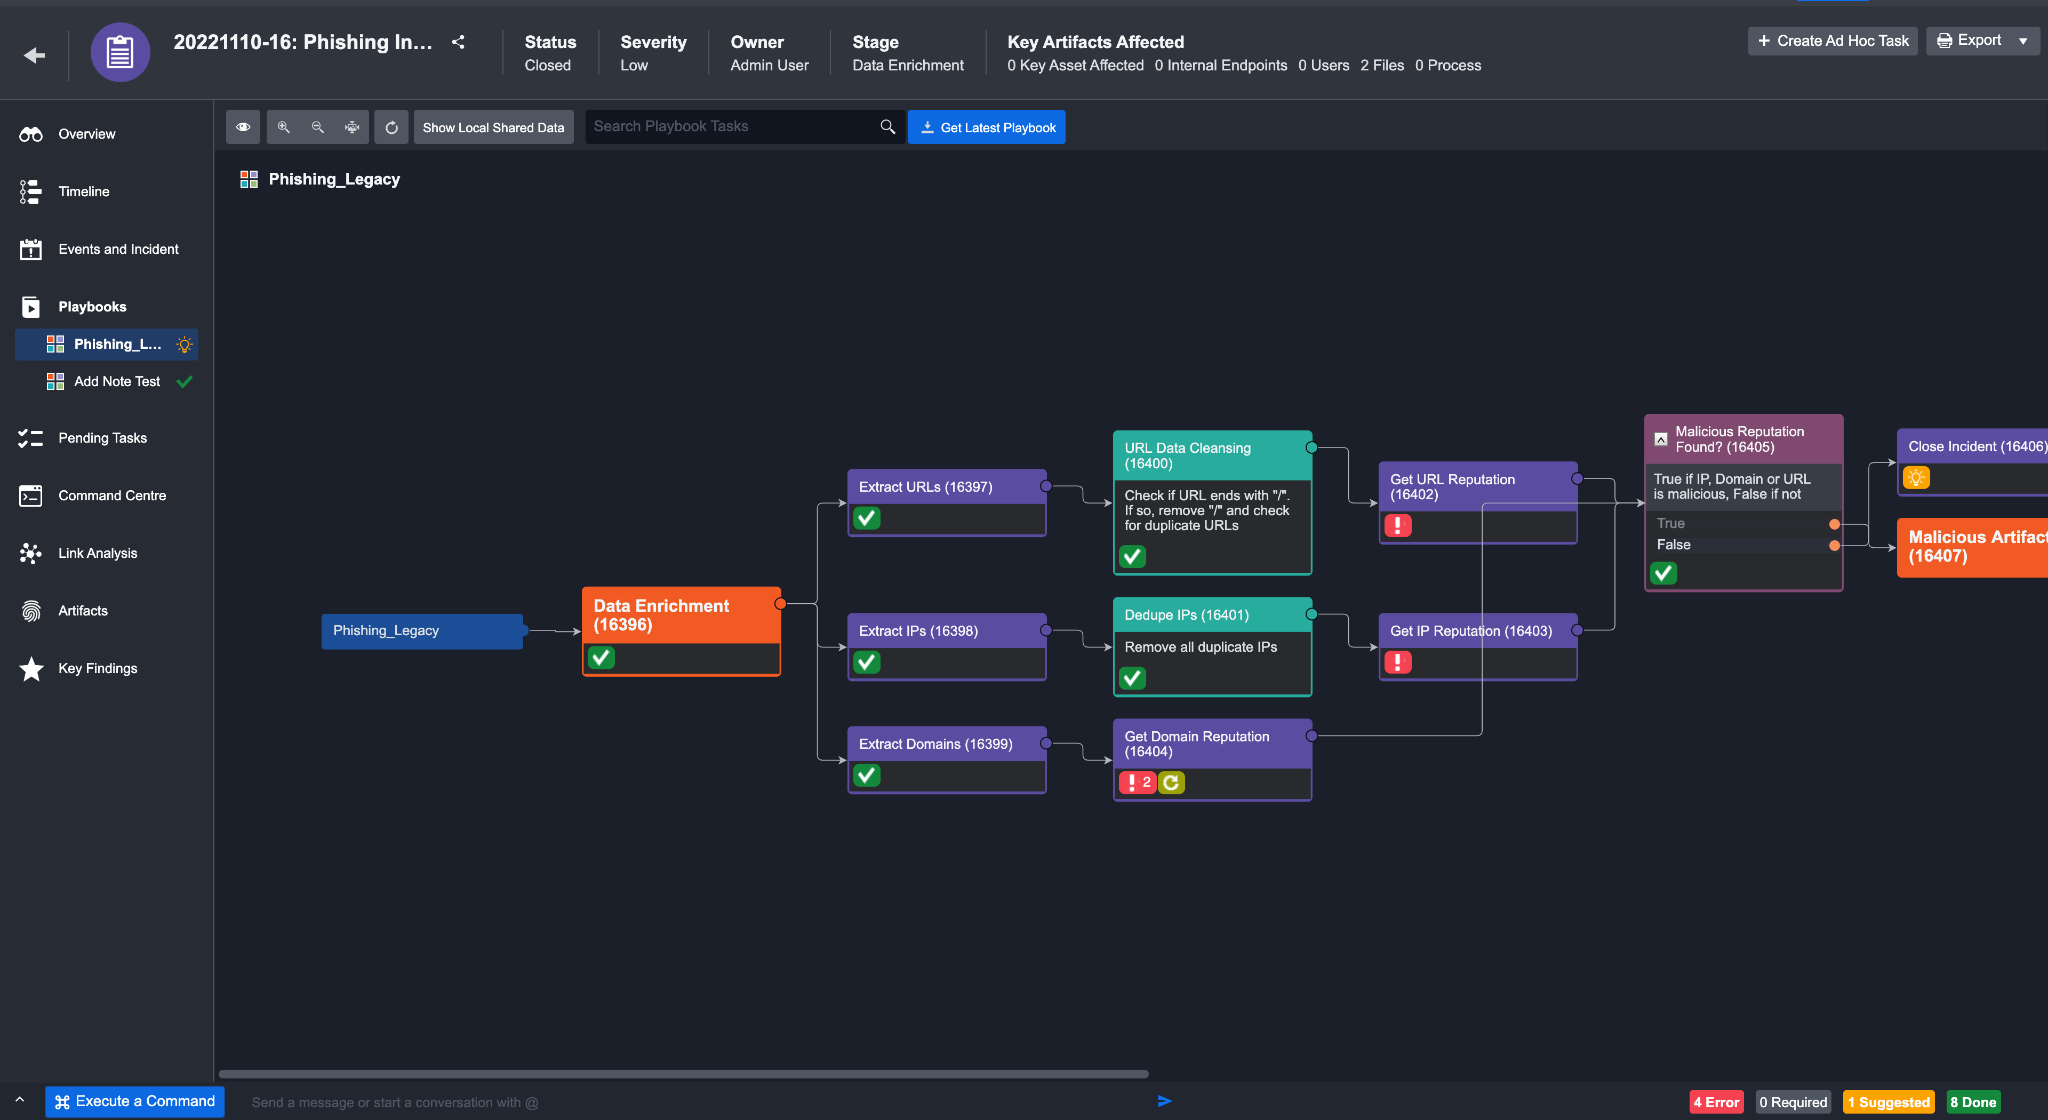
The Playbook tab provides an overview of what Playbooks and Playbook Tasks have been added to the Incident, as well as their individual runtime statuses. This visualization provides an understanding of the linkages between different Playbook Tasks; from this view, you can choose to take actions directly on specific pending Tasks.
All Playbooks that have been added to the incident will appear under the playbook tab on the left panel. You can click on each playbook to view the status of its underlying Tasks.
If a playbook contains a nested Command, you can access it by clicking on the expand link icon on the left of the parent playbook.
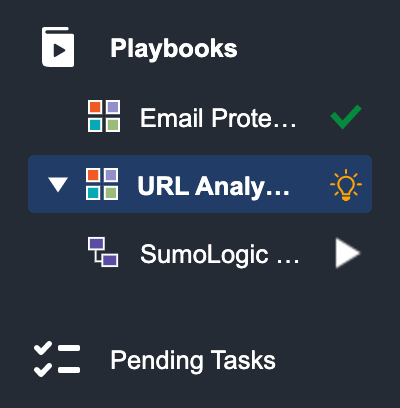
The icon beside the playbooks’ title indicates the status of each individual playbook:

The Playbook contains tasks that require manual response from the user in order for the playbook to continue running.

The Playbook is running.

All Tasks within the Playbook have been executed and completed.
At the bottom of each Playbook Task card, its status is indicated by different icons. They will be explained in turn in the following table.
Task Status | Description |
|---|---|
 Run | This status is only available when you are testing a playbook. This allows you to test individual tasks to check if they’ve been configured correctly without the data from prerequisite tasks. |
 Queued | This status means the task is in a queue and waiting for its turn to run. |
 Done | The green checkmark means the task was successfully run. |
 Required  Suggested | Required tasks are represented by an asterisk and suggested tasks have a light bulb. Both of these statuses are referred to as a Pending Task. Required Tasks require your manual response, whereas this action is optional for Suggested Tasks. |
 Running | When you see this icon, it means the Task flow is currently being executed. |
 Skipped | The Suggested Task has been skipped, instead of being executed. |
 Error | This icon indicates that an error has occurred while the Task was running. You can rerun these Tasks after correcting the error. |
 Rerun | The icon appears when the task has been rerun. |
 Wait For Reply | This status appears when the Task is a nested Playbook and there are additional Tasks to be completed within this Task before it is updated as Done. |
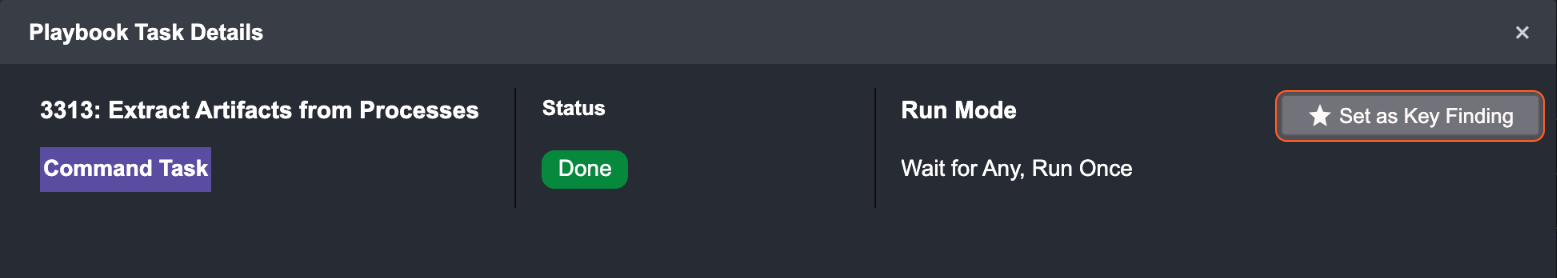
You can click on each individual Playbook Task to view its task details. Within the pop-up window, the top panel highlights the Task Type, Assignee, Due Date, Status, Run Mode and action buttons of the Playbook Task. If not run, the first tab within this window presents the Input tab. You can review the contextual data in the Input tab, and update the input fields before running or skipping the Playbook Action. To run the task, click on the done button.
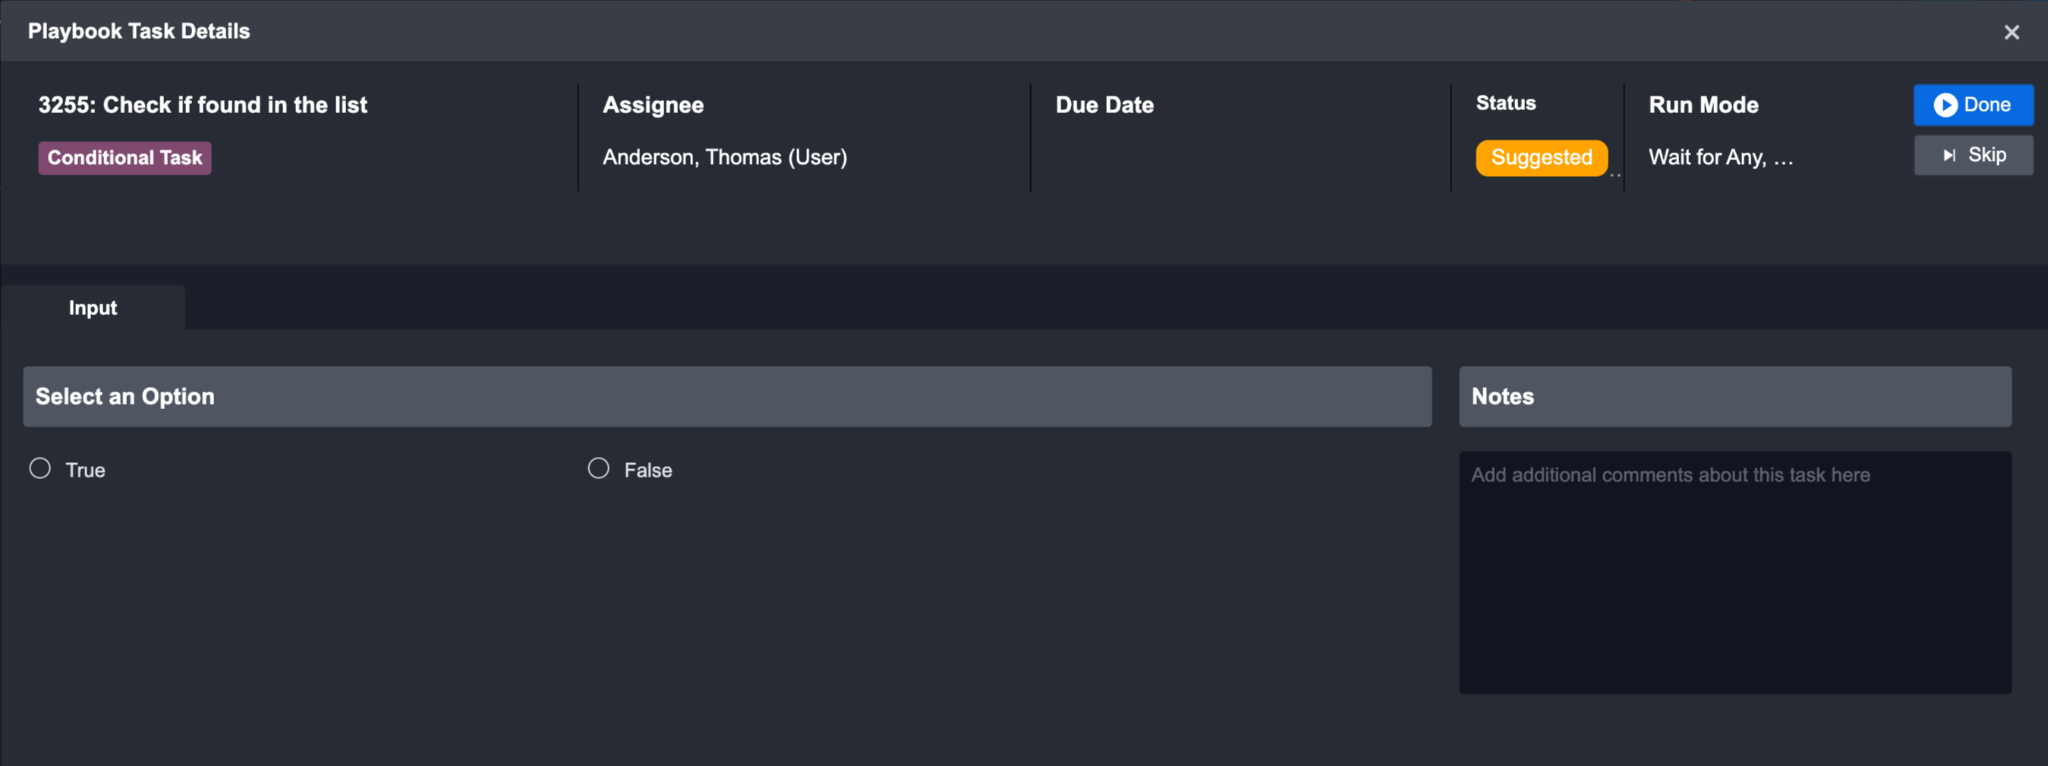
However, you will not see the action buttons if you don’t have permission to the task. To be able to run or skip a pending task, you must first have role access to playbooks and pending tasks (this is controlled by your administrator). Next, you must be one of the following: the owner of the incident, the direct assignee of the task in the Playbook Task configuration, or the assigned investigator of the incident.
When you choose to skip a task, you can skip to the next task in the flow without having to run the previous task.
After a Task has successfully run, additional tabs such as Task Details, Key Fields, Context Data, Return Data, Raw Data and Result will be available in the Playbook Task Details window. The information presented in these tabs will vary depending on the Task Type selected.
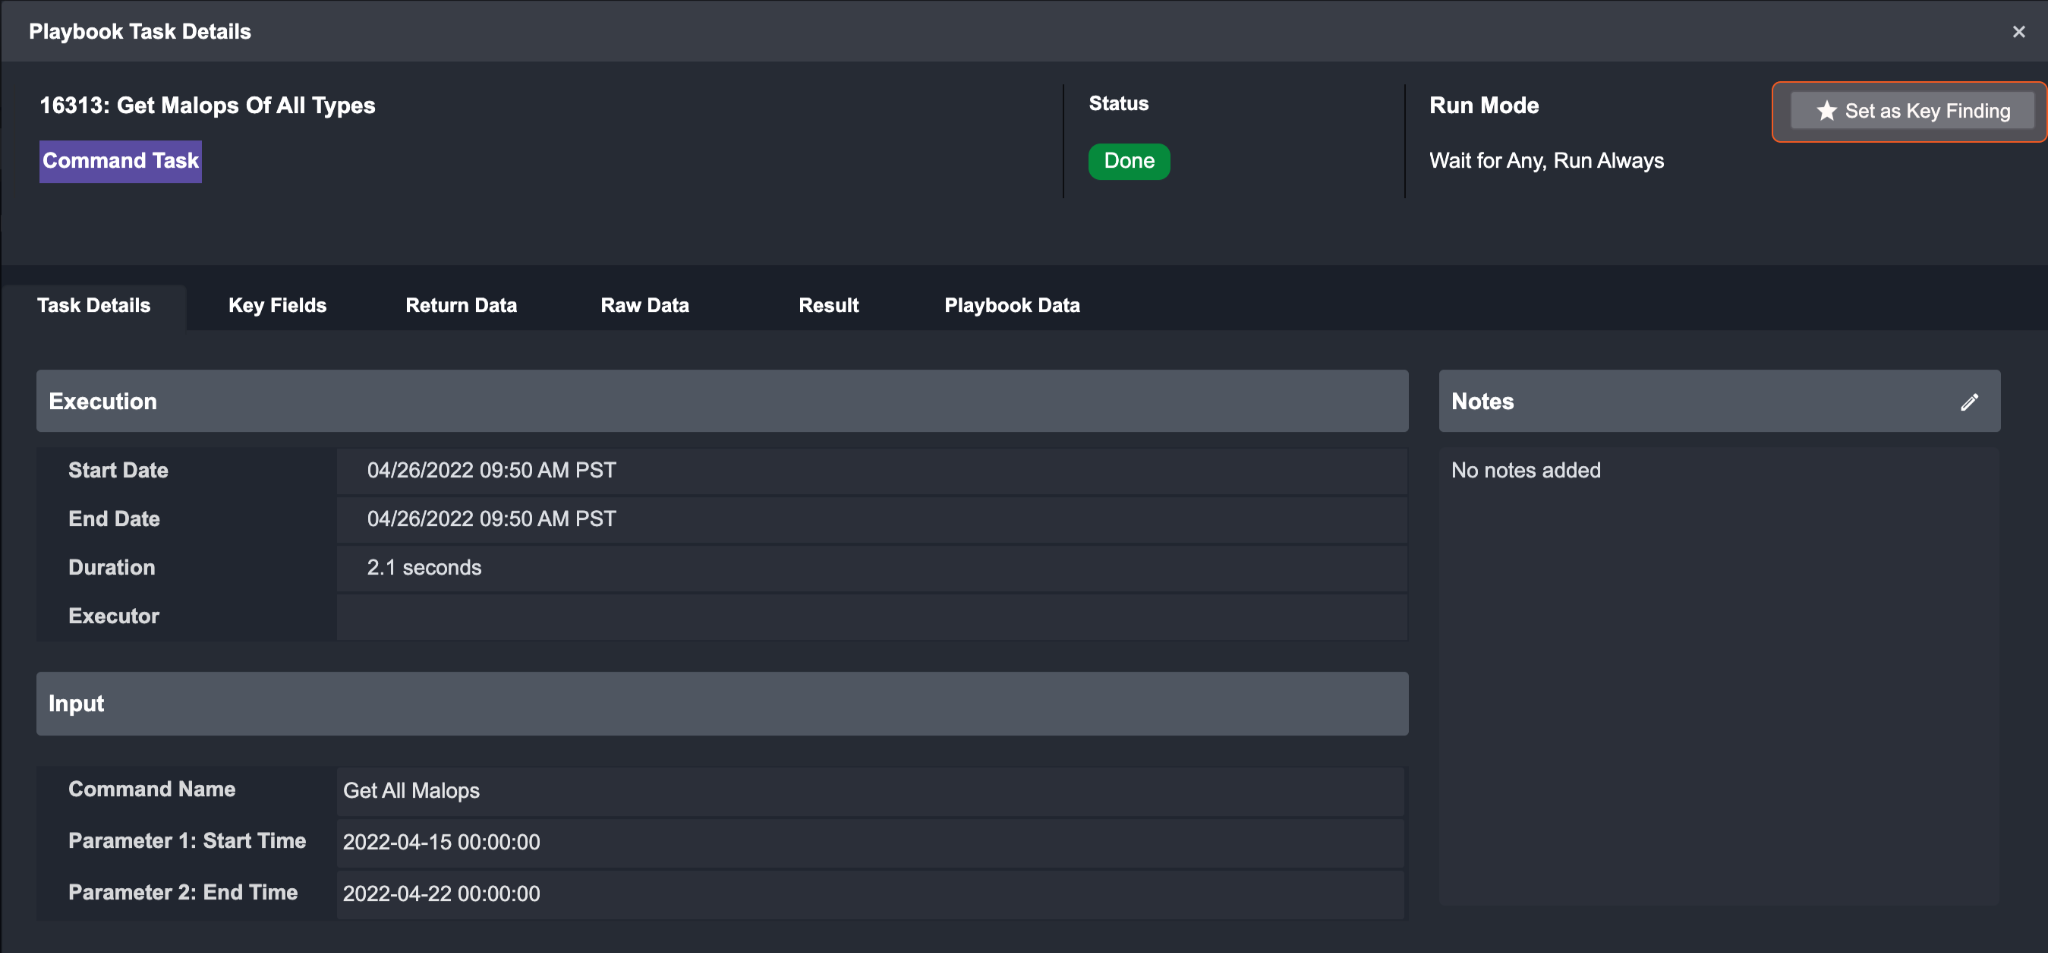
Reader Note
You can set a task result as Key Finding if it’s deemed important. All marked tasks appear in the Key Playbook Tasks under the Key Findings tab in Incident Workspace.
Get Latest Playbook
When a task has stopped due to an error, you may want to identify the problem in the playbook and remediate it. In the case an event playbook has been updated after it has run, you will notice a button appear next to the search bar. Clicking this button will replace and re-run the playbook on this event, updating task statuses.

Pending Tasks Tab
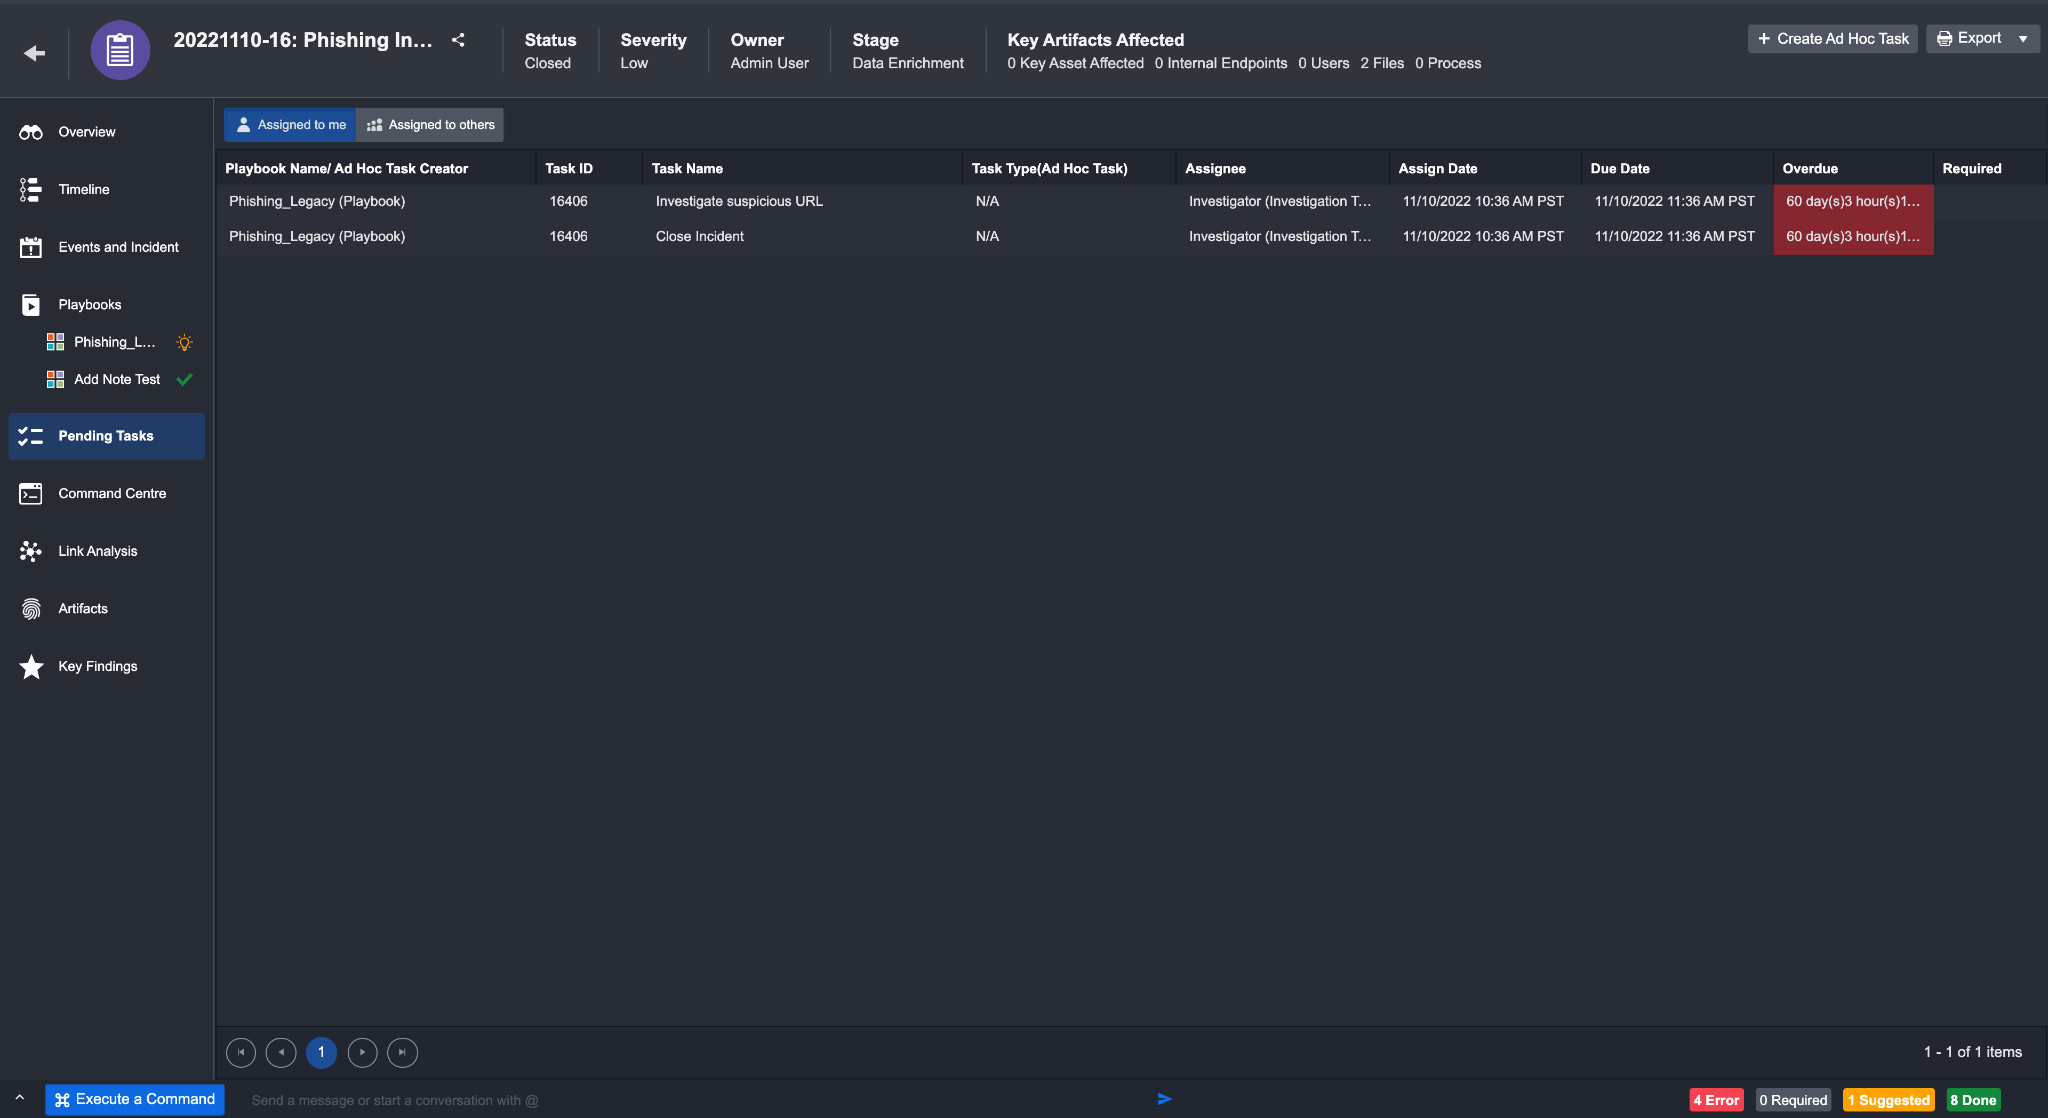
The Pending Tasks tab shows suggested and required Tasks available for the selected Incident. This list also highlights Tasks which are overdue and require immediate action. You can toggle between lists of tasks assigned to you and tasks assigned to others. More information about executing the selected Playbook Task is described in the playbook documentation.
Examples of Pending Playbook tasks:
Block URL(s) | As a Tier 2/3 Analyst, you can make an initial decision to block the URL(s). If approval is needed, an Interaction Task can be added to be sent to the Lead Analyst for the final approval. |
|---|---|
Block External IPs | You can make an initial decision to block the IP(s). If approval is needed, an Interaction Task can be added to be sent to the Lead Analyst for the final approval. |
Quarantine Host | You can decide to quarantine the host(s). The request will be sent to the client’s service provider (i.e. McAfee NSM). |
Reimage Host | You can decide to reimage host(s). D3 can be integrated into an IT ticketing service like ServiceNow for tasks that require IT administrators to be involved. |
Find Affected User(s) | You can provide the list of affected uses to the IT Administrator to have their credentials changed. |
Find Affect Email(s) | You can review the list of affected emails and decide whether or not to block the email address. The requests will be sent to the client’s email provider (e.g. Microsoft Exchange Server). |
Send Email Notification | The system will send an automatic email notification to leaders from other departments if D3 is able to determine that that phishing email is part of a larger campaign. |
A pending task may also be an ad hoc task. This is one that was created within the incident workspace and needs to be addressed by a user. You can view this by clicking into the task to view, respond, or complete the task by clicking done.
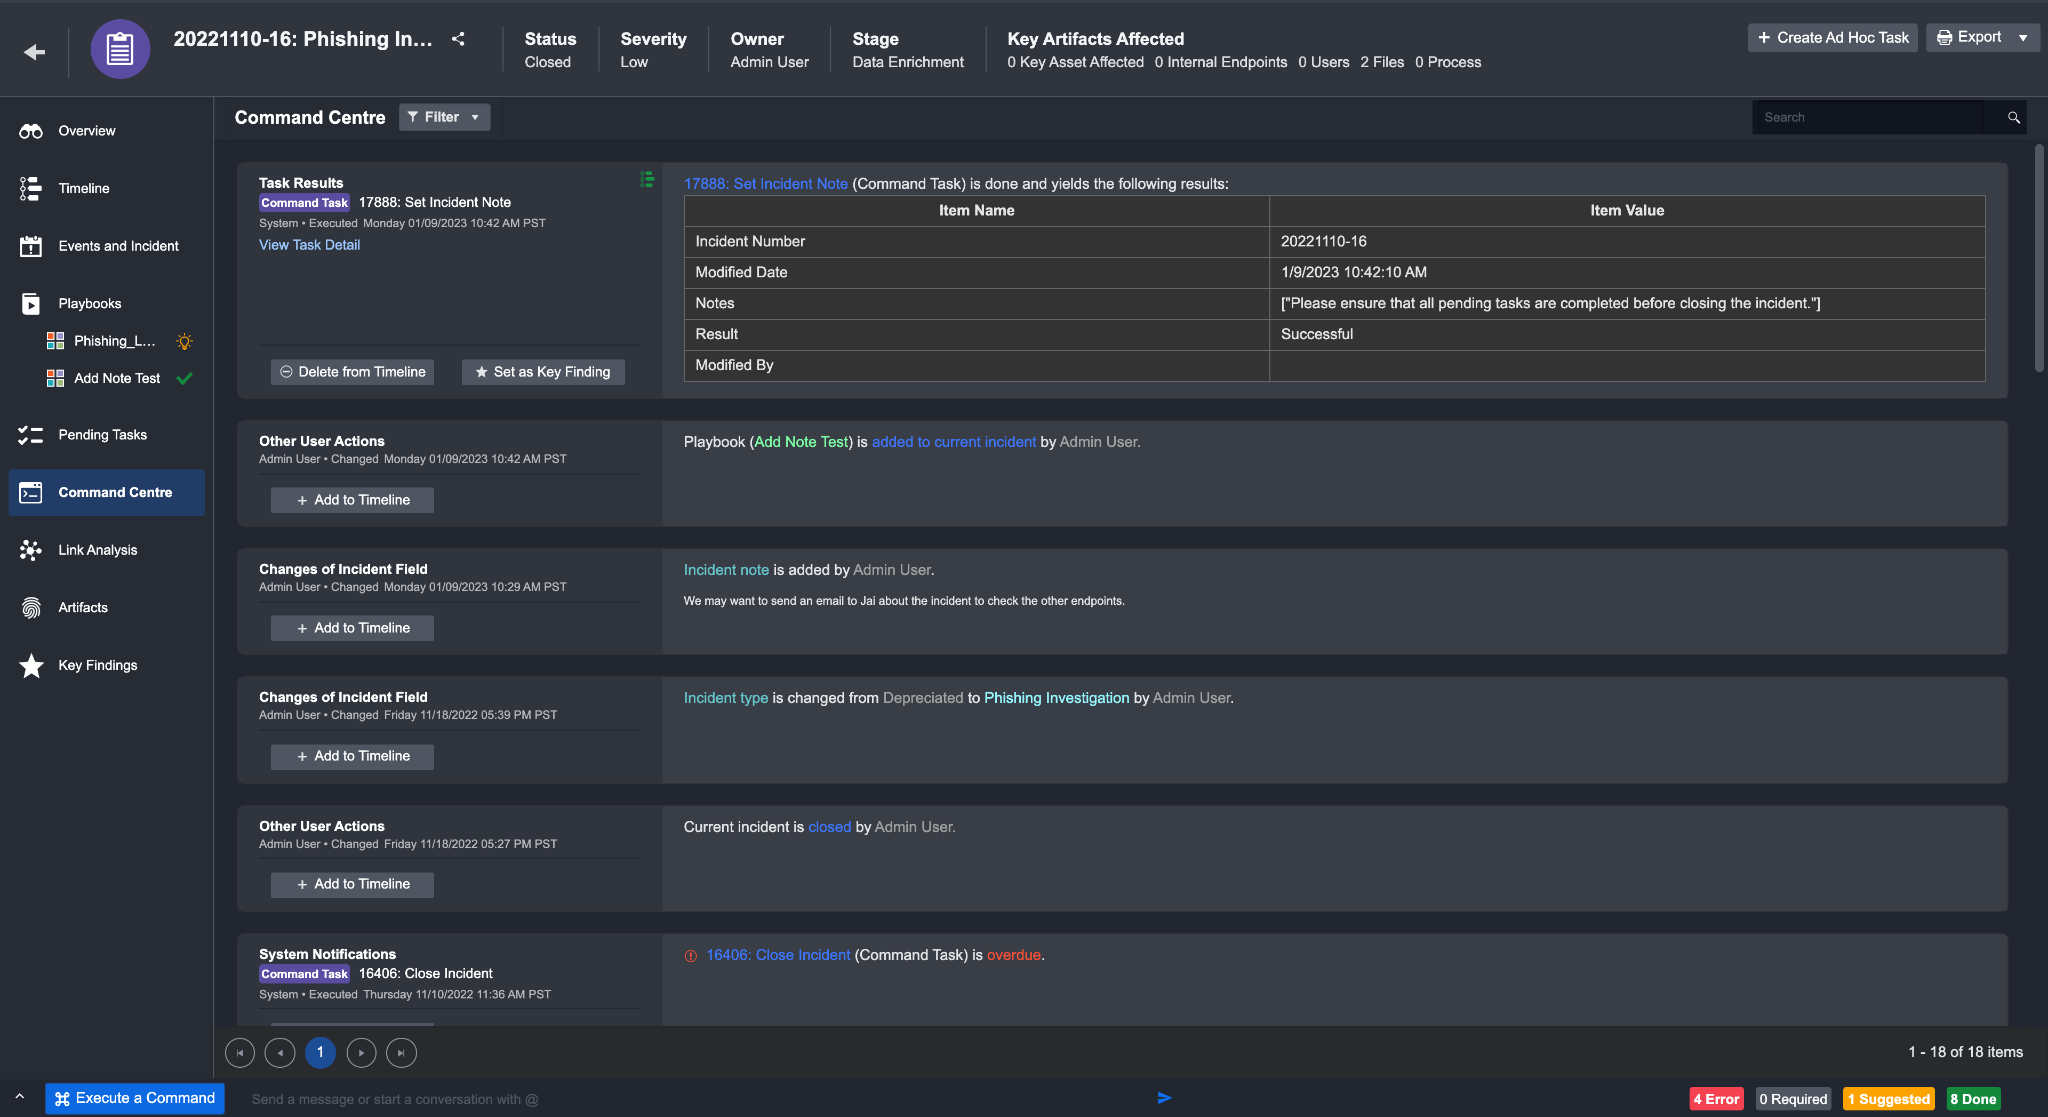
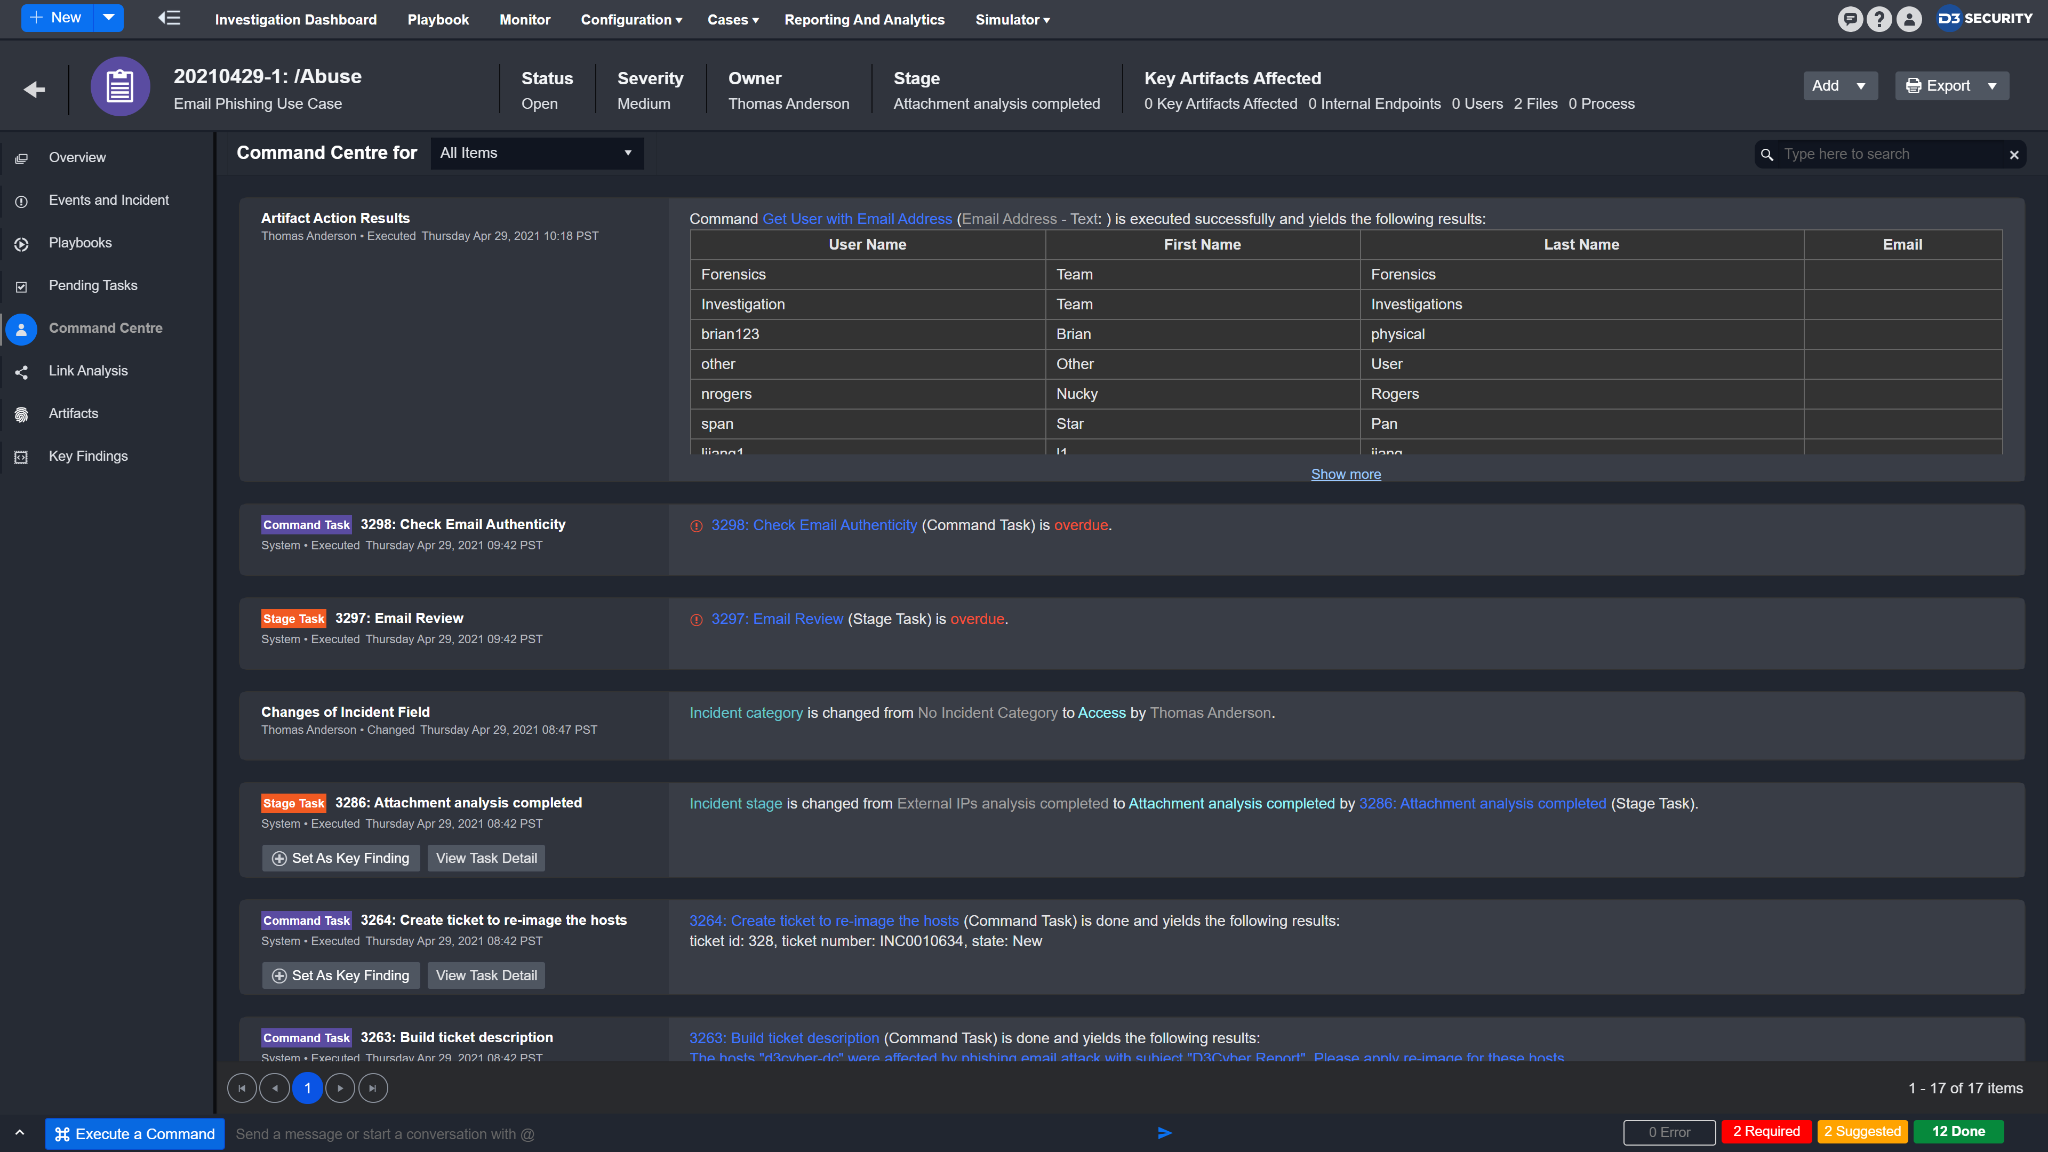
Command Centre
Command Centre provides you with a chronological list of all the key activities and serves as an audit trail of all Playbook Tasks and ad-hoc Command actions that have been performed on the incident.
Command Centre will show the following items:
Ad Hoc Tasks | It includes Ad Hoc Tasks - Task Creation History and Ad Hoc Tasks. Ad Hoc Tasks - Task Creation History represents an incomplete task, with its creation details, task name, type, description, assignee, creator, and the related incident number. Ad Hoc Tasks indicate a completed task with additional information (e.g. Task Response, Executor, Action and Done Date). |
|---|---|
Artifact Action Results | All results of artifact action after executing a command successfully. |
Changes of Incident Field | All the historical changes of Incident fields (e.g. changes of investigation team members in the incident form section) are captured in the Command Centre. |
Command-Line Results | All results of command-line action through Execute a Command will be available in the Command Centre. |
Messages | Instantly message and communicate history between investigation team members to collaborate on the same Incident. |
Other User Actions | Any other actions such as adding new artifacts, attaching files or recording notes. |
System Notifications | All overdue Playbook Tasks. |
Task Results | When Playbook Tasks run and finish based on the pre-configured workflows, all the Playbook Task results are sequentially yielded and chronologically presented. |
Key Finding Actions | History to show which item has been set as key findings. |
From this view, you can choose to take various actions on specific items where necessary:

View Task Details: you can open up a Playbook Task result window in order to view the Task result details from the Command Centre.
Set Task as Key Finding: you can view Tasks results and mark the results as key findings for the current Incident. All marked tasks will be displayed in theKey Findings tab, under Key Playbook Tasks.
Download Files: An Incident Report will be generated when running a Generate Incident Summary Report command. The report can be exported and downloaded as files for reporting and operational purposes.
To set a result as a key finding:
Click on the Set as Key Finding button.
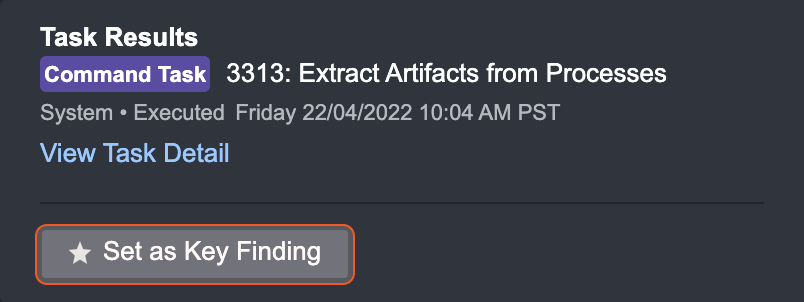
You can also set it as key findings inside the Playbook Task Detail window.
Navigate to Key Findings to find all key findings.
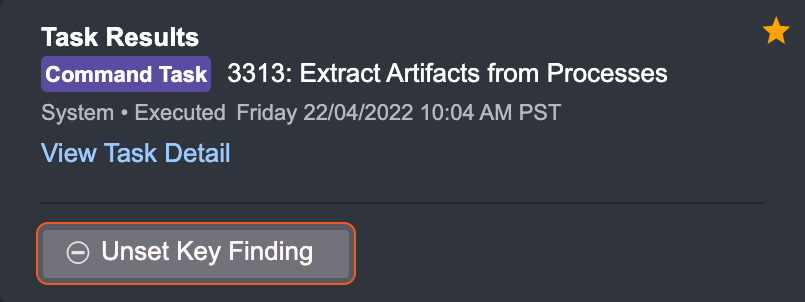
To unset a key finding:
Click on the Unset as Key Finding button.
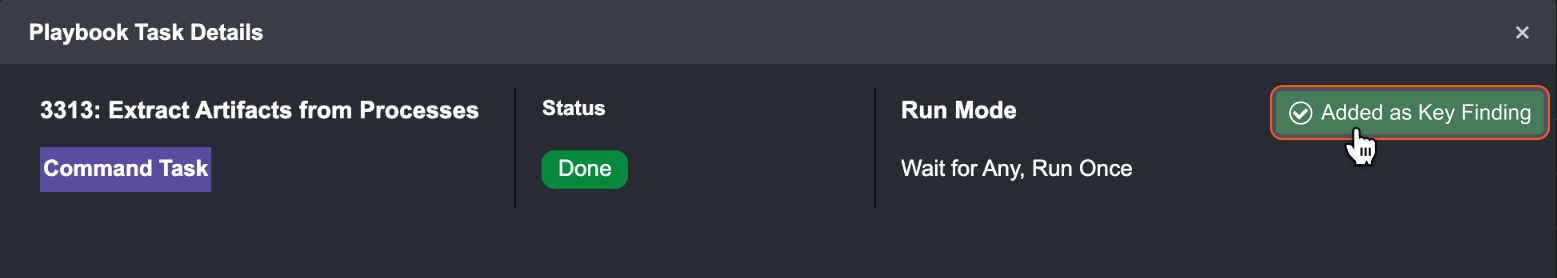
You can also hover over the Added as Key Finding button in a task details window to Unset this key finding.
Link Analysis Tab
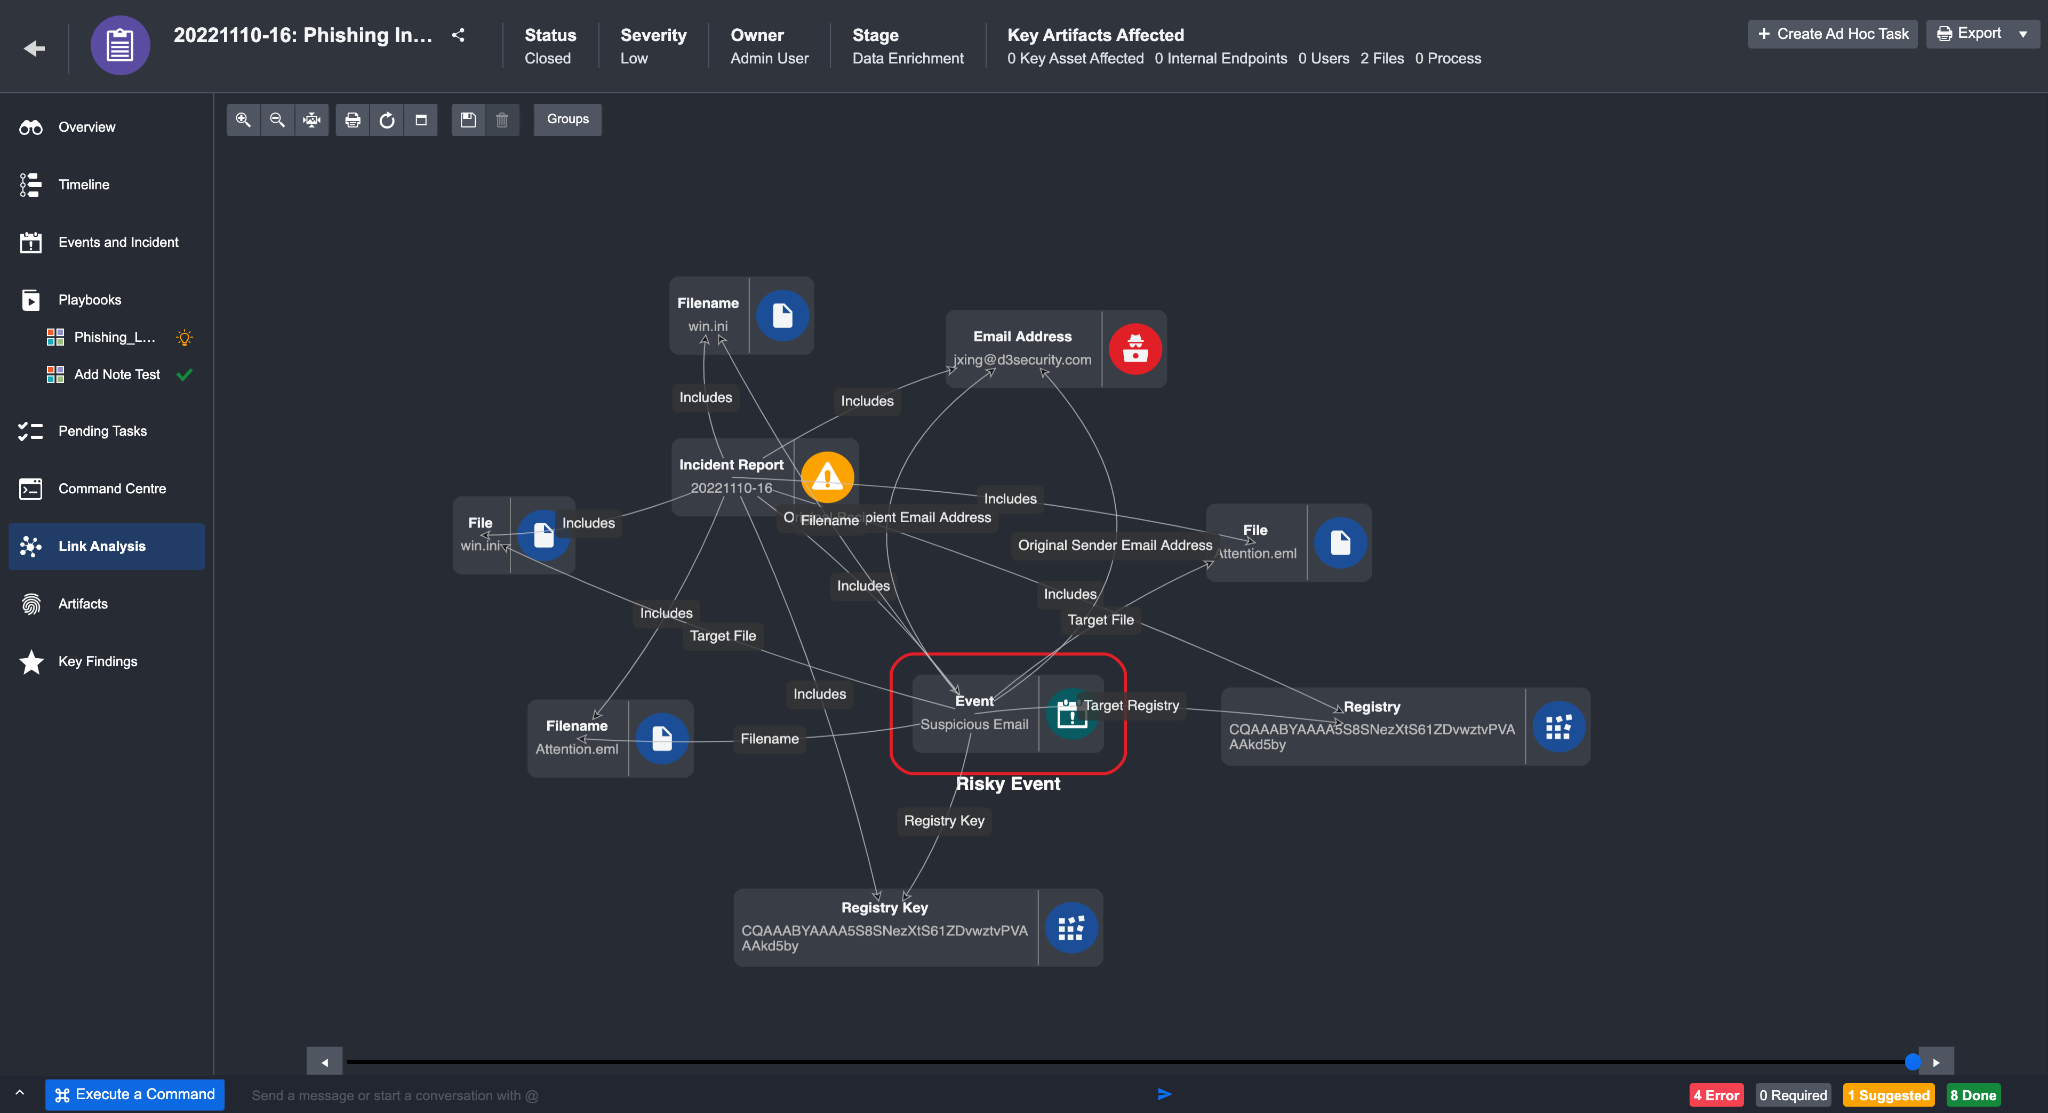
The Link Analysis tab visualizes the cyber attack in a mind map format. This format visualizes the relationships between Events, Incidents and Artifacts without having to rely on a linear text report. Double-clicking on an element in the mind map may provide further details relating to that element.
User-friendly features have also been incorporated in this tab to simplify how information is presented. You can easily identify specific attacks using these features:
Attributes to Group Objects are attributes to visually categorize objects.
Example: Bad Reputation, Internal Endpoint, High Risk External Endpoint, High Risk URL, High Risk Event, etc.Timeline Scroll limits the information displayed during a period of time for more granular investigation. This scroll is located at the bottom of the tab.
Artifacts with Bad Reputation are visually highlighted in red for you to easily identify risks.
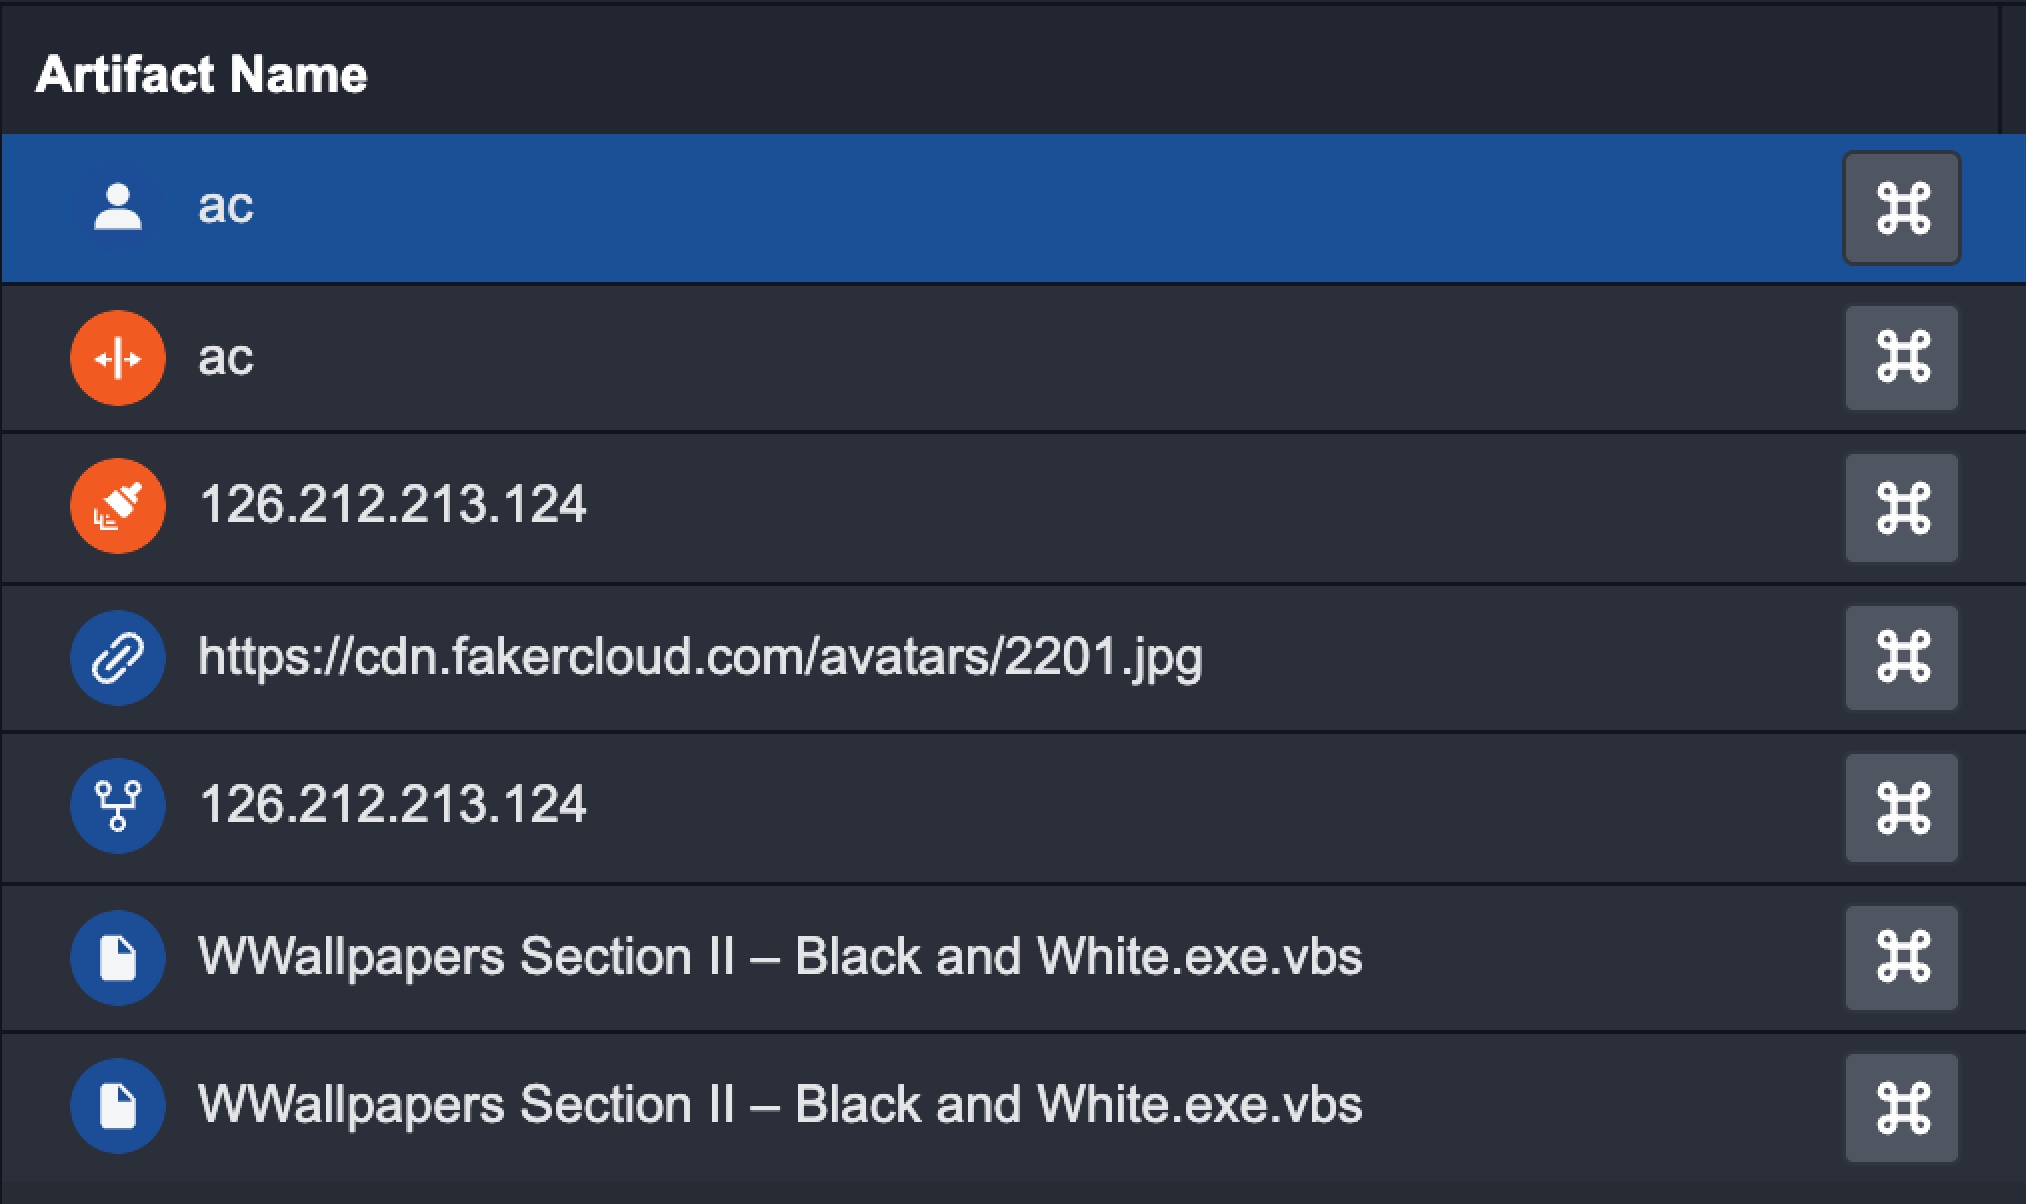
Artifacts
The Artifacts tab shows all the Artifacts that have been extracted for the current Incident. This view helps you quickly identify Artifacts with a large number of associated Events, which could be indicative of unusual and suspicious activities.
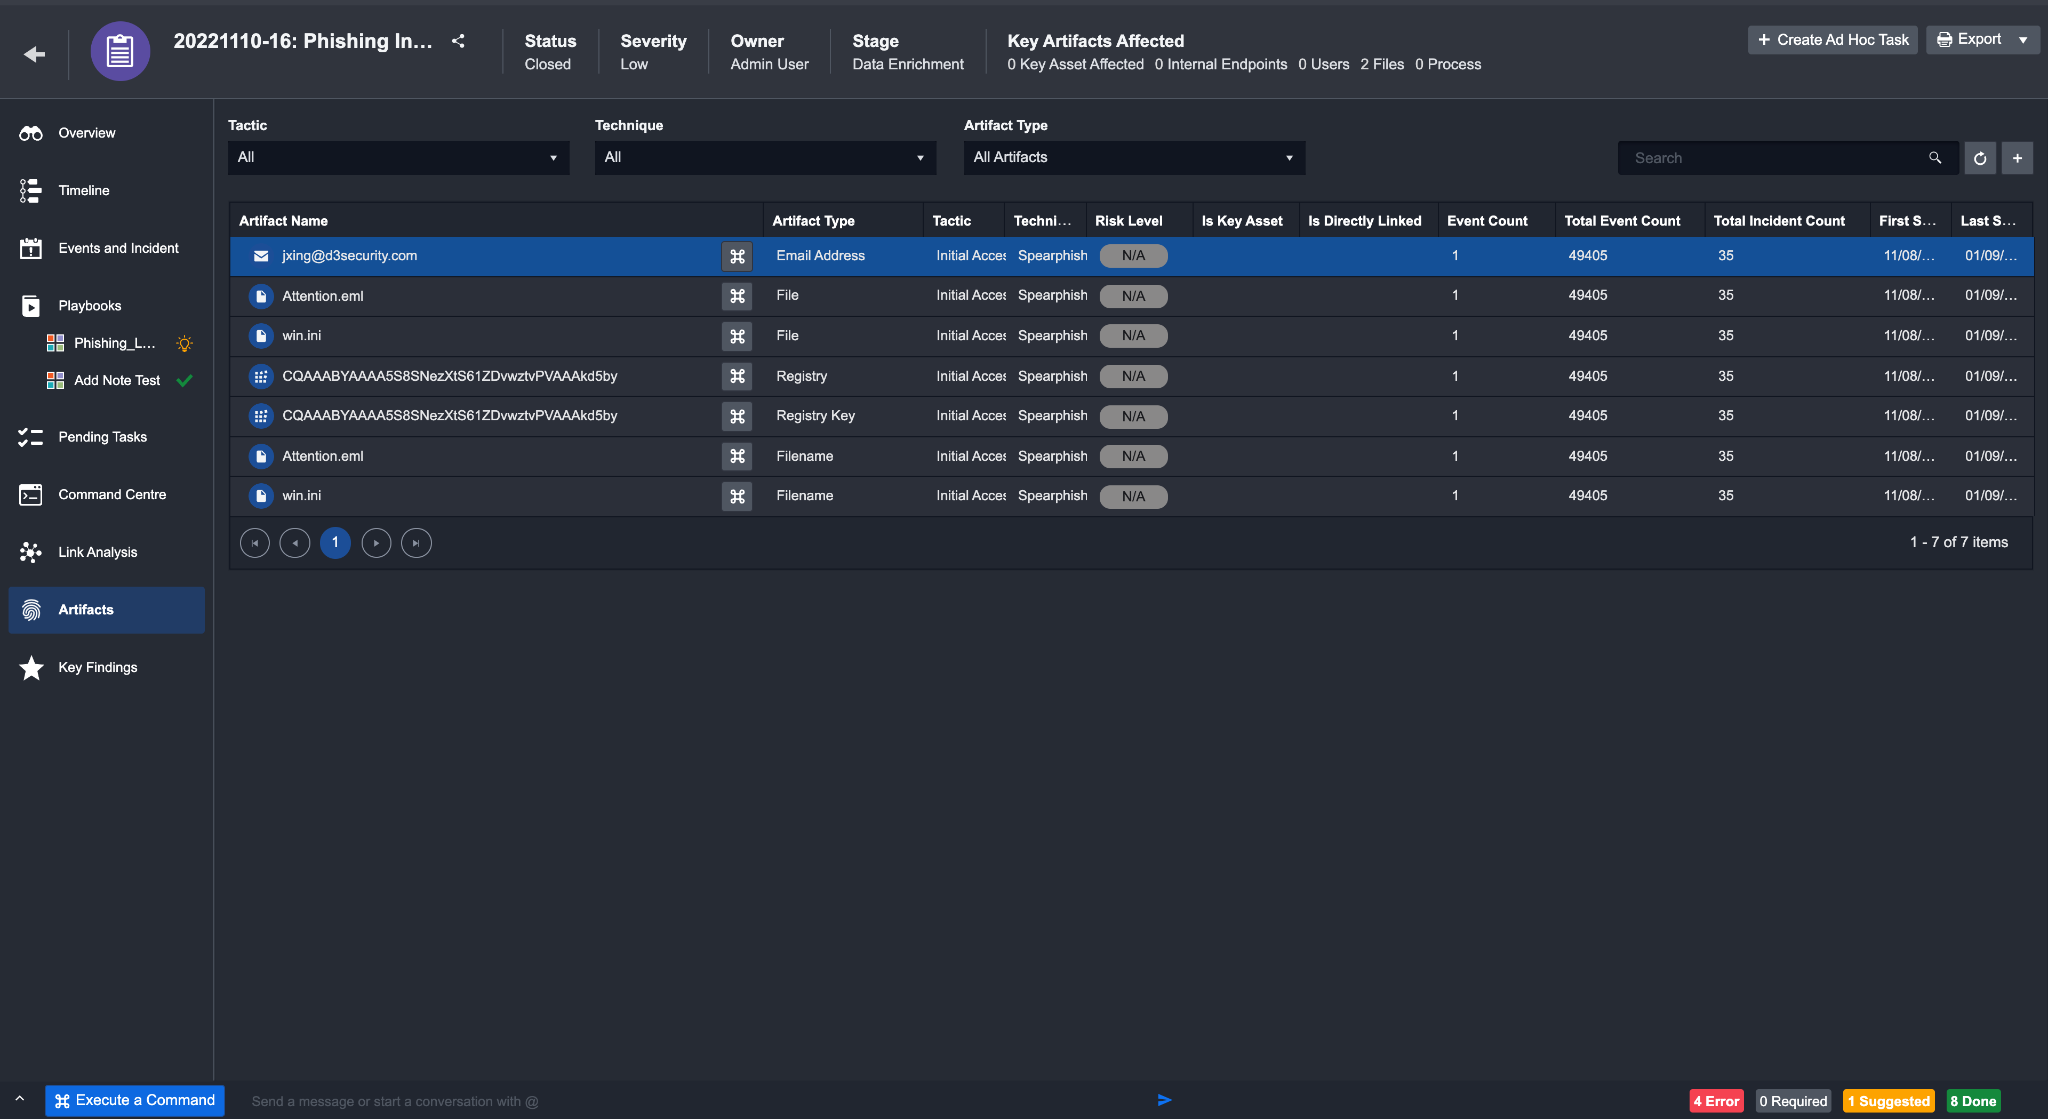
As part of the Artifact analysis process, you can conduct the following:
Set additional Artifacts not initially extracted.
Take action using the Artifact details to enrich data for threat, capability and other assessments.
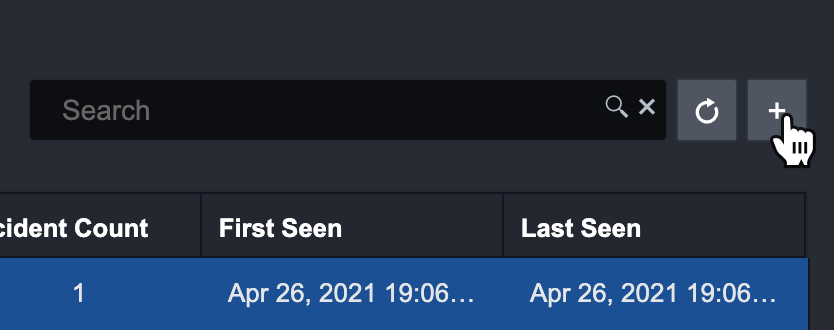
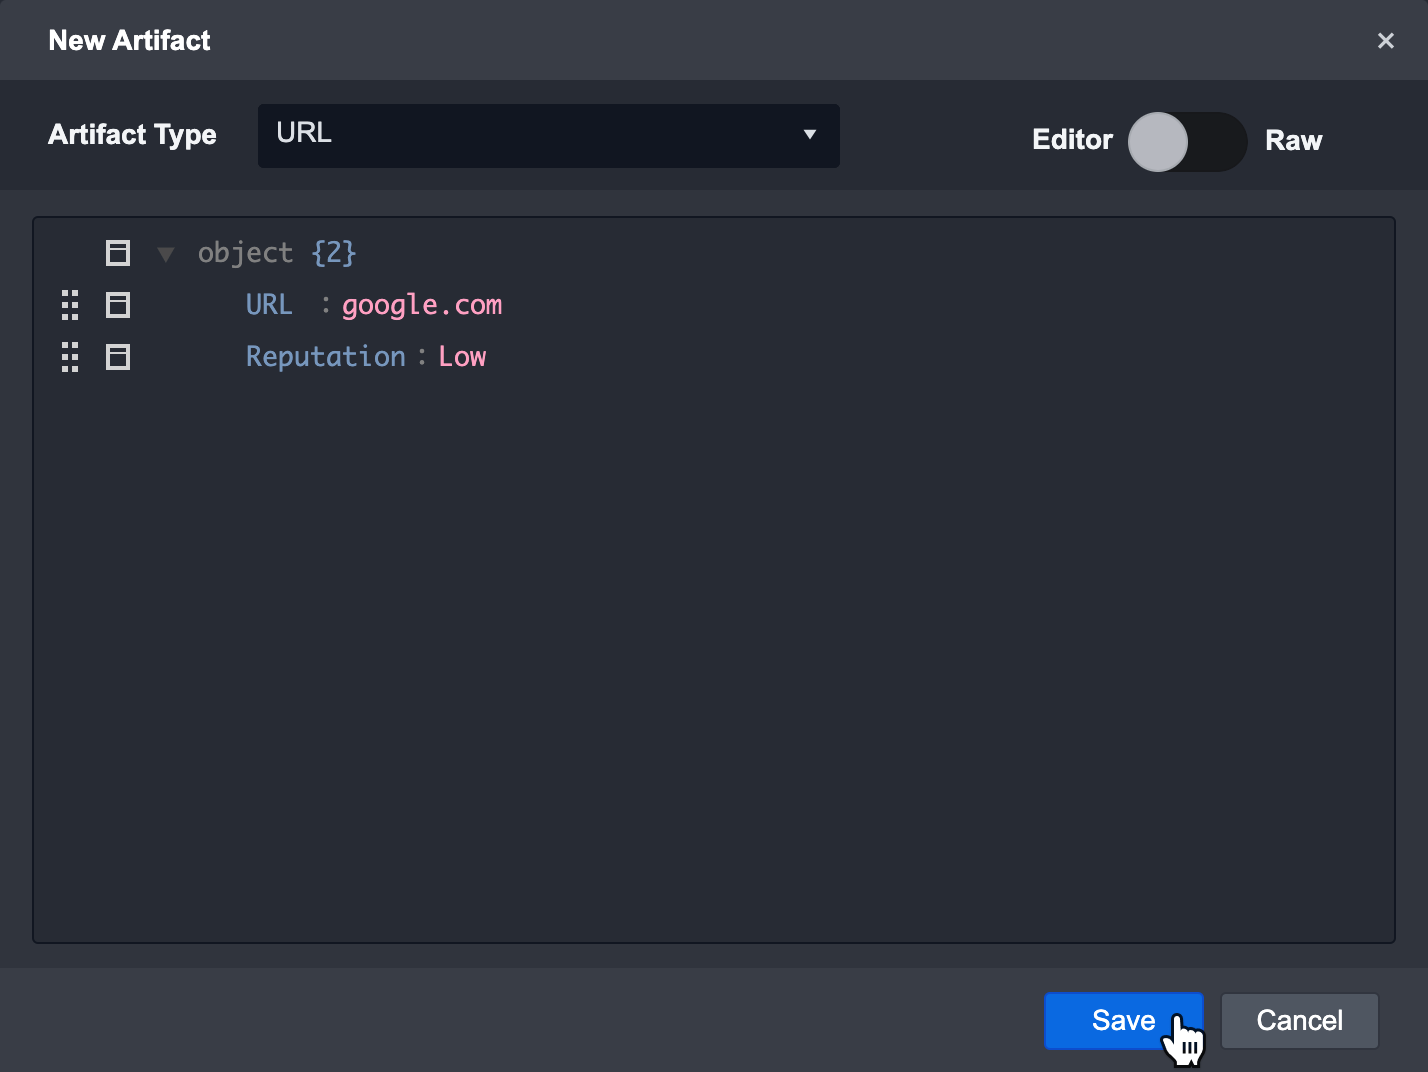
Manually Add Artifacts to an Incident
By clicking on the + button located in the top right corner of the artifact page, you can manually create and set artifacts to an Incident. You can use this to build relationships between different Incidents and Artifacts. The new artifact window allows you to manually add a new artifact. You can switch between the editor mode or raw mode by clicking on the toggle.
To manually add artifacts to an Incident:
Click the Artifacts tab on the left menu.
Click on the + button.
Click on the dropdown and select the relevant Artifact Type.
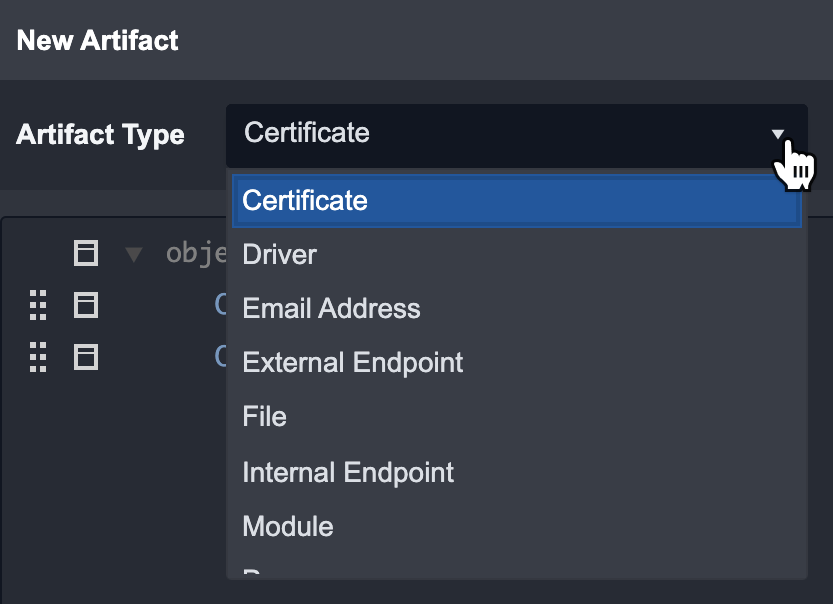
Fill in the details of the Artifact.
Click on Save to add the Artifact to the Incident.
Reader Note
In Artifact Details, you can edit the artifact information or delete the artifact. You can also Execute a Command using the Artifact data.
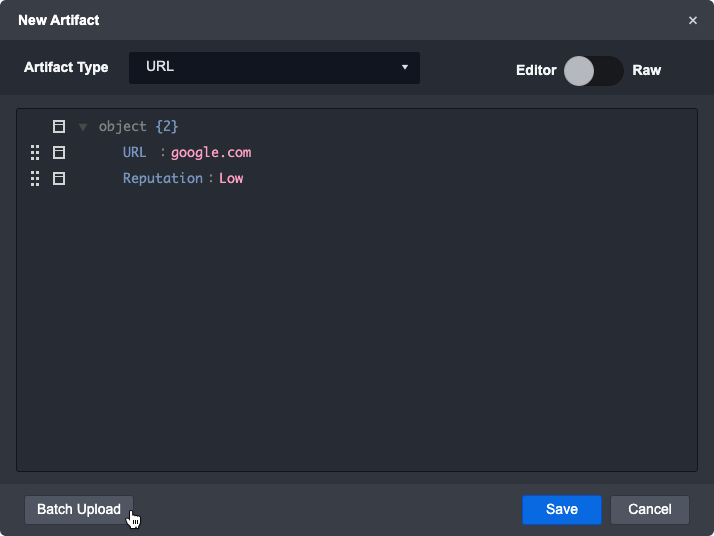
Batch upload artifacts
Additionally, you can batch upload several artifacts that relate to a specific incident.
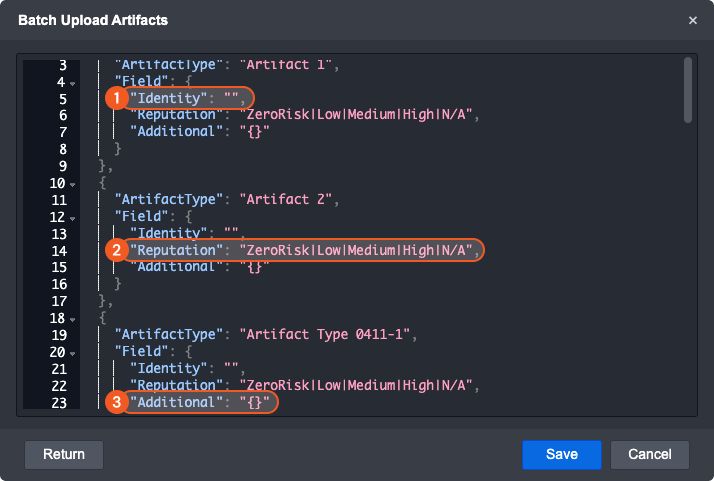
Batch upload will generate a template for each artifact type that exists. Delete any non-relevant artifact type sections and duplicate any as needed.
Fill in the artifact’s identity parameter with a String that describes it
Pick the artifact’s reputation and remove unnecessary text
Add any supplemental information about the artifact in the under additional key. Please note that additional information should be formatted as a JSON object.
A successful batch upload may look like this:
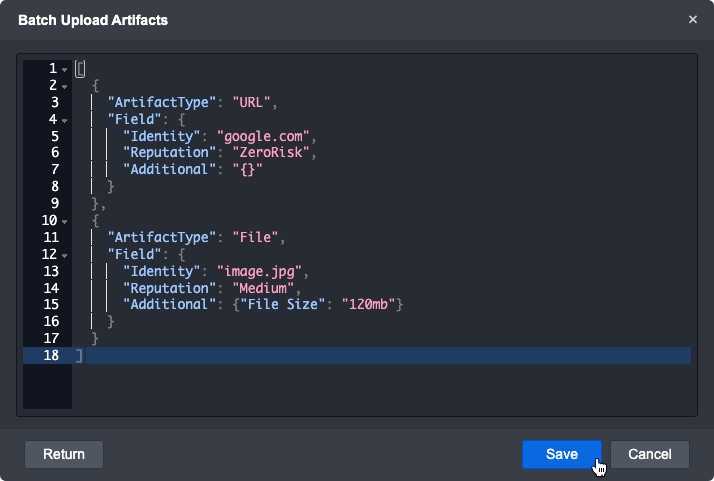
Click on Save to upload these artifacts.
Reader Note
Built-in artifact types may have different JSON structures than as above. Fill in the parameters as needed to batch upload them.
If an error occurs, make sure to check that the JSON is in the correct format and that the parameters are the right data type.
Taking Action on Artifacts
As part of the investigative process, you can directly execute commands on an artifact.
To Execute Commands on an Artifact
Click the Artifacts tab on the left menu.

Click on the Execute Command button.
Reader Note
You can also click on the Execute Command button within the Artifact Details window.
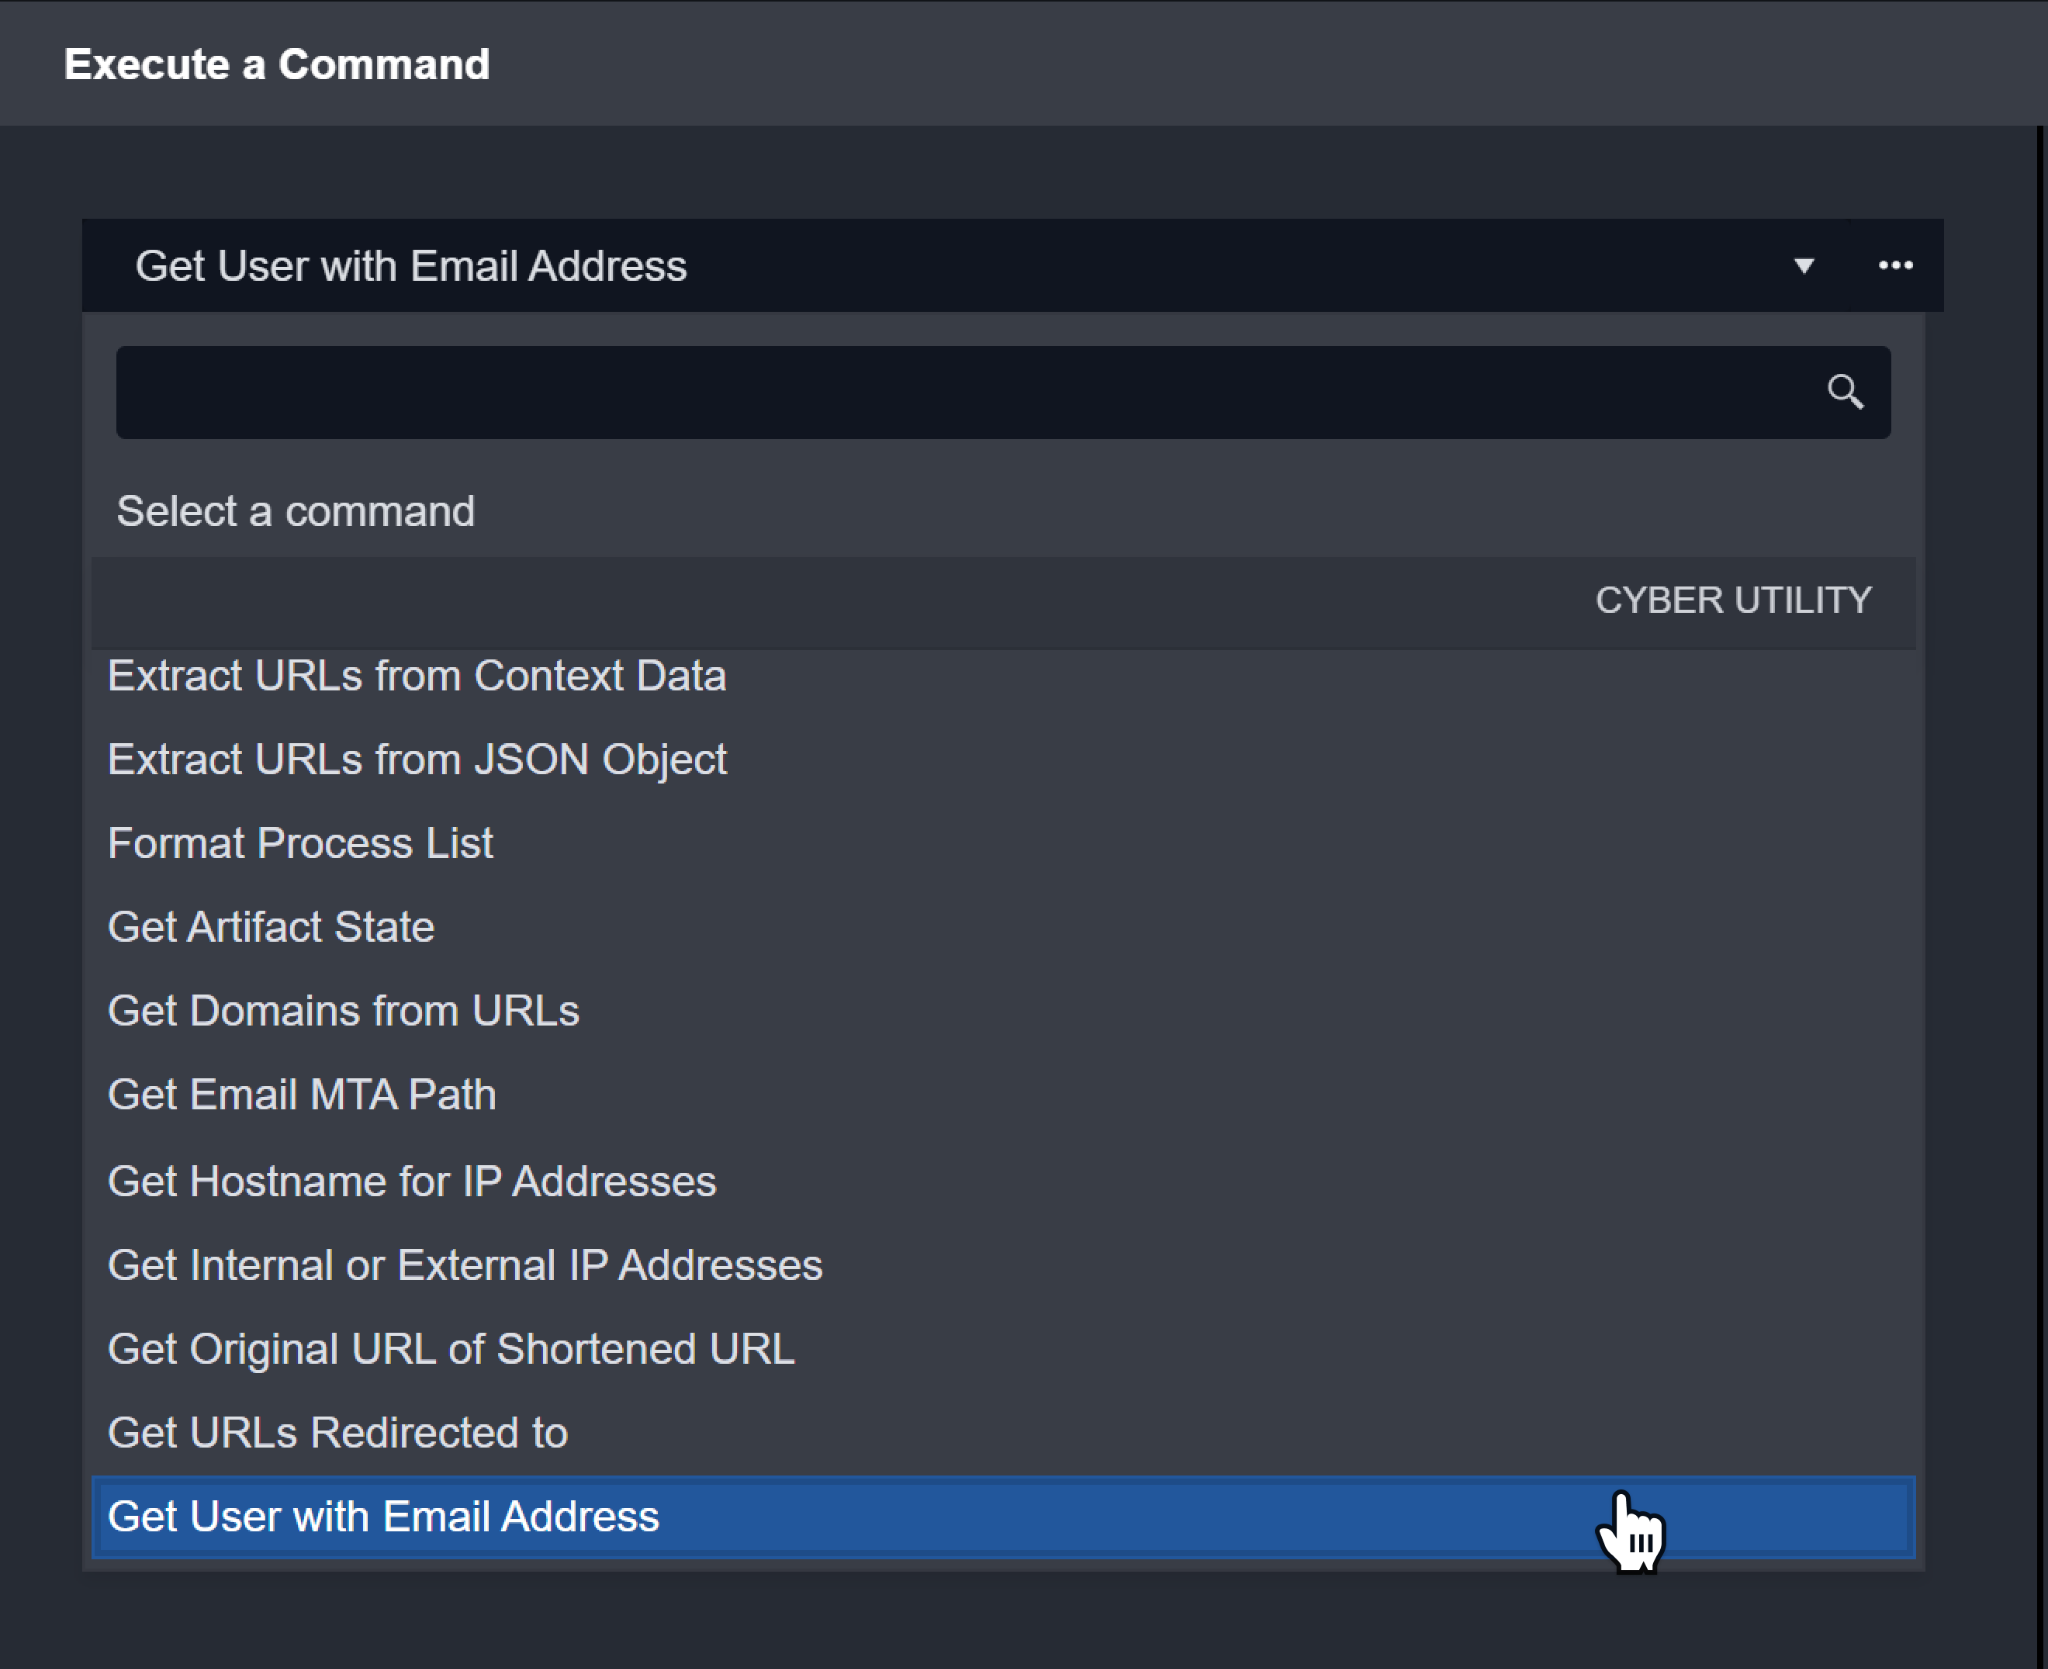
Select the desired Command.
Example: Email Address
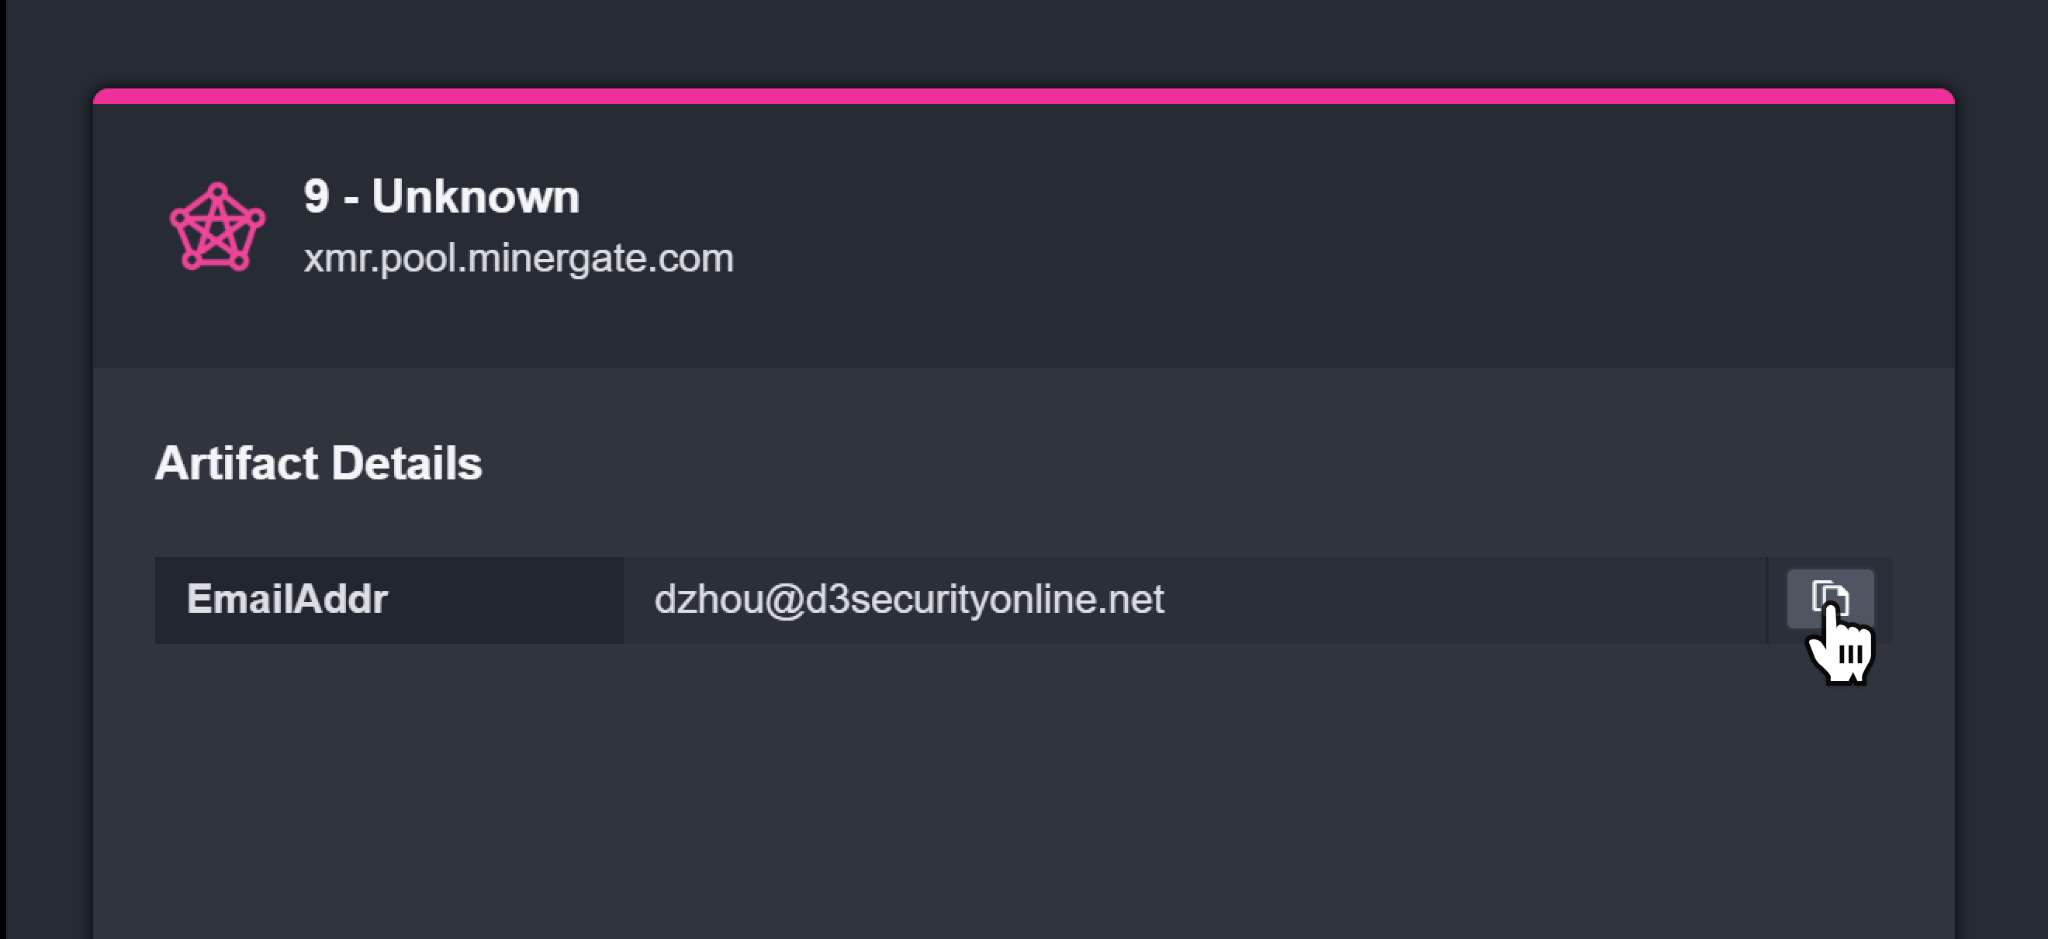
Copy the Artifact Details needed for your Input Parameters.
Example: dzhou@d3securityonline.net
Paste it in the corresponding Input Parameters.
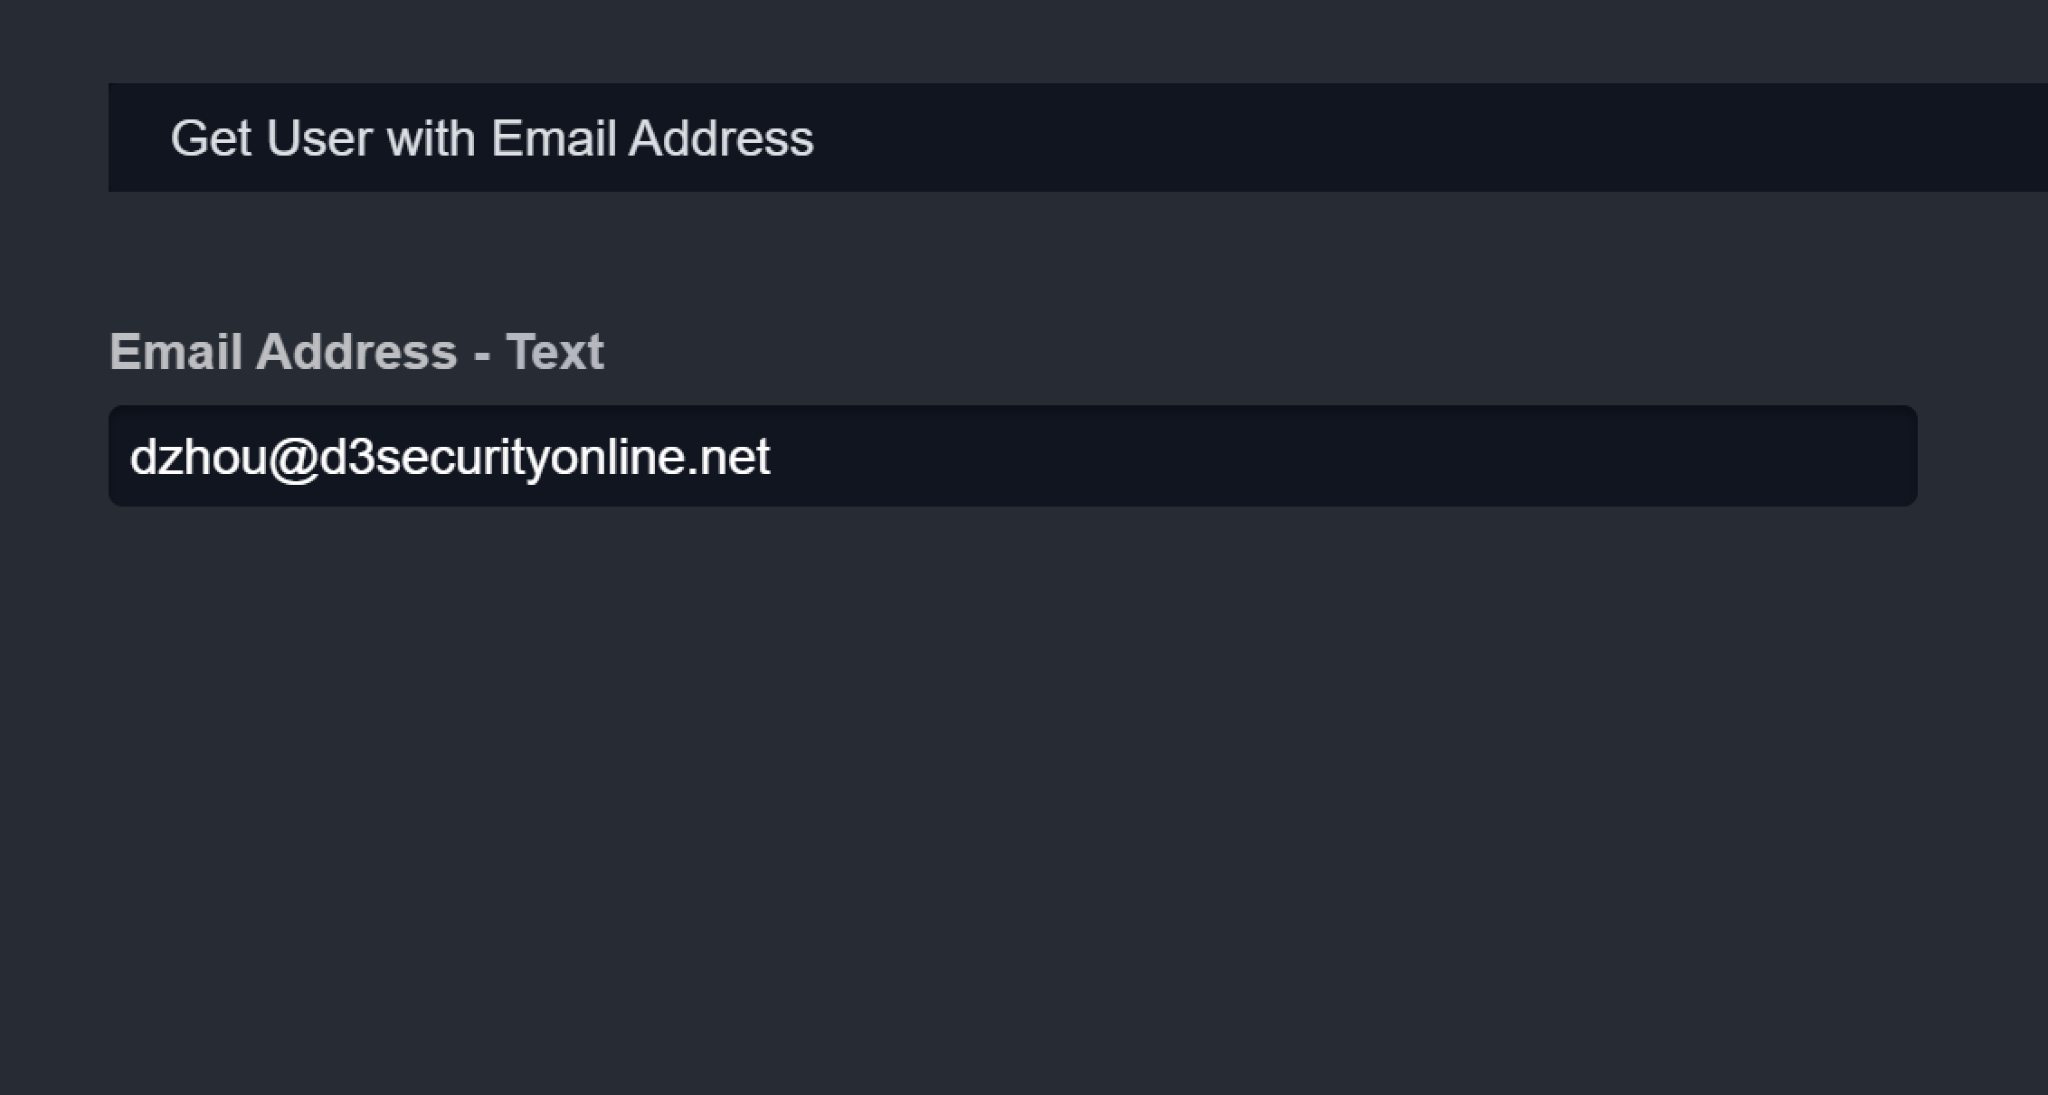
Click on Run.
Result
The results will be displayed in the Command Centre.
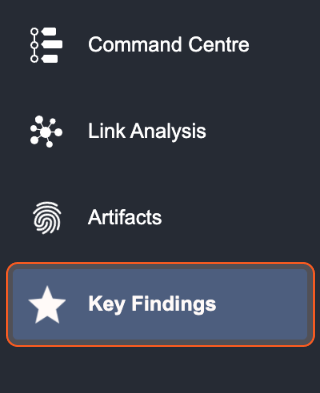
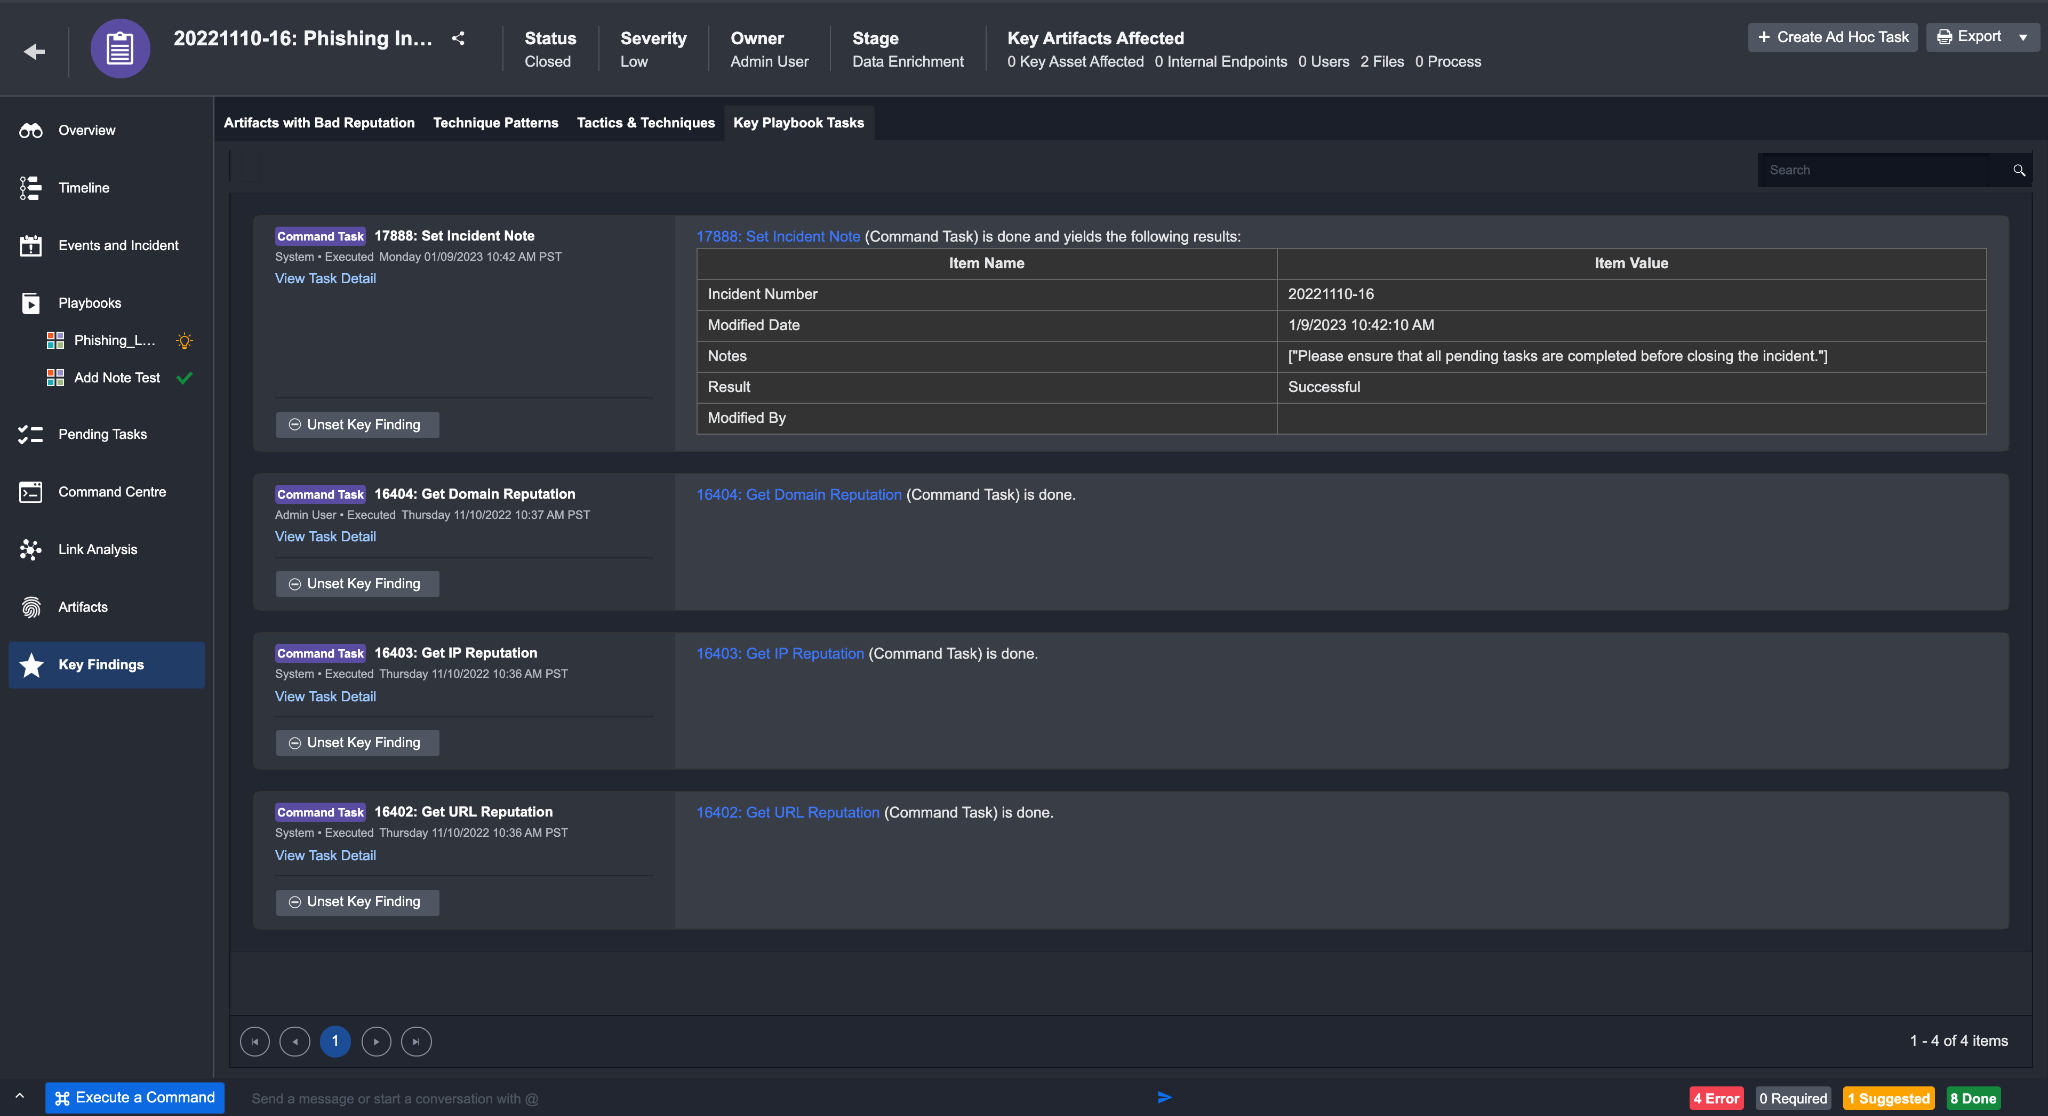
Key Findings
The Key Findings tab displays all relevant information about Artifacts, Tactic, Technique and Playbook Tasks. You can manually add an item to this list by clicking on Set as Key Finding on that item.
Artifacts with Bad Reputation - Artifacts with a bad reputation (Low, Medium, High) at the time of ingestion will automatically be added to this list.
Technique Patterns - This table summarizes the technique search strings used to tag an event with a certain tactic and technique.
Tactics & Techniques - This table summarizes the Tactics & Techniques found in the events and the incident.
Key Playbook Tasks - Any Playbook Tasks set as a key finding will be displayed here