
Vulcan Cyber
LAST UPDATED: AUG 5, 2025
Overview
Vulcan Cyber helps businesses reduce cyber risk through measurable cloud and application security. The Vulcan platform orchestrates and tracks the remediation lifecycle from scan to fix by prioritizing vulnerabilities, curating and delivering the best remedies, and automating processes and fixes through the last mile of remediation.
D3 SOAR is providing REST operations to function with Vulcan Cyber.
Vulcan Cyber is available for use in:
Known Limitations
Default API call limit:
Limit per Minute: 60 calls
Limit per Hour: 1,000 calls
Limit per Day: 10,000 calls
READER NOTE
The API call limit is configurable. To configure the API call limit, contact your Customer Success Manager at Vulcan.
Connection
To connect to Vulcan Cyber from D3 SOAR, please follow this part to collect the required information below:
Parameter | Description | Example |
Server URL | The server URL of the Vulcan Cyber API. | https://*****.com |
API Token | The API token for authentication. Obtain your API token by navigating to Vulcan Cyber platform's Settings > Account > API Token section. | api**********K8o |
Version | The version of the API to use for the connection. | v1 |
Permission Requirements
Each endpoint in the Vulcan Cyber API requires a certain permission scope. The following are required scopes for the commands in this integration:
Command | Required Permission |
Attach Or Detach Tags | No permission needed |
Fetch Event | Enable Vulnerabilities (no sub permission required) |
Get CVE Solutions | No permission needed |
Get Hosts | Enable Assets (no sub permission needed) |
Get Vulnerability Details | Enable Vulnerabilities (no sub permission needed) |
Get Vulnerability Tags | No permission needed |
List Hosts | Enable Assets (no sub permission needed) |
List Vulnerabilities | Enable Vulnerabilities (no sub permission needed) |
List Vulnerability Tags | No permission needed |
Test Connection | No permission needed |
As Vulcan Cyber is using role-based access control (RBAC), the API token is generated based on a specific user account and the application. Therefore, the command permissions are inherited from the user account’s role. Users need to configure their user profile from the Vulcan Cyber console for each command in this integration.
READER NOTE
Your API token's permissions are determined by your user role. If you wish to set up custom roles, refer to this guide on managing roles and role-based access control. For more information on access and permissions, refer to the Access and Permissions section of the Working with Vulcan API document.
Configuring Vulcan Cyber to Work with D3 SOAR
Log in to Vulcan Cyber.
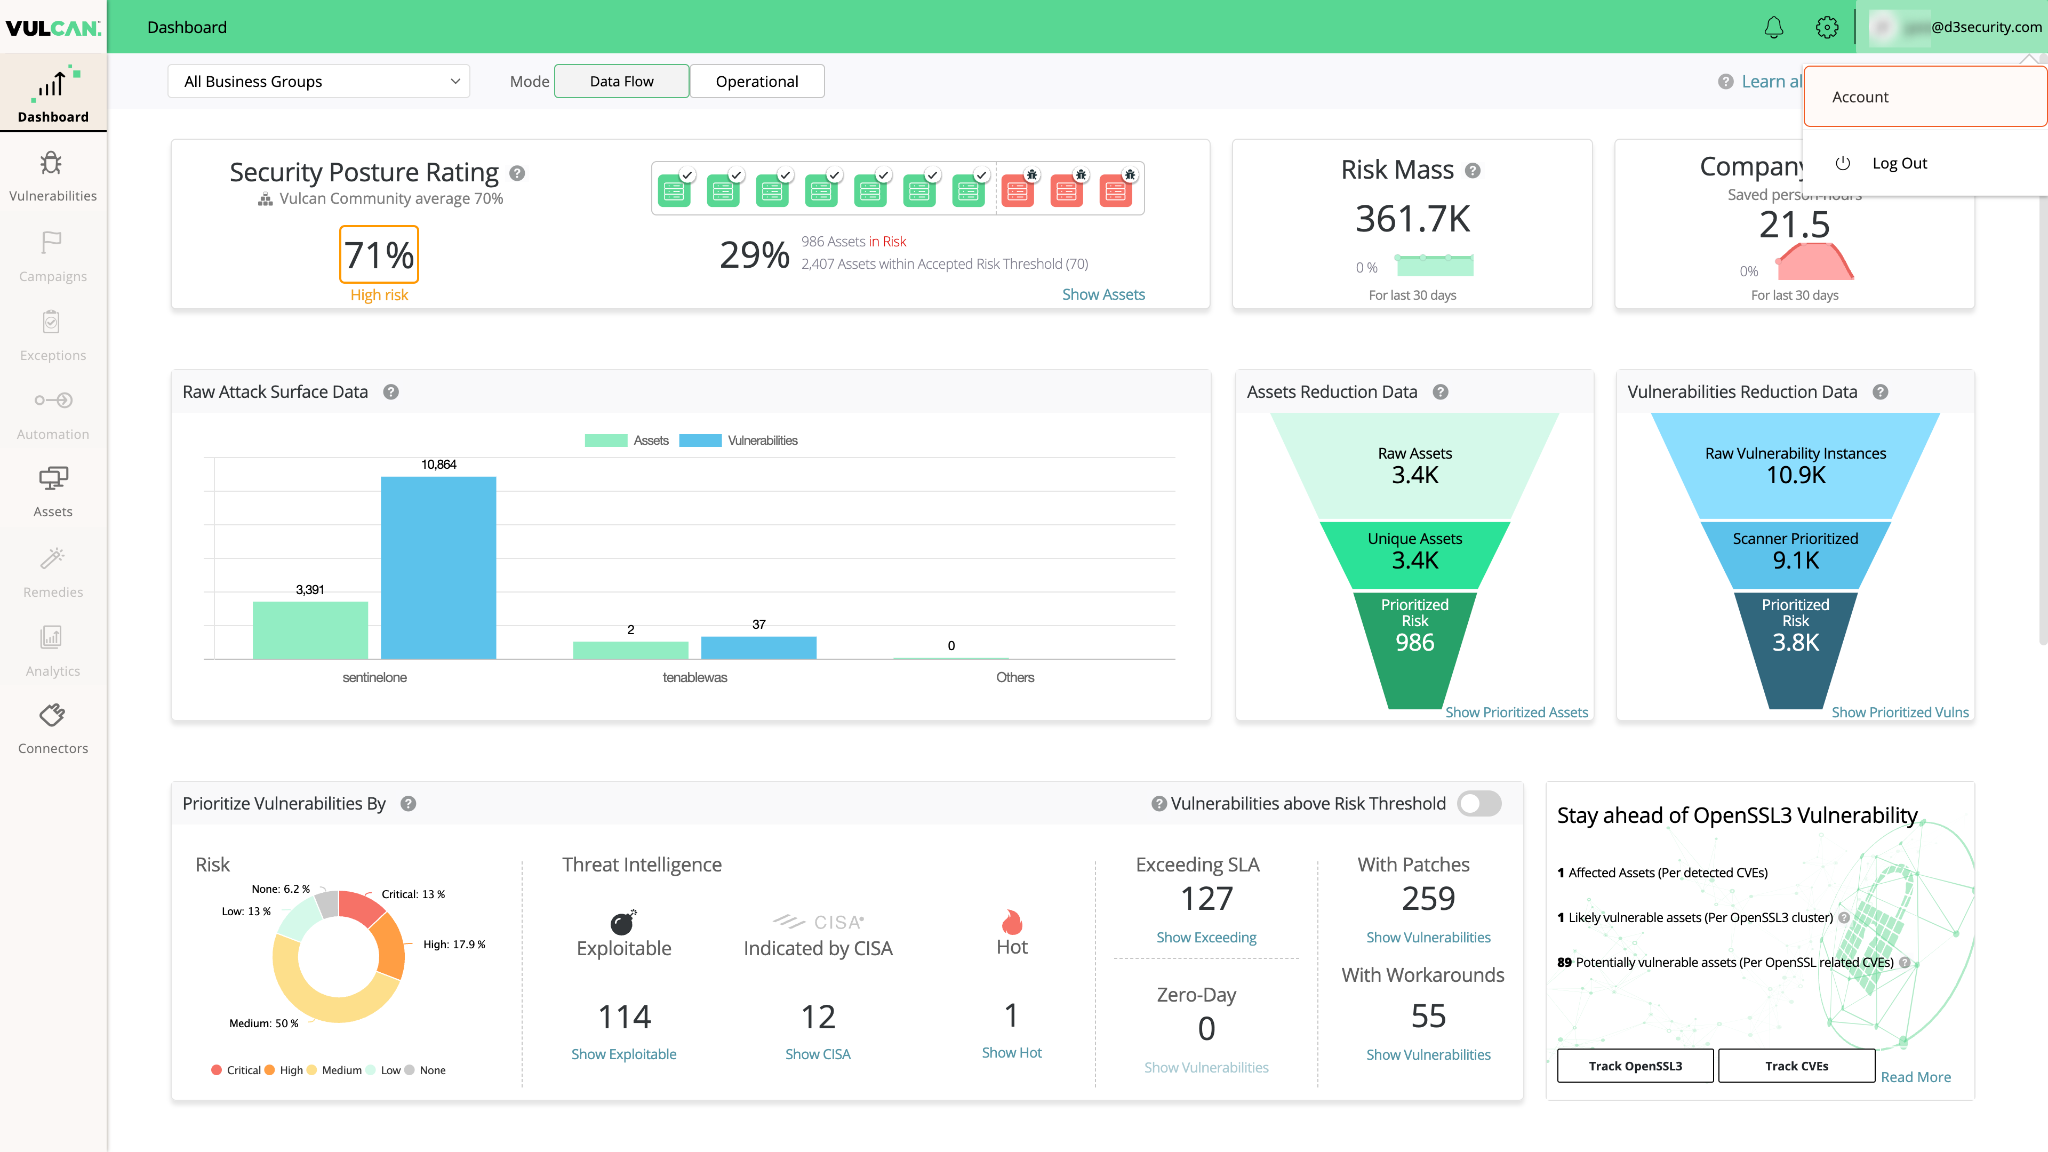
Click on your user account name in the top right corner, then click Account.
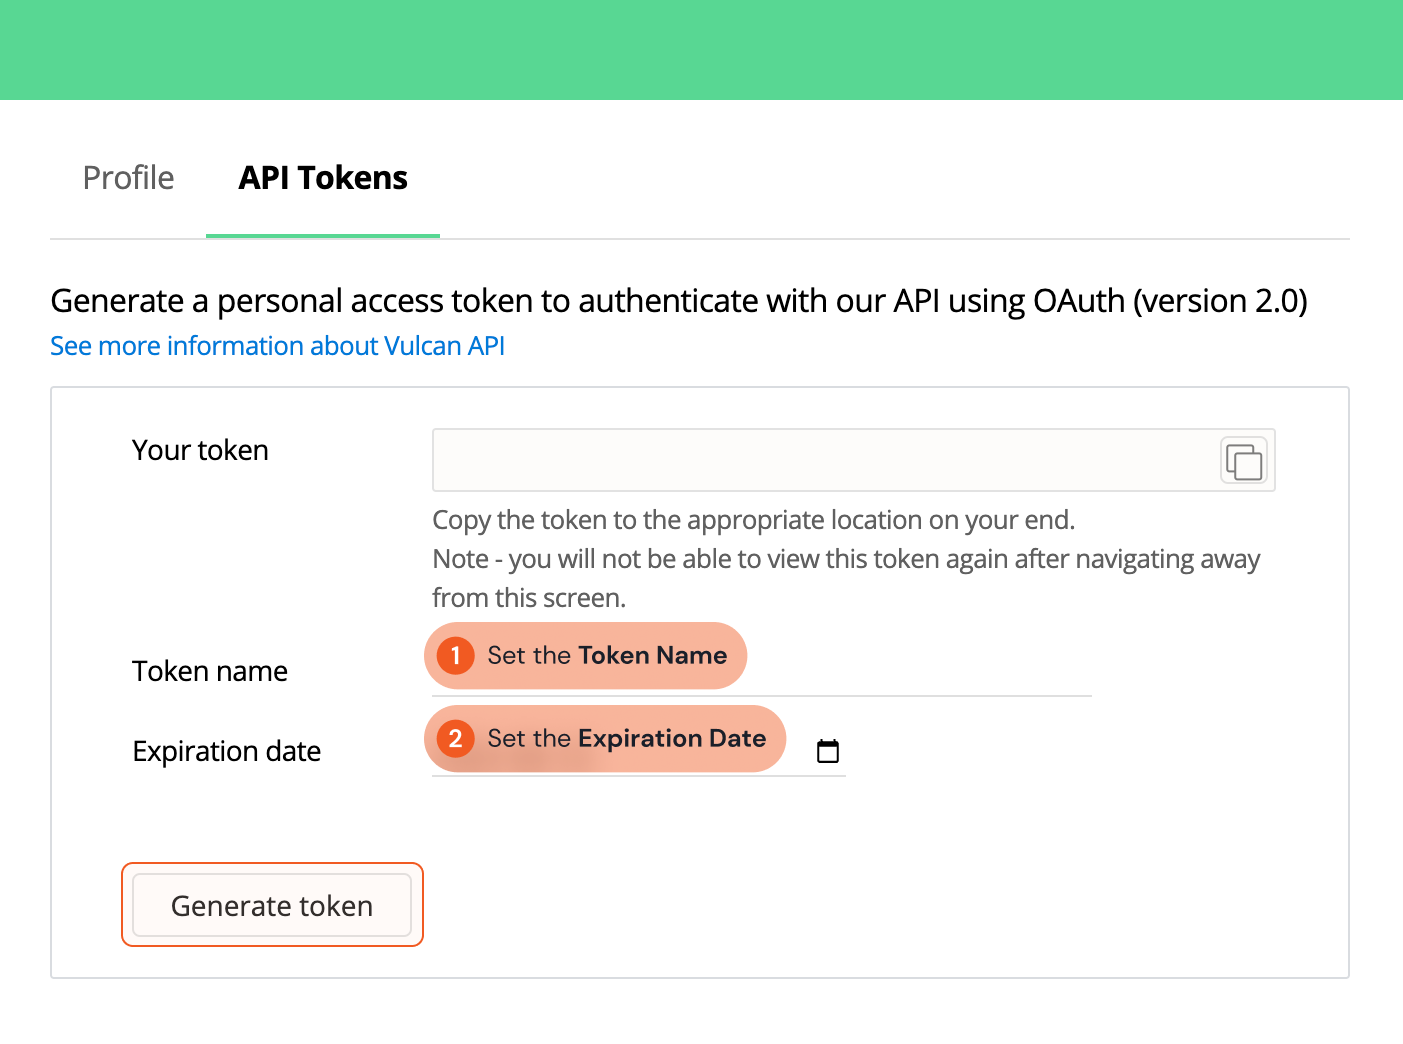
Select the API Tokens tab. Set the Token Name and Expiration Date, then click Generate token. Save the generated token in a secure location, it will be required to build a connection in D3 SOAR.
READER NOTE
Your API token's permissions are determined by your user role. If you wish to set up custom roles, refer to this guide on managing roles and role-based access control. To select and assign roles to users, visit this article on managing users. For the minimum required permissions of each command, refer to Permission Requirements for more details.
Configuring D3 SOAR to Work with Vulcan Cyber
Log in to D3 SOAR.
Find the Vulcan Cyber integration.
-20241017-213442.png?inst-v=fa469746-d1c7-472a-b81a-76eb810dbe97)
Navigate to Configuration on the top header menu.
Click on the Integration icon on the left sidebar.
Type Vulcan Cyber in the search box to find the integration, then click it to select it.
Click + Connection, on the right side of the Connections section. A new connection window will appear.
Configure the following fields to create a connection to Vulcan Cyber.
-20241017-213423.png?inst-v=fa469746-d1c7-472a-b81a-76eb810dbe97)
Connection Name: The desired name for the connection.
Site: Specifies the site to use the integration connection. Use the drop-down menu to select the site. The Share to Internal Sites option enables all sites defined as internal sites to use the connection. Selecting a specific site will only enable that site to use the connection.
Recipient site for events from connections Shared to Internal Sites: This field appears if you selected Share to Internal Sites for Site to let you select the internal site to deploy the integration connection.
Agent Name (Optional): Specifies the proxy agent required to build the connection. Use the dropdown menu to select the proxy agent from a list of previously configured proxy agents.
Description (Optional): Add your desired description for the connection.
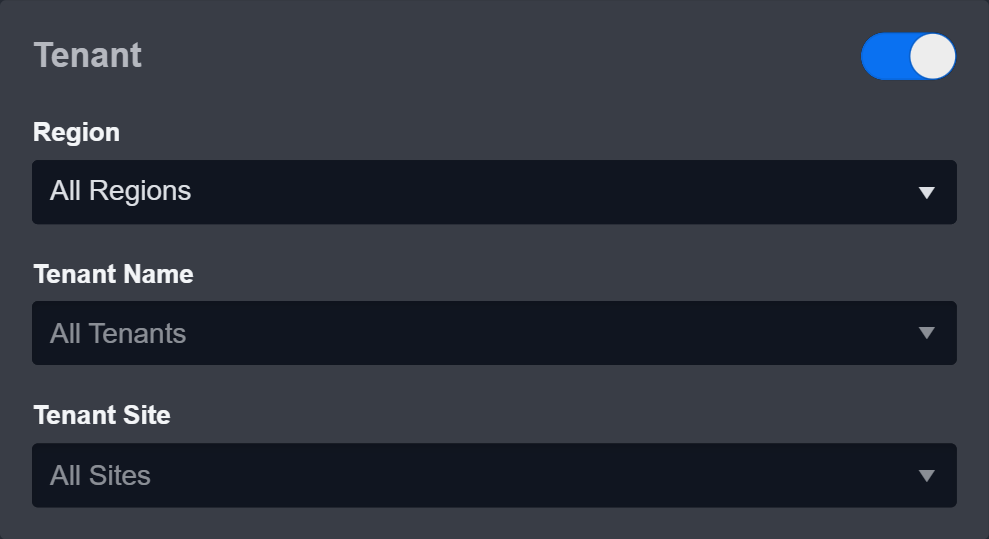
Tenant (Optional): When configuring the connection from a master tenant site, you have the option to choose the specific tenant sites you want to share the connection with. Once you enable this setting, you can filter and select the desired tenant sites from the dropdowns to share the connection.
Configure User Permissions: Defines which users have access to the connection.
Active: Check the tick box to ensure the connection is available for use.
-20241017-213301.png?inst-v=fa469746-d1c7-472a-b81a-76eb810dbe97)
System: This section contains the parameters defined specifically for the integration. These parameters must be configured to create the integration connection.
1. Input the Server URL.
2. Input the saved API Key. (Refer to step 3 of Configuring Vulcan Cyber to Work with D3 SOAR).
3. Input the API Version. The default value is v1.Connection Health Check: Updates the connection status you have created. A connection health check is done by scheduling the Test Connection command of this integration. This can only be done when the connection is active.
To set up a connection health check, check the Connection Health Check tick box. You can customize the interval (minutes) for scheduling the health check. An email notification can be set up after a specified number of failed connection attempts.
Test the connection.
-20241017-213738.png?inst-v=fa469746-d1c7-472a-b81a-76eb810dbe97)
Click Test Connection to verify the account credentials and network connection. If the Test Connection Passed alert window appears, the test connection is successful. You will see Passed with a green checkmark appear beside the Test Connection button. If the test connection fails, please check your connection parameters and try again.
Click OK to close the alert window.
Click + Add to create and add the configured connection.
Commands
Vulcan Cyber includes the following executable commands for users to set up schedules or create playbook workflows. With the Test Command, you can execute these commands independently for playbook troubleshooting.
Integration API Note
For more information about the Vulcan Cyber API, please refer to the Vulcan Cyber API reference.
READER NOTE
Certain permissions are required for each command. Please refer to the Permission Requirements and Configuring Vulcan Cyber to Work with D3 SOAR for details.
Note for Time-related parameters
The input format of time-related parameters may vary based on your account settings. As a result, the sample data provided in our commands is different from what you see. To set your preferred time format, follow these steps:
Navigate to Configuration > Application Settings. Select Date/Time Format.
-20241017-213508.png?inst-v=fa469746-d1c7-472a-b81a-76eb810dbe97)
Choose your desired date and time format.
-20241017-213811.png?inst-v=fa469746-d1c7-472a-b81a-76eb810dbe97)
After that, you will be able to view your preferred time format when configuring the DateTime input parameters for commands.
Attach Or Detach Tags
Updates vulnerability tags on the specified vulnerabilities.
READER NOTE
The parameter Vulnerability IDs is required to run this command.
Run the List Vulnerabilities command to obtain Vulnerability IDs. Vulnerability IDs can be found in the returned raw data at the path $.results.vulnerable[*].id.
Attach Vulnerability Tag IDs and Detach Vulnerability Tag IDs are optional parameters to run this command.
Run the List Vulnerability Tags command to obtain Attach Vulnerability Tag IDs. Attach Vulnerability Tag IDs can be found in the returned raw data at the path $[*].id.
Run the Get Vulnerability Tags command to obtain Detach Vulnerability Tag IDs. Detach Vulnerability Tag IDs can be found in the returned raw data at the path $.results[*].tags[*]. Please note the Vulnerability ID must match the Detach Vulnerability Tag IDs if detach action is needed.
If you omit both optional parameters, the command will run without performing any operations.
Input
Input Parameter | Required/Optional | Description | Example |
Vulnerability IDs | Required | The IDs of the vulnerabilities to retrieve vulnerability tags. Vulnerability IDs can be obtained using the List Vulnerability command. |
JSON
|
Attach Vulnerability Tag IDs | Optional | The IDs of the vulnerability tags to attach to the specified vulnerabilities. Vulnerability tag IDs can be obtained using the List Vulnerability Tags command. Note: If the vulnerabilities already have the tags you are trying to attach, the command will run without an error. |
JSON
|
Detach Vulnerability Tag IDs | Optional | The IDs of the vulnerability tags to detach from the specified vulnerabilities. Vulnerability tag IDs can be obtained using the List Vulnerability Tags command. Note: If the vulnerabilities do not have the tags you are trying to detach, the command will run without an error. |
JSON
|
Output
Error Handling
If the Return Data is Failed, an Error tab will appear in the Test Result window.
The error tab contains the details responded from D3 SOAR or third-party API calls, including Failure Indicator, Status Code, and Message. This can help you locate the root cause of a command failure.
Parts in Error | Description | Example |
Failure Indicator | Indicates the command failure that happened at a specific input and/or API call. | Attach Or Detach Tags failed. |
Status Code | The response code issued by the third-party API server or the D3 SOAR system that can be used to locate the corresponding error category. For example, if the returned status code is 401, the selected connection is unauthorized to run the command. The user or system support would need to check the permission setting in the Vulcan Cyber portal. Refer to the HTTP Status Code Registry for details. | Status Code: 404. |
Message | The raw data or captured key error message from the integration API server about the API request failure. | Message: Some Vulnerability IDs do not have tag: [2]. |
Error Sample Data Attach Or Detach Tags failed. Status Code: 404. Message: Some Vulnerability IDs do not have tag: [2]. |
Fetch Event
Returns vulnerabilities (as events) from Vulcan Cyber based on the specified criteria.
READER NOTE
All vulnerabilities will be returned if they meet the search criteria.
Input
Input Parameter | Required/Optional | Description | Example |
Start Time | Required | The start time of the time range to fetch vulnerabilities first seen after this timestamp, in UTC time. | 2023-06-15 00:00 |
End Time | Optional | The end time of the time range to fetch vulnerabilities last seen before this timestamp, in UTC time. If this parameter is not specified, the default end time is the current time. | 2023-03-10 00:00 |
CVSS Score | Optional | The minimum CVSS score to filter the returned vulnerabilities. | 8 |
Risk Levels | Optional | The risk levels to filter the returned vulnerabilities. The available risk levels are Critical, High, Medium, and Low. If no risk level is specified, vulnerabilities with any risk level will be returned. |
JSON
|
CVEs | Optional | The CVE IDs of the vulnerabilities to return. |
JSON
|
Operating Systems | Optional | The operating systems of the assets to filter related vulnerabilities. |
JSON
|
Vulnerability Sources | Optional | The sources of the vulnerabilities to return. |
JSON
|
Free Text Input | Optional | The free text search to filter the returned vulnerabilities. |
JSON
|
Output
Fetch Event Field Mapping
Please note that Fetch Event commands require event field mapping. Field mapping plays a key role in the data normalization process part of the event pipeline. Field mapping converts the original data fields from the different providers to the D3 fields which are standardized by the D3 Model. Please refer to Event and Incident Intake Field Mapping for details.
If you require a custom field mapping, click + Add Field to add a custom field mapping. You can also remove built-in field mappings by clicking x. Please note that two underscore characters will automatically prefix the defined Field Name as the System Name for a custom field mapping. Additionally, if an input Field Name contains any spaces, they will automatically be replaced with underscores for the corresponding System Name.
As a system integration, the Vulcan Cyber integration has some pre-configured field mappings for default field mapping.
Default Event Source
The Default Event Source is the default set of field mappings that are applied when this fetch event command is executed. For out-of-the-box integrations, you will find a set of field mapping provided by the system. Default event source provides field mappings for common fields from fetched events . The default event source has a “Main Event JSON Path” (i.e., $.all) that is used to extract a batch of events from the response raw data. Click Edit Main JSON Path to view the “Main Event JSON Path”.-20241017-214436.png?inst-v=fa469746-d1c7-472a-b81a-76eb810dbe97)
Main Event JSON Path: $.results
The Main Event JSON Path determines the root path where the system starts parsing raw response data into D3 event data. The JSON path begins with $, representing the root element. The path is formed by appending a sequence of child elements to $, each separated by a dot (.). Square brackets with nested quotation marks ([‘...’]) should be used to separate child elements in JSON arrays.
For example, the root node of a JSON Path is $.results. The child node denoting the Document ID field would be id. Putting it together, the JSON Path expression to extract the Asset Count is $.results.id.
The pre-configured field mappings are detailed below:
Field Name | Source Field |
|---|---|
Document ID | .id |
Event Type | .vuln_sources |
Start Time | .vulcan_discovery_time |
Operating system | .assets_os_versions |
Status | .status |
Tag | .tags |
Threat type | .threats |
CVE | .title |
Error Handling
If the Return Data is Failed, an Error tab will appear in the Test Result window.
The error tab contains the details responded from D3 SOAR or third-party API calls, including Failure Indicator, Status Code, and Message. This can help you locate the root cause of a command failure.
Parts in Error | Description | Example |
Failure Indicator | Indicates the command failure that happened at a specific input and/or API call. | Fetch Event failed. |
Status Code | The response code issued by the third-party API server or the D3 SOAR system that can be used to locate the corresponding error category. For example, if the returned status code is 401, the selected connection is unauthorized to run the command. The user or system support would need to check the permission setting in the Vulcan Cyber portal. Refer to the HTTP Status Code Registry for details. | Status Code: 403. |
Message | The raw data or captured key error message from the integration API server about the API request failure. | Message: Request failed, Forbidden. |
Error Sample Data Fetch Event failed. Status Code: 403. Message: Request failed, Forbidden. |
Get CVE Solutions
Returns the solutions list for the specified CVEs.
READER NOTE
The parameter CVE IDs is required to run this command.
Run the Fetch Event command to obtain CVE IDs. CVE IDs can be found in the returned raw data at the path $.all[*].title. Ensure the CVE ID is in the correct format: CVE-yyyy-#####. The Fetch Event command provides them as CVE-yyyy-##### (example). Remove the "(example)" segment before running the command.
Input
Input Parameter | Required/Optional | Description | Example |
CVE IDs | Required | The IDs of the CVEs to retrieve the solutions list. CVE IDs can be obtained using the Fetch Event command. |
JSON
|
Output
Error Handling
If the Return Data is Partially Successful or Failed, an Error tab will appear in the Test Result window.
The error tab contains the details responded from D3 SOAR or third-party API calls, including Failure Indicator, Status Code, and Message. This can help you locate the root cause of a command failure.
Parts in Error | Description | Example |
Failure Indicator | Indicates the command failure that happened at a specific input and/or API call. | Get CVE Solutions failed. |
Status Code | The response code issued by the third-party API server or the D3 SOAR system that can be used to locate the corresponding error category. For example, if the returned status code is 401, the selected connection is unauthorized to run the command. The user or system support would need to check the permission setting in the Vulcan Cyber portal. Refer to the HTTP Status Code Registry for details. | Status Code: 400. |
Message | The raw data or captured key error message from the integration API server about the API request failure. | Message: Request failed for CVE ID: xxx, Bad Request. |
Error Sample Data Get CVE Solutions failed. Status Code: 400. Message: Request failed for CVE ID: xxx, Bad Request. |
Get Hosts
Returns detailed information about the specified hosts, including any identified vulnerabilities.
READER NOTE
The parameter Host IDs is required to run this command.
Run the List Channels command to obtain Host IDs. Host IDs can be found in the returned raw data at the path $.data[*].id.
Input
Input Parameter | Required/Optional | Description | Example |
Host IDs | Required | The IDs of the hosts to retrieve. Host IDs can be obtained using the List Hosts command. |
JSON
|
Output
Error Handling
If the Return Data is Partially Successful or Failed, an Error tab will appear in the Test Result window.
The error tab contains the details responded from D3 SOAR or third-party API calls, including Failure Indicator, Status Code, and Message. This can help you locate the root cause of a command failure.
Parts in Error | Description | Example |
Failure Indicator | Indicates the command failure that happened at a specific input and/or API call. | Get Hosts failed. |
Status Code | The response code issued by the third-party API server or the D3 SOAR system that can be used to locate the corresponding error category. For example, if the returned status code is 401, the selected connection is unauthorized to run the command. The user or system support would need to check the permission setting in the Vulcan Cyber portal. Refer to the HTTP Status Code Registry for details. | Status Code: 404. |
Message | The raw data or captured key error message from the integration API server about the API request failure. | Message: Not found. |
Error Sample Data Get Hosts failed. Status Code: 404. Message: Not found. |
Get Vulnerability Details
Retrieves detailed information about the specified vulnerabilities.
READER NOTE
The parameter Vulnerability IDs is required to run this command.
Run the List Vulnerabilities command to obtain Vulnerability IDs. Vulnerability IDs can be found in the returned raw data at the path $.results.vulnerable[*].id.
Input
Input Parameter | Required/Optional | Description | Example |
Vulnerability IDs | Required | The IDs of the vulnearbilities to retrieve details. Vulnerability IDs can be obtained using the List Vulnerabilities command. |
JSON
|
Omit Assets | Optional | The option to omit asset information from the response. If this parameter is not specified, the default value is False. In this case, asset information will be included in the response. | True |
Output
Error Handling
If the Return Data is Partially Successful or Failed, an Error tab will appear in the Test Result window.
The error tab contains the details responded from D3 SOAR or third-party API calls, including Failure Indicator, Status Code, and Message. This can help you locate the root cause of a command failure.
Parts in Error | Description | Example |
Failure Indicator | Indicates the command failure that happened at a specific input and/or API call. | Get Vulnerability Details failed. |
Status Code | The response code issued by the third-party API server or the D3 SOAR system that can be used to locate the corresponding error category. For example, if the returned status code is 401, the selected connection is unauthorized to run the command. The user or system support would need to check the permission setting in the Vulcan Cyber portal. Refer to the HTTP Status Code Registry for details. | Status Code: 429. |
Message | The raw data or captured key error message from the integration API server about the API request failure. | Message: Request was throttled. Expected available in 25 seconds. |
Error Sample Data Get Vulnerability Details failed. Status Code: 429. Message: Request was throttled. Expected available in 25 seconds. |
Get Vulnerability Tags
Returns vulnerability tags attached to the specified vulnerabilities.
READER NOTE
The parameter Vulnerability IDs is required to run this command.
Run the List Vulnerabilities command to obtain Vulnerability IDs. Vulnerability IDs can be found in the returned raw data at the path $.results.vulnerable[*].id.
If the provided specified vulnerability lacks any associated tags, an error will occur: "Error - Missing tags for certain Vulnerability IDs: [tag#]."
Input
Input Parameter | Required/Optional | Description | Example |
Vulnerability IDs | Required | The IDs of the vulnearbilities to retrieve tags. Vulnerability IDs can be obtained using the List Vulnerabilities command. |
JSON
|
Output
Error Handling
If the Return Data is Partially Successful or Failed, an Error tab will appear in the Test Result window.
The error tab contains the details responded from D3 SOAR or third-party API calls, including Failure Indicator, Status Code, and Message. This can help you locate the root cause of a command failure.
Parts in Error | Description | Example |
Failure Indicator | Indicates the command failure that happened at a specific input and/or API call. | Get Vulnerability Tags failed. |
Status Code | The response code issued by the third-party API server or the D3 SOAR system that can be used to locate the corresponding error category. For example, if the returned status code is 401, the selected connection is unauthorized to run the command. The user or system support would need to check the permission setting in the Vulcan Cyber portal. Refer to the HTTP Status Code Registry for details. | Status Code: 404. |
Message | The raw data or captured key error message from the integration API server about the API request failure. | Message: Some Vulnerability IDs do not have tag: [1]. |
Error Sample Data Get Vulnerability Tags failed. Status Code: 404. Message: Some Vulnerability IDs do not have tag: [1]. |
List Hosts
Returns all accessible hosts matching the given search criteria.
READER NOTE
The parameter Vulnerability Tags is optional to run this command.
Run the List Vulnerability Tags command to obtain Vulnerability Tags. Vulnerability Tags is referring to Vulnerability Tag IDs. Vulnerability Tag IDs can be found in the returned raw data at the path $[*].id.
If no parameters are defined, all hosts will be returned.
Input
Input Parameter | Required/Optional | Description | Example |
Host Names | Optional | The names of the hosts to retrieve. Both full and partial names are supported. |
JSON
|
Host IPs | Optional | The IP addresses of the hosts to retrieve. Both full and partial addresses are supported. |
JSON
|
Risk Level | Optional | The risk levels to filter the returned hosts. The available risk levels are Critical, High, Medium, and Low. If no risk level is specified, hosts with any risk level will be returned. | Critical |
Operating System | Optional | The operating systems of the hosts to return. If no operating system is specified, hosts of any operating systems will be returned. | Windows |
Vulnerability Tags | Optional | The IDs of the vulnerability tags identified on the hosts to retrieve. Vulnerability tag IDs can be obtained using the List Vulnerability Tags command. |
JSON
|
Sources | Optional | The sources of the hosts to retrieve. If no source is specified, hosts from all sources will be returned. |
JSON
|
Output
Error Handling
If the Return Data is Failed, an Error tab will appear in the Test Result window.
The error tab contains the details responded from D3 SOAR or third-party API calls, including Failure Indicator, Status Code, and Message. This can help you locate the root cause of a command failure.
Parts in Error | Description | Example |
Failure Indicator | Indicates the command failure that happened at a specific input and/or API call. | List Hosts failed. |
Status Code | The response code issued by the third-party API server or the D3 SOAR system that can be used to locate the corresponding error category. For example, if the returned status code is 401, the selected connection is unauthorized to run the command. The user or system support would need to check the permission setting in the Vulcan Cyber portal. Refer to the HTTP Status Code Registry for details. | Status Code: 400. |
Message | The raw data or captured key error message from the integration API server about the API request failure. | Message: Name or service not known. |
Error Sample Data List Hosts failed. Status Code: 400. Message: Name or service not known. |
List Vulnerabilities
Returns vulnerabilities from Vulcan Cyber based on the specified criteria.
Input
Input Parameter | Required/Optional | Description | Example |
Last N Days | Required | The count of days to retrieve vulnerabilities before the current time. | 7 |
CVSS Score | Optional | The minimum CVSS score to filter the returned vulnerabilities. | 8 |
Risk Levels | Optional | The risk levels to filter the returned vulnerabilities. The available risk levels are Critical, High, Medium, and Low. If no risk level is specified, vulnerabilities with any risk level will be returned. |
JSON
|
CVEs | Optional | The CVE IDs of the vulnerabilities to return. |
JSON
|
Operating Systems | Optional | The operating systems of the assets to filter related vulnerabilities. |
JSON
|
Vulnerability Sources | Optional | The sources of the vulnerabilities to return. |
JSON
|
Free Text Input | Optional | The free text search to filter the returned vulnerabilities. |
JSON
|
Output
Error Handling
If the Return Data is Failed, an Error tab will appear in the Test Result window.
The error tab contains the details responded from D3 SOAR or third-party API calls, including Failure Indicator, Status Code, and Message. This can help you locate the root cause of a command failure.
Parts in Error | Description | Example |
Failure Indicator | Indicates the command failure that happened at a specific input and/or API call. | List Vulnerabilities failed. |
Status Code | The response code issued by the third-party API server or the D3 SOAR system that can be used to locate the corresponding error category. For example, if the returned status code is 401, the selected connection is unauthorized to run the command. The user or system support would need to check the permission setting in the Vulcan Cyber portal. Refer to the HTTP Status Code Registry for details. | Status Code: 403. |
Message | The raw data or captured key error message from the integration API server about the API request failure. | Message: Request failed, Forbidden. |
Error Sample Data List Vulnerabilities failed. Status Code: 403. Message: Request failed, Forbidden. |
List Vulnerability Tags
Returns all vulnerability tags.
Input
N/A
Output
Error Handling
If the Return Data is Failed, an Error tab will appear in the Test Result window.
The error tab contains the details responded from D3 SOAR or third-party API calls, including Failure Indicator, Status Code, and Message. This can help you locate the root cause of a command failure.
Parts in Error | Description | Example |
Failure Indicator | Indicates the command failure that happened at a specific input and/or API call. | List Vulnerability Tags failed. |
Status Code | The response code issued by the third-party API server or the D3 SOAR system that can be used to locate the corresponding error category. For example, if the returned status code is 401, the selected connection is unauthorized to run the command. The user or system support would need to check the permission setting in the Vulcan Cyber portal. Refer to the HTTP Status Code Registry for details. | Status Code: 400. |
Message | The raw data or captured key error message from the integration API server about the API request failure. | Message: Name or service not known. |
Error Sample Data List Vulnerability Tags failed. Status Code: 400. Message: Name or service not known. |
Test Connection
Allows you to perform a health check on an integration connection. You can schedule a periodic health check by selecting Connection Health Check when editing an integration connection.
Input
N/A
Output
Error Handling
If the Return Data is Failed, an Error tab will appear in the Test Result window.
The error tab contains the details responded from D3 SOAR or third-party API calls, including Failure Indicator, Status Code, and Message. This can help you locate the root cause of a command failure.
Parts in Error | Description | Example |
Failure Indicator | Indicates the command failure that happened at a specific input and/or API call. | Test Connection failed. Failed to check the connector. |
Status Code | The response code issued by the third-party API server or the D3 SOAR system that can be used to locate the corresponding error category. For example, if the returned status code is 401, the selected connection is unauthorized to run the command. The user or system support would need to check the permission setting in the Vulcan Cyber portal. Refer to the HTTP Status Code Registry for details. | Status Code: 400. |
Message | The raw data or captured key error message from the integration API server about the API request failure. | Message: Name or service not known. |
Error Sample Data Test Connection failed. Failed to check the connector. Status Code: 400. Message: Name or service not known. |