
Syslog Sender
LAST UPDATED: AUG 5, 2025
Overview
The Syslog Sender integration sends event data to a specified remote syslog server using either TCP or UDP. Messages are formatted in accordance with RFC 5424. The integration supports both plain text and structured JSON message formats. It dynamically calculates the syslog priority based on the configured log level and facility.
D3 SOAR is providing REST operations to function with Syslog Sender.
Syslog Sender is available for use in:
D3 SOAR | V17.1+ |
Category | Other |
Deployment Options |
Connection
To connect to the Syslog Sender integration from D3 SOAR, gather the following information:
Parameter | Description | Example |
Server URL | The IP address or hostname of the remote syslog server to which events will be sent. If forwarding events to a SIEM platform, this should be the IP address or DNS name of the SIEM instance. | 192.168.86.85 |
Port | The network port used to send syslog messages to the remote server. By default, the value is 514. | 1514 |
Configuring D3 SOAR to Work with Syslog Sender
Log in to D3 SOAR.
Find the Syslog Sender integration.
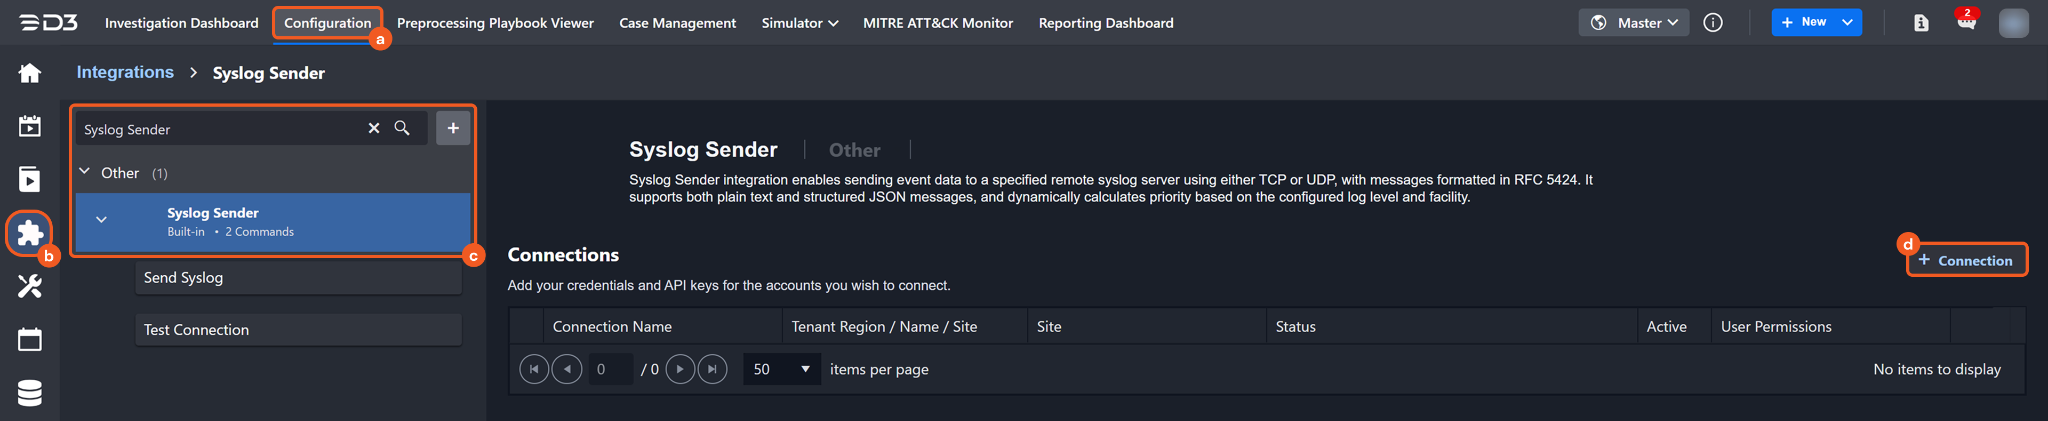
Navigate to Configuration on the top header menu.
Click on the Integration icon on the left sidebar.
Type Syslog Sender in the search box to find the integration, then click it to select it.
Click on the + Connection button on the right side of the Connections section. A new connection window will appear.
Configure the following fields to create a connection to Syslog Sender.
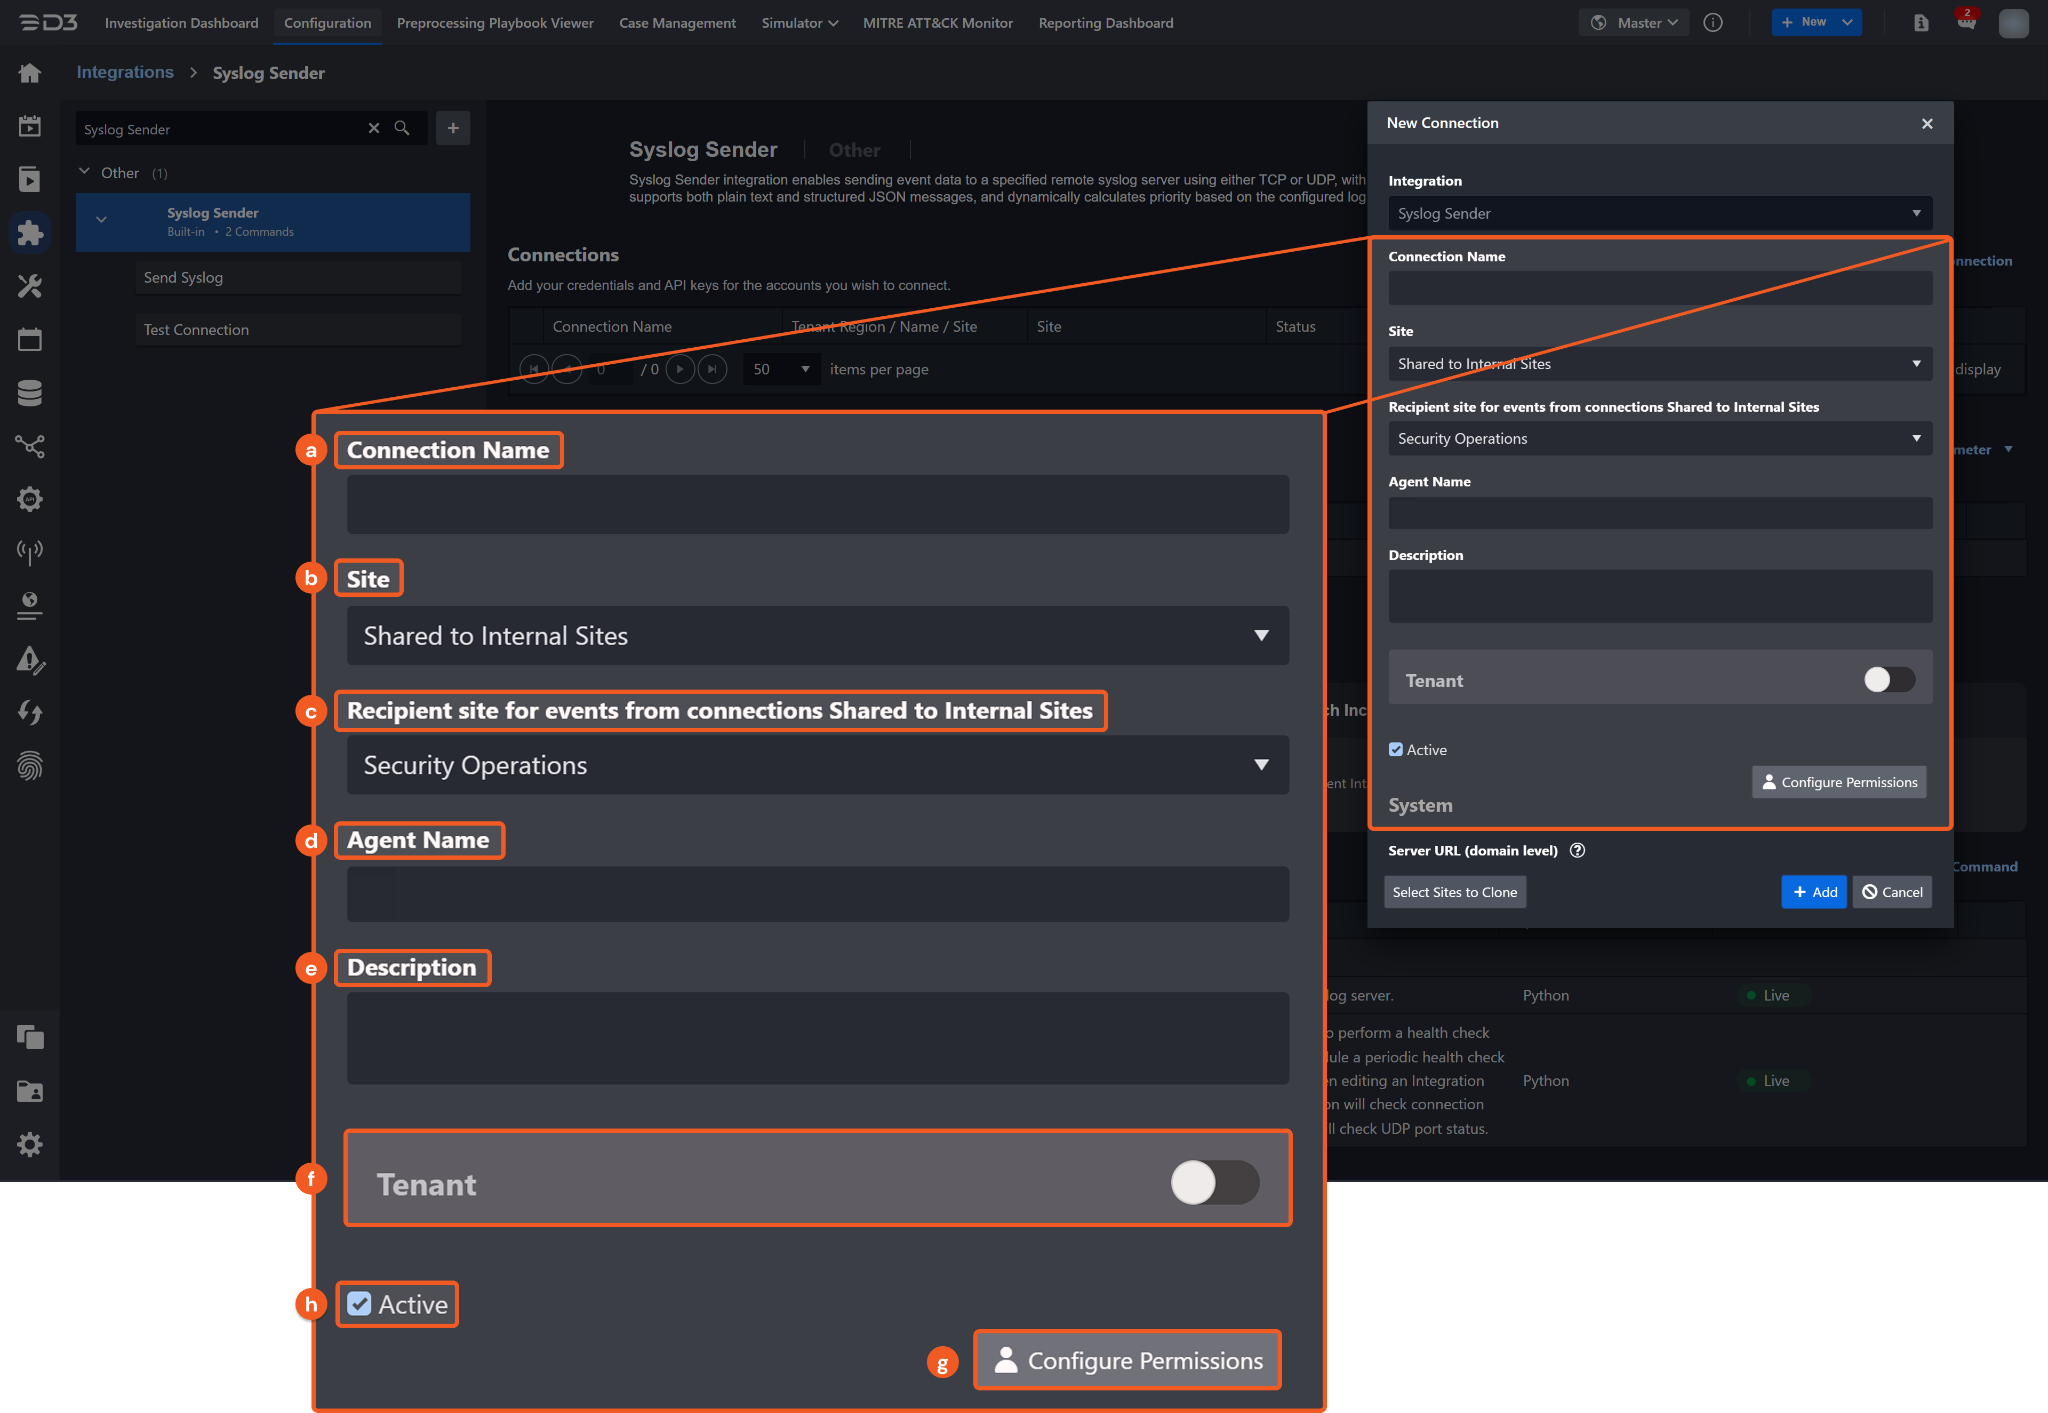
Connection Name: The desired name for the connection.
Site: The site on which to use the integration connection. Use the drop-down menu to select the site. The Share to Internal Sites option enables all internal sites to use the connection. Selecting a specific site will only enable that site to use the connection.
Recipient site for events from connections Shared to Internal Sites: This field is displayed when Share to Internal Sites is selected for the Site field, allowing selection of the internal site for deploying the integration connection.
Agent Name (Optional): The proxy agent required to build the connection. Use the dropdown menu to select the proxy agent from a list of previously configured proxy agents.
Description (Optional): The description for the connection.
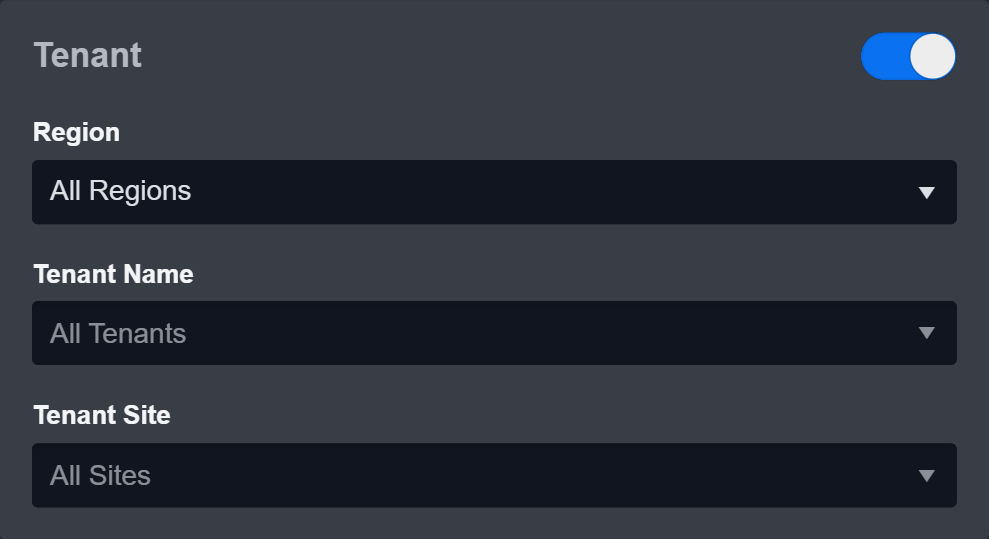
Tenant (Optional): When configuring the connection from a master tenant site, users can choose the specific tenant sites with which to share the connection. Once this setting is enabled, users can filter and select the desired tenant sites from the dropdowns to share the connection.
Configure User Permissions: Defines which users have access to the connection.
Active: The checkbox that enables the connection to be used when selected.
-20250422-003135.png?inst-v=98144c3d-76ae-458a-9ca9-3e308e46059b)
System: This section contains the parameters defined specifically for the integration. These parameters must be configured to create the integration connection.
1. Input the Server URL.
2. Input the Port.
3. Input the Protocol.Enable Password Vault: An optional feature that allows users to take the stored credentials from their own password vault. Refer to the password vault connection guide if needed.
Connection Health Check: Periodically checks the connection status by scheduling the Test Connection command at the specified interval (in minutes). Available only for active connections, this feature also allows configuring email notifications for failed attempts.
Test the connection.
Click on the Test Connection button to verify credentials and connectivity. A success alert displays Passed with a green checkmark. If the connection fails, review the parameters and retry.
Click OK to close the alert window.
Click + Add to create and add the configured connection.
Commands
Syslog Sender includes the following executable commands for users to set up schedules or create playbook workflows. With the Test Command function, users can execute these commands independently for playbook troubleshooting.
Integration API Note
For more information about the Syslog Sender API, refer to the Syslog Sender API reference.
Send Syslog
Sends a syslog event to the specified remote syslog server.
Input
Input Parameter | Required/Optional | Description | Example |
Level | Optional | The severity level of the syslog message. This value determines the message priority (PRI) in combination with the selected facility. Supported values, from lowest to highest severity, are: DEBUG, INFO, NOTICE, WARNING, ERROR, CRITICAL, ALERT, and EMERGENCY. By default, the value is INFO. | WARNING |
Facility | Optional | The syslog facility code that identifies the type or origin of the message, such as system, application, or security. This value is combined with the log level to calculate the priority (PRI) field in the syslog header. By default, the value is Local 0. | User |
Message | Required | The content of the syslog message to be sent. This can be a plain text string, a JSON-formatted string, or a custom message payload. The message appears as the final part of the syslog entry and may include event details, status information, logs, or alerts. |
JSON
|
Output
To view the sample output data for all commands, refer to this article.
Error Sample Data Send Syslog failed. Status Code: 403. Message: You must have a valid Support account to call this API. |
Test Connection
Allows users to perform a health check on an integration connection. Users can schedule a periodic health check by selecting Connection Health Check when editing an integration connection.
Input
N/A
Output
Output Type | Description | Return Data Type |
Return Data | Indicates one of the possible command execution states: Successful or Failed. The Failed state can be triggered by any of the following errors:
More details about an error can be viewed in the Error tab. | String |
Error Handling
If the Return Data displays Failed, an Error tab will appear in the Test Result window.
The error tab contains the details responded from D3 SOAR or third-party API calls, including Failure Indicator, Status Code, and Message. This can help locate the root cause of a command failure.
Parts in Error | Description | Example |
Failure Indicator | Indicates the command failure that happened at a specific input and/or API call. | Test Connection failed. Failed to check the connector. |
Status Code | The response code issued by the third-party API server or the D3 SOAR system that can be used to locate the corresponding error category. For example, if the returned status code is 401, the selected connection is unauthorized to run the command. The user or system support would need to check the permission setting in the Syslog Sender portal. Refer to the HTTP Status Code Registry for details. | Status Code: 403. |
Message | The raw data or captured key error message from the integration API server about the API request failure. | Message: You must have a valid support account to call this API. |
Error Sample Data Test Connection failed. Failed to check the connector. Status Code: 403. Message: You must have a valid Support account to call this API |