
Stellar Cyber V2
LAST UPDATED: AUG 5, 2025
Overview
Stellar Cyber Starlight enables organizations to automatically detect and thwart attacks on their critical data systems before damage is done or data is lost and deploys easily in any computing and network environment.
D3 Security's integration with Stellar Cyber Starlight provides the operation to ingest cases/events from the Stellar Cyber platform, generate events in the D3 platform for correlation and investigation. Also, D3 supports the ability for the bi-direction operations for cases/events in Stellar Cyber. Stellar Cyber Starlight integration is based on Help Version 5.0.4.
D3 SOAR is providing REST operations to function with Stellar Cyber V2.
Stellar Cyber V2 is available for use in:
Connection
To connect to Stellar Cyber V2 from D3 SOAR, please follow this part to collect the required information below:
Parameter | Description | Example |
Server URL (domain level) | The server URL of the Stellar Cyber environment. | https://*****.***/*** |
Username | The email address used to authenticate the connection. | ***@*****.*** |
API Token | The API token to authenticate the connection. | 2di*****SaH |
Is Manager Account | The option to specify whether the user account is a manager account. Selecting False will give you the option to input a tenant ID. | True |
Tenant ID | The Tenant ID for the connector. This input parameter is optional. | f25****fb5 |
Version | The version of the API to use for the connection. | v1 |
Permission Requirements
Each endpoint in the Stellar Cyber V2 API requires a certain permission scope. The following are required user privileges to run the commands in this integration:
Root scope (pertaining to User Scope)
Super Admin privileges (pertaining to User Privilege)
As Stellar Cyber V2 is using role-based access control (RBAC), the API token is generated based on a specific user account and the application. Therefore, the command permissions are inherited from the user account’s role. Users need to configure their user profile from the Stellar Cyber V2 console for each command in this integration.
Configuring Stellar Cyber V2 to Work with D3 SOAR
Log in to Stellar Cyber. Navigate to System > Administration > Users. Select the option to Add a New User.
Set the correct privileges for the users to enable API interactions. Under User Scope, choose the Root option. For User Privilege, select Super Admin.
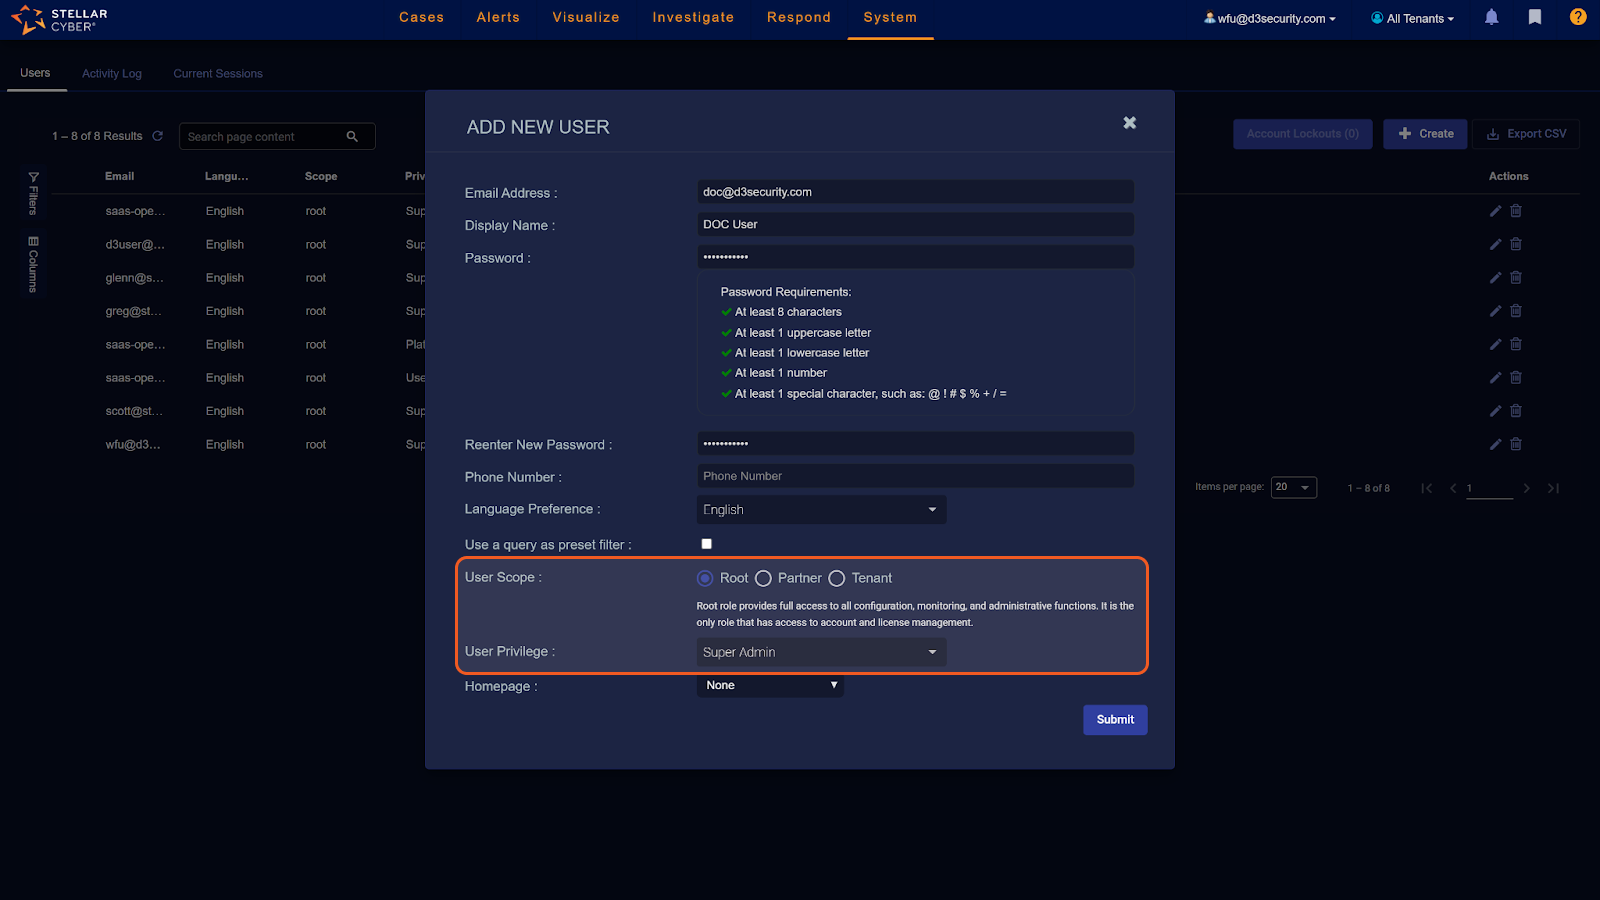
READER NOTE
Assigning any privileges other than those specified will inhibit the generation of the API token.
After creating the user with the specified privileges, locate the account in the user list. Use the option to Generate Token for this user. You will only be able to view the token once, ensure you save it in a secure location.
Configuring D3 SOAR to Work with Stellar Cyber V2
Log in to D3 SOAR.
Find the Stellar Cyber V2 integration.
Navigate to Configuration on the top header menu.
Click on the Integration icon on the left sidebar.
Type Stellar Cyber V2 in the search box to find the integration, then click it to select it.
Click + Connection, on the right side of the Connections section. A new connection window will appear.
Configure the following fields to create a connection to Stellar Cyber V2.
Connection Name: The desired name for the connection.
Site: The site on which to use the integration connection. Use the drop-down menu to select the site. The Share to Internal Sites option enables all internal sites to use the connection. Selecting a specific site will only enable that site to use the connection.
Recipient site for events from connections Shared to Internal Sites: This field is displayed when Share to Internal Sites is selected for the Site field, allowing selection of the internal site for deploying the integration connection.
Agent Name (Optional): The proxy agent required to build the connection. Use the dropdown menu to select the proxy agent from a list of previously configured proxy agents.
Description (Optional): The description for the connection.
Tenant (Optional): When configuring the connection from a master tenant site, users can choose the specific tenant sites with which to share the connection. Once this setting is enabled, users can filter and select the desired tenant sites from the dropdowns to share the connection.
Configure User Permissions: Defines which users have access to the connection.
Active: The checkbox that enables the connection to be used when selected.
System: This section contains the parameters defined specifically for the integration. These parameters must be configured to create the integration connection.
1. Input the Server URL.
2. Input your Username. Refer to step 2 of Configuring Stellar Cyber V2 to Work with D3 SOAR for more information.
3. Input the API Token. Refer to step 2 of Configuring Stellar Cyber V2 to Work with D3 SOAR for more information.
4. For the Is Manager Account, select True or False. By default, the value is True.
5. (Optional) Input the Tenant ID. The parameter will only appear if you have selected False for the Is Manager Account parameter.
6. Input the API Version. The default value is v1.Connection Health Check: Periodically checks the connection status by scheduling the Test Connection command at the specified interval (in minutes). Available only for active connections, this feature also allows configuring email notifications for failed attempts.
Enable Password Vault: An optional feature that allows users to take the stored credentials from their own password vault. Refer to the password vault connection guide if needed.
READER NOTE
When Is Manager Account is set to True, the Fetch Event command will return all available information. However, if Is Manager Account is set to False, you have the option to specify a tenant ID of your choice. With a specific tenant ID, the Fetch Event command will only access information related to that tenant. The tenant ID will not impact other commands.
Using an incorrect or False tenant ID will not cause errors in the connector you have set up. However, if you run the Fetch Event command with an incorrect tenant ID, it will run successfully but return no results.
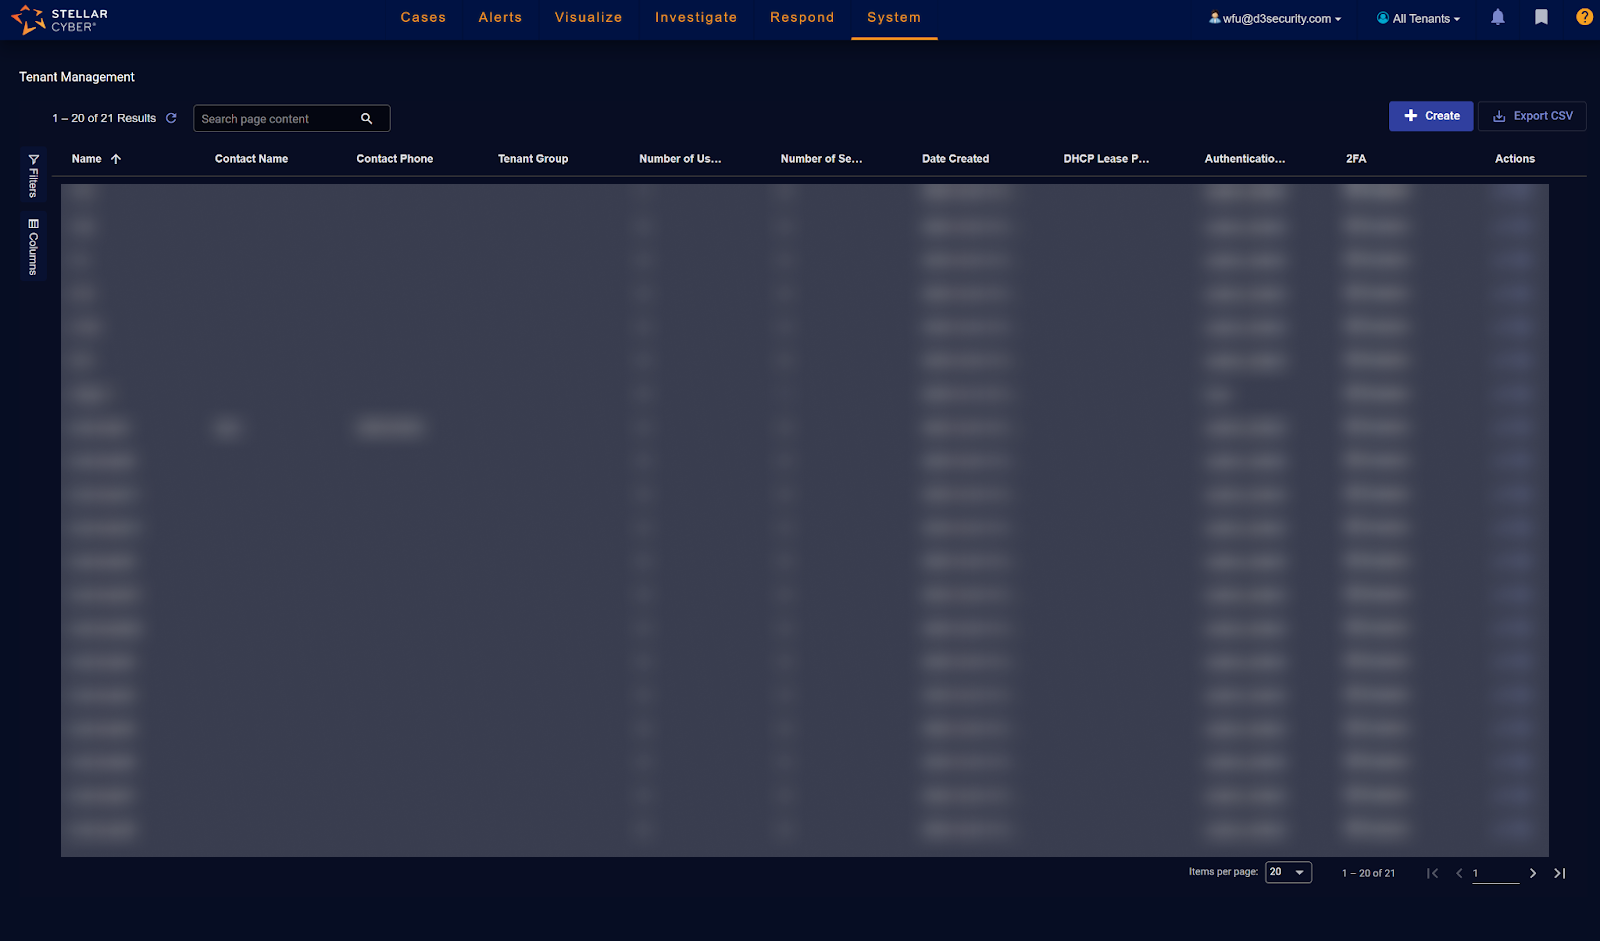
To obtain a tenant ID, run the List Tenant command. To create a new tenant, navigate to Stellar Cyber, then go to Administration, and finally to Tenants.
Test the connection.
Click on the Test Connection button to verify credentials and connectivity. A success alert displays Passed with a green checkmark. If the connection fails, review the parameters and retry.
Click OK to close the alert window.
Click +Add to create and add the configured connection.
Commands
Stellar Cyber V2 includes the following executable commands for users to set up schedules or create playbook workflows. With the Test Command, users can execute these commands independently for playbook troubleshooting.
Integration API Note
For more information about the Stellar Cyber V2 API, refer to the Stellar Cyber V2 API reference.
READER NOTE
Certain permissions are required for each command. Refer to the Permission Requirements and Configuring Stellar Cyber V2 to Work with D3 SOAR for details
Note for Time-related parameters
The input format of time-related parameters may vary based on user account settings, which may cause the sample data in commands to differ from what is displayed. To adjust the time format, follow these steps:
Navigate to Configuration > Application Settings. Select Date/Time Format.
-20241022-230803.png?inst-v=a9107af0-b04c-4e31-bb5a-938372783868)
Choose the desired date and time format, then click on the Save button.
-20241022-230812.png?inst-v=a9107af0-b04c-4e31-bb5a-938372783868)
The selected time format will now be visible when configuring Date/Time command input parameters.
Fetch Event
Retrieves alerts from Stellar Cyber by utilizing the syntax of Elasticsearch to conduct event queries.
READER NOTE
By utilizing a connector that includes a tenant ID, you can only retrieve events from that particular tenant. To find the tenant ID, use the List Tenants command. If you enter a tenant ID that doesn't exist, the command will run successfully with no returned results. If the Is Manager Account connection parameter is set to False and no tenant ID is provided, the system will process the request as if the parameter was set to True.
Input
Input Parameter | Required/Optional | Description | Example |
Start Time | Required | The start time of the time range to fetch events, in UTC time. The time value is defined by alert write time. | 2021-01-05 00:00 |
End Time | Optional | The end time of the time range to fetch events, in UTC time. The time value is defined by alert write time. | 2022-04-20 00:00 |
Index | Optional | The name of the index to search. If the intention is to search across all available data streams and indices, this parameter can be left empty or replaced with * or _all. The available indexes are as follows: aella-assets-*, aella-cloudtrail-*, aella-audit-*, aella-maltrace-*, aella-ade-*, aella-scan-*, aella-ser-*, aella-perf-*, aella-syslog-*, aella-adr-*, aella-users-*, aella-wineventlog-*. | aella-scan-* |
Number of Event(s) Fetched | Optional | The maximum number of alerts to retrieve. If the input value is 0 or negative, the command will return all alerts matching the specified criteria. The maximum input value is 10000. | 2 |
Offset | Optional | The number of matching records to bypass before returning results. The default value is 0. | 0 |
Search Condition | Optional | The JSON-formatted queries defining the criteria to filter results. For comprehensive query syntax guidelines, see Examples: Using the API to Perform an ElasticSearch Query. | { "query": { "bool": { "must": [ { "match": { "source_node.host": "***.***.***.***" } }, { "match": { "source_node.name": "iMMyGwu" } } ] } }, "sort": [ { "@timestamp": "desc" } ] } |
Output
To view the sample output data for all commands, refer to this article.
Fetch Event Field Mapping
Please note that Fetch Event commands require event field mapping. Field mapping plays a key role in the data normalization process part of the event pipeline. Field mapping converts the original data fields from the different providers to the D3 fields which are standardized by the D3 Model. Please refer to Event and Incident Intake Field Mapping for details.
To customize field mapping, click + Add Field and add the custom field of your choice. You can also remove built-in field mappings by clicking x. Please note that two underscore characters will automatically prefix the defined Field Name as the System Name for a custom field mapping. Additionally, if an input Field Name contains any spaces, they will automatically be replaced with underscores for the corresponding System Name.
As a system integration, the Stellar Cyber V2 integration has some pre-configured field mappings for default field mapping.
Default Event Source
The Default Event Source is the default set of field mappings that are applied when this fetch event command is executed. For out-of-the-box integrations, you will find a set of field mapping provided by the system. Default event source provides field mappings for common fields from fetched alerts. The default event source has a “Main Event JSON Path” (i.e., $.hits.hits) that is used to extract a batch of events from the response raw data. Click Edit Main JSON Path to view the “Main Event JSON Path”.-20241022-230926.png?inst-v=a9107af0-b04c-4e31-bb5a-938372783868)
Main Event JSON Path: $.hits.hits
The Main Event JSON Path determines the root path where the system starts parsing raw response data into D3 event data. The JSON path begins with $, representing the root element. The path is formed by appending a sequence of child elements to $, each separated by a dot (.). Square brackets with nested quotation marks ([‘...’]) should be used to separate child elements in JSON arrays.For example, the root node of a JSON Path is hits.hits. The child node denoting the Unique Event Key field would be _id. Putting it together, the JSON Path expression to extract the Unique Event Key is $.hits.hits._id.
The pre-configured field mappings are detailed below:
Field Name | Source Field |
Anomaly ID | ._source.anomaly_id |
Event Score | ._source.event_score |
Event Source | ._source.event_source |
Index | ._index |
Threat Score | ._source.threat_score |
User Domain | ._source.user.domain |
Initiating Command | ._source.command |
Device | ._source.host.name |
Device IP address | ._source.host.ip |
Event category | ._source.event_category |
Unique Event Key | ._id |
Event name | ._source.event_name |
Event Type | ._source.event_type |
Filename | ._source.file.name |
Filepath | ._source.file.path |
Hostname | ._source.computer_name |
Start Time | ._source.timestamp |
Description | ._source.event_description |
Parent process commandline | ._source.process.parent.command_line |
Parent process ID | ._source.process.parent.pid |
Parent process name | ._source.process.parent.executable |
Process command line | ._source.process.command_line |
Process ID | ._source.process.pid |
Process Name | ._source.process_name |
Severity | ._source.severity |
Status | ._source.event_status |
Sub Event | ._source.xdr_event |
Tactics | ._source.event.tactic.name |
Techniques | ._source.event.technique.name |
Username | ._source.username |
Error Handling
If the Return Data is Failed, an Error tab will appear in the Test Result window.
The error tab contains the details responded from D3 SOAR or third-party API calls, including Failure Indicator, Status Code, and Message. This can help you locate the root cause of a command failure.
Parts in Error | Description | Example |
Failure Indicator | Indicates the command failure that happened at a specific input and/or API call. | Fetch Event failed. |
Status Code | The response code issued by the third-party API server or the D3 SOAR system that can be used to locate the corresponding error category. For example, if the returned status code is 401, the selected connection is unauthorized to run the command. The user or system support would need to check the permission setting in the Stellar Cyber V2 portal. Refer to the HTTP Status Code Registry for details. | Status Code: 403. |
Message | The raw data or captured key error message from the integration API server about the API request failure. | Message: no permissions for [indices:data/read/search] and User [name=aella-ui, backend_roles=[aella_ui], requestedTenant=null]. |
Error Sample Data Fetch Event failed. Status Code: 403. Message: o permissions for [indices:data/read/search] and User [name=aella-ui, backend_roles=[aella_ui], requestedTenant=null]. |
Get Event Details
Retrieve details on the specified events.
READER NOTE
Event IDs and Index are required parameters to run this command.
You should already have your desired Event IDs on hand to run this command. If you don’t, you can use the Fetch Event command with defined filters to retrieve the desired Event IDs. The Event IDs can be found in the raw data at the path $.hits.hits[*]._id.
When configuring the input parameters, use a corresponding pair of Event ID and Index. The Index can be obtained using the Fetch Event command, located at the path $.hits.hits[*]._index in the returned raw data.
Verify the index of your Event ID before proceeding. If it deviates from the default "amsg", you must specify the correct one. The event type can be obtained using the Fetch Event command, located at the path $.hits.hits[*]._type in the returned raw data.
The input values of the three input parameters must correspond with each other.
The Event Index parameter does not accept wildcard characters like * or _. It requires an exact match to the result returned in the Fetch Event command.
Input
Input Parameter | Required/Optional | Description | Example |
Event IDs | Required | The IDs of the events from the same index to retrieve. Event IDs can be obtained using the Fetch Event command. | [ "*****" ] |
Index | Required | The index of the events to retrieve details. The index value can be obtained using the Fetch Event command. | ***** |
Type | Optional | The event type to filter results. The event type can be obtained using the Fetch Event command. If this parameter is not defined, the default value is asmg. | Amsg |
Output
To view the sample output data for all commands, refer to this article.
Error Handling
If the Return Data is Partially Successful or Failed, an Error tab will appear in the Test Result window.
The error tab contains the details responded from D3 SOAR or third-party API calls, including Failure Indicator, Status Code, and Message. This can help you locate the root cause of a command failure.
Parts in Error | Description | Example |
Failure Indicator | Indicates the command failure that happened at a specific input and/or API call. | Get Event Details failed. |
Status Code | The response code issued by the third-party API server or the D3 SOAR system that can be used to locate the corresponding error category. For example, if the returned status code is 401, the selected connection is unauthorized to run the command. The user or system support would need to check the permission setting in the Stellar Cyber V2 portal. Refer to the HTTP Status Code Registry for details. | Status Code: 404. |
Message | The raw data or captured key error message from the integration API server about the API request failure. | Message: Failed to get the event details by the given event ID. |
Error Sample Data Get Event Details failed. Status Code: 404. Message: Failed to get the event details by the given event ID. |
List Tenants
Retrieves the list of existing tenants.
Input
N/A
Output
To view the sample output data for all commands, refer to this article.
Error Handling
If the Return Data is Failed, an Error tab will appear in the Test Result window.
The error tab contains the details responded from D3 SOAR or third-party API calls, including Failure Indicator, Status Code, and Message. This can help you locate the root cause of a command failure.
Parts in Error | Description | Example |
Failure Indicator | Indicates the command failure that happened at a specific input and/or API call. | List Tenants failed. |
Status Code | The response code issued by the third-party API server or the D3 SOAR system that can be used to locate the corresponding error category. For example, if the returned status code is 401, the selected connection is unauthorized to run the command. The user or system support would need to check the permission setting in the Stellar Cyber V2 portal. Refer to the HTTP Status Code Registry for details. | Status Code: 403. |
Message | The raw data or captured key error message from the integration API server about the API request failure. | Message: Please check your connection fields. |
Error Sample Data List Tenants failed. Status Code: 403. Message: Please check your connection fields. |
Update Cases
Updates the specified case(s). You can update the following case properties: Name, Severity, Status, Assignee and Tags.
Input
Input Parameter | Required/Optional | Description | Example |
Case IDs | Required | The IDs of the cases to update details. | [ "************************************************" ] |
Name | Optional | The updated name for the specified cases. This name will be applied to all specified cases. | New Name |
Status | Optional | The updated status for the cases. | New |
Severity | Optional | The updated severity level for the cases. | Low |
Tags To Add | Optional | The tags to add to the cases. | [ "October-event" ] |
Tags To Delete | Optional | The tags to remove from the cases. | [ "my deleted tag" ] |
Assignee | Optional | The updated assignee of the cases. A list of users can be viewed in Stellar Cyber by navigating to System > Administration > Users. | user_test |
Output
To view the sample output data for all commands, refer to this article.
Error Handling
If the Return Data is Partially Successful or Failed, an Error tab will appear in the Test Result window.
The error tab contains the details responded from D3 SOAR or third-party API calls, including Failure Indicator, Status Code, and Message. This can help you locate the root cause of a command failure.
Parts in Error | Description | Example |
Failure Indicator | Indicates the command failure that happened at a specific input and/or API call. | Update Cases failed. |
Status Code | The response code issued by the third-party API server or the D3 SOAR system that can be used to locate the corresponding error category. For example, if the returned status code is 401, the selected connection is unauthorized to run the command. The user or system support would need to check the permission setting in the Stellar Cyber V2 portal. Refer to the HTTP Status Code Registry for details. | Status Code: 403. |
Message | The raw data or captured key error message from the integration API server about the API request failure. | Message: Please check your connection fields. |
Error Sample Data Update Cases failed. Status Code: 403. Message: Please check your connection fields. |
Update Events
Updates status or comments, add or delete custom tags with the index and event ID. Please note, you must input at least one parameter among Tags To Add, Tags To Delete, Status and Comment.
READER NOTE
Event IDs and Index are required parameters to run this command.
Event IDs can be found using the Fetch Event command. The Event IDs can be found in the raw data at the path $.hits.hits[*]._id.
When configuring the input parameters, use a corresponding pair of Event ID and Index. The Index can be obtained using the Fetch Event command, located at the path $.hits.hits[*]._index in the returned raw data.
Input
Input Parameter | Required /Optional | Description | Example |
Event IDs | Required | The IDs of the events from the same index to update. Event IDs can be obtained using the Fetch Event command. | [ "********************" ] |
Index | Required | The index of the events to update. The index value can be obtained using the Fetch Event command. | aella-ser-*************- |
Tags To Add | Optional | The tags to add to the events. | [ "my_tag_add" ] |
Tags To Delete | Optional | The tags to remove from the events. | [ "my_tag_delete" ] |
Status | Optional | The updated status for the events. If this parameter is not defined, the status will not be updated. The available statuses are New, In Progress, Ignored, and Closed. | Closed |
Comment | Optional | A comment for the updated events. | Any comment |
Output
To view the sample output data for all commands, refer to this article.
Error Handling
If the Return Data is Partially Successful or Failed, an Error tab will appear in the Test Result window.
The error tab contains the details responded from D3 SOAR or third-party API calls, including Failure Indicator, Status Code, and Message. This can help you locate the root cause of a command failure.
Parts in Error | Description | Example |
Failure Indicator | Indicates the command failure that happened at a specific input and/or API call. | Update Events failed. |
Status Code | The response code issued by the third-party API server or the D3 SOAR system that can be used to locate the corresponding error category. For example, if the returned status code is 401, the selected connection is unauthorized to run the command. The user or system support would need to check the permission setting in the Stellar Cyber V2 portal. Refer to the HTTP Status Code Registry for details. | Status Code: 403. |
Message | The raw data or captured key error message from the integration API server about the API request failure. | Message: Please check your connection fields. |
Error Sample Data Update Events failed. Status Code: 403. Message: Please check your connection fields. |
Test Connection
Allows you to perform a health check on an integration connection. You can schedule a periodic health check by selecting Connection Health Check when editing an integration connection.
Input
N/A
Output
Output Type | Description | Return Data Type |
Return Data | Indicates one of the possible command execution states: Successful or Failed. The Failed state can be triggered by any of the following errors:
More details about an error can be viewed in the Error tab. | String |
Error Handling
If the Return Data is Failed, an Error tab will appear in the Test Result window.
The error tab contains the details responded from D3 SOAR or third-party API calls, including Failure Indicator, Status Code, and Message. This can help you locate the root cause of a command failure.
Parts in Error | Description | Example |
Failure Indicator | Indicates the command failure that happened at a specific input and/or API call. | Test Connection failed. Failed to check the connector. |
Status Code | The response code issued by the third-party API server or the D3 SOAR system that can be used to locate the corresponding error category. For example, if the returned status code is 401, the selected connection is unauthorized to run the command. The user or system support would need to check the permission setting in the Stellar Cyber V2 portal. Refer to the HTTP Status Code Registry for details. | Status Code: 403. |
Message | The raw data or captured key error message from the integration API server about the API request failure. | Message: Please check your connection fields. |
Error Sample Data Test Connection failed. Failed to check the connector. Status Code: 403. Message: Please check your connection fields. |