
Proofpoint Cloud Threat Response
LAST UPDATED: SEPTEMBER 24, 2025
Overview
Threat Protection APIs are REST APIs that allow our Proofpoint On Demand customers to retrieve, add, update or delete certain PoD configurations. The APIs also allow our Cloud Threat Response customers to retrieve information on incidents and messages subject to remediation.
D3 SOAR is providing REST operations to function with Proofpoint Cloud Threat Response.
Proofpoint Cloud Threat Response is available for use in:
Known Limitations
There is an API rate limit of 10 calls per minute.
Connection
To connect to Proofpoint Cloud Threat Response from D3 SOAR, follow this part to collect the required information below:
Parameter | Description | Example |
Server URL | The endpoint for the Threat Protection API. | https://threatprotection-api.proofpoint.com |
API Key | The API key obtained from the Proofpoint Threat Response (PTR). For details, see API Key Management. | ***** |
API Secret | The API secret obtained from the PTR. For details, see API Key Management. | ***** |
API Version | The API version of the Threat Protection API. By default, the value is v1. | v1 |
Configuring D3 SOAR to Work with Proofpoint Cloud Threat Response
Log in to D3 SOAR.
Find the Proofpoint Cloud Threat Response integration.
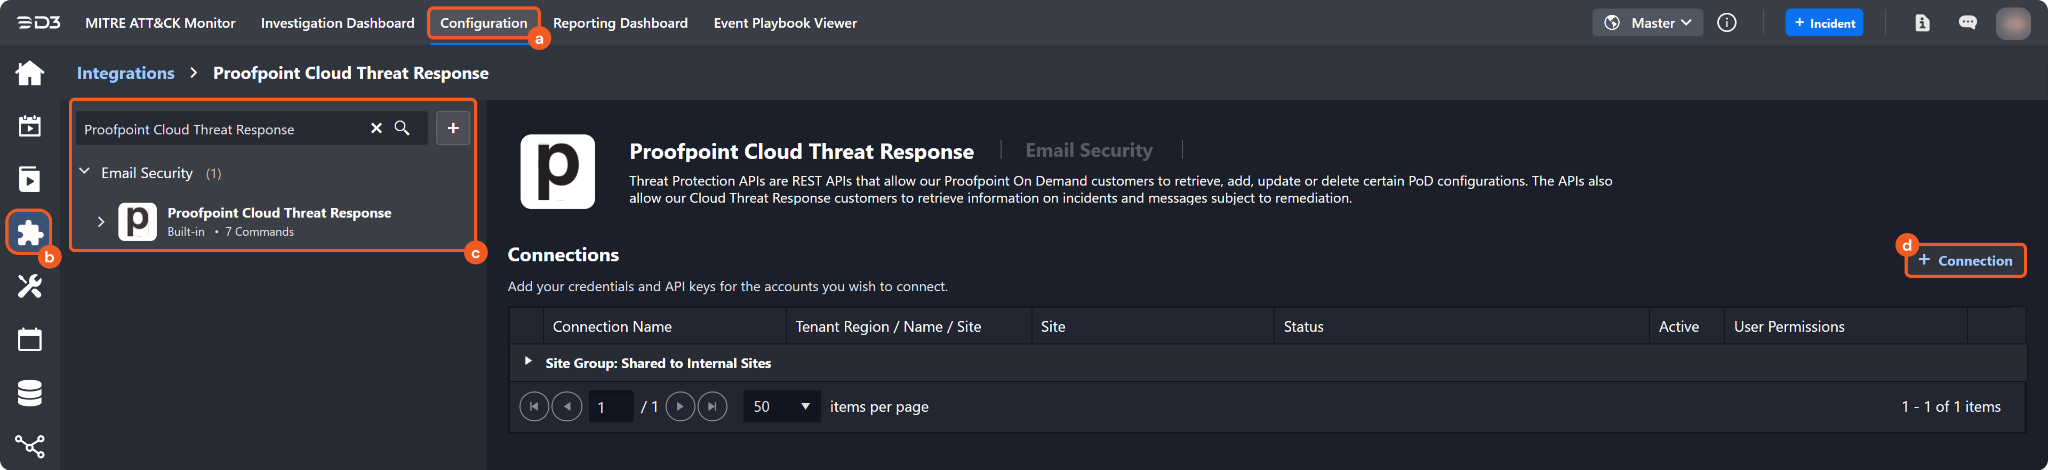
Navigate to Configuration on the top header menu.
Click on the Integration icon on the left sidebar.
Type Proofpoint Cloud Threat Response in the search box to find the integration, then click it to select it.
Click on the + Connection button on the right side of the Connections section. A new connection window will appear.
Configure the following fields to create a connection to Proofpoint Cloud Threat Response.
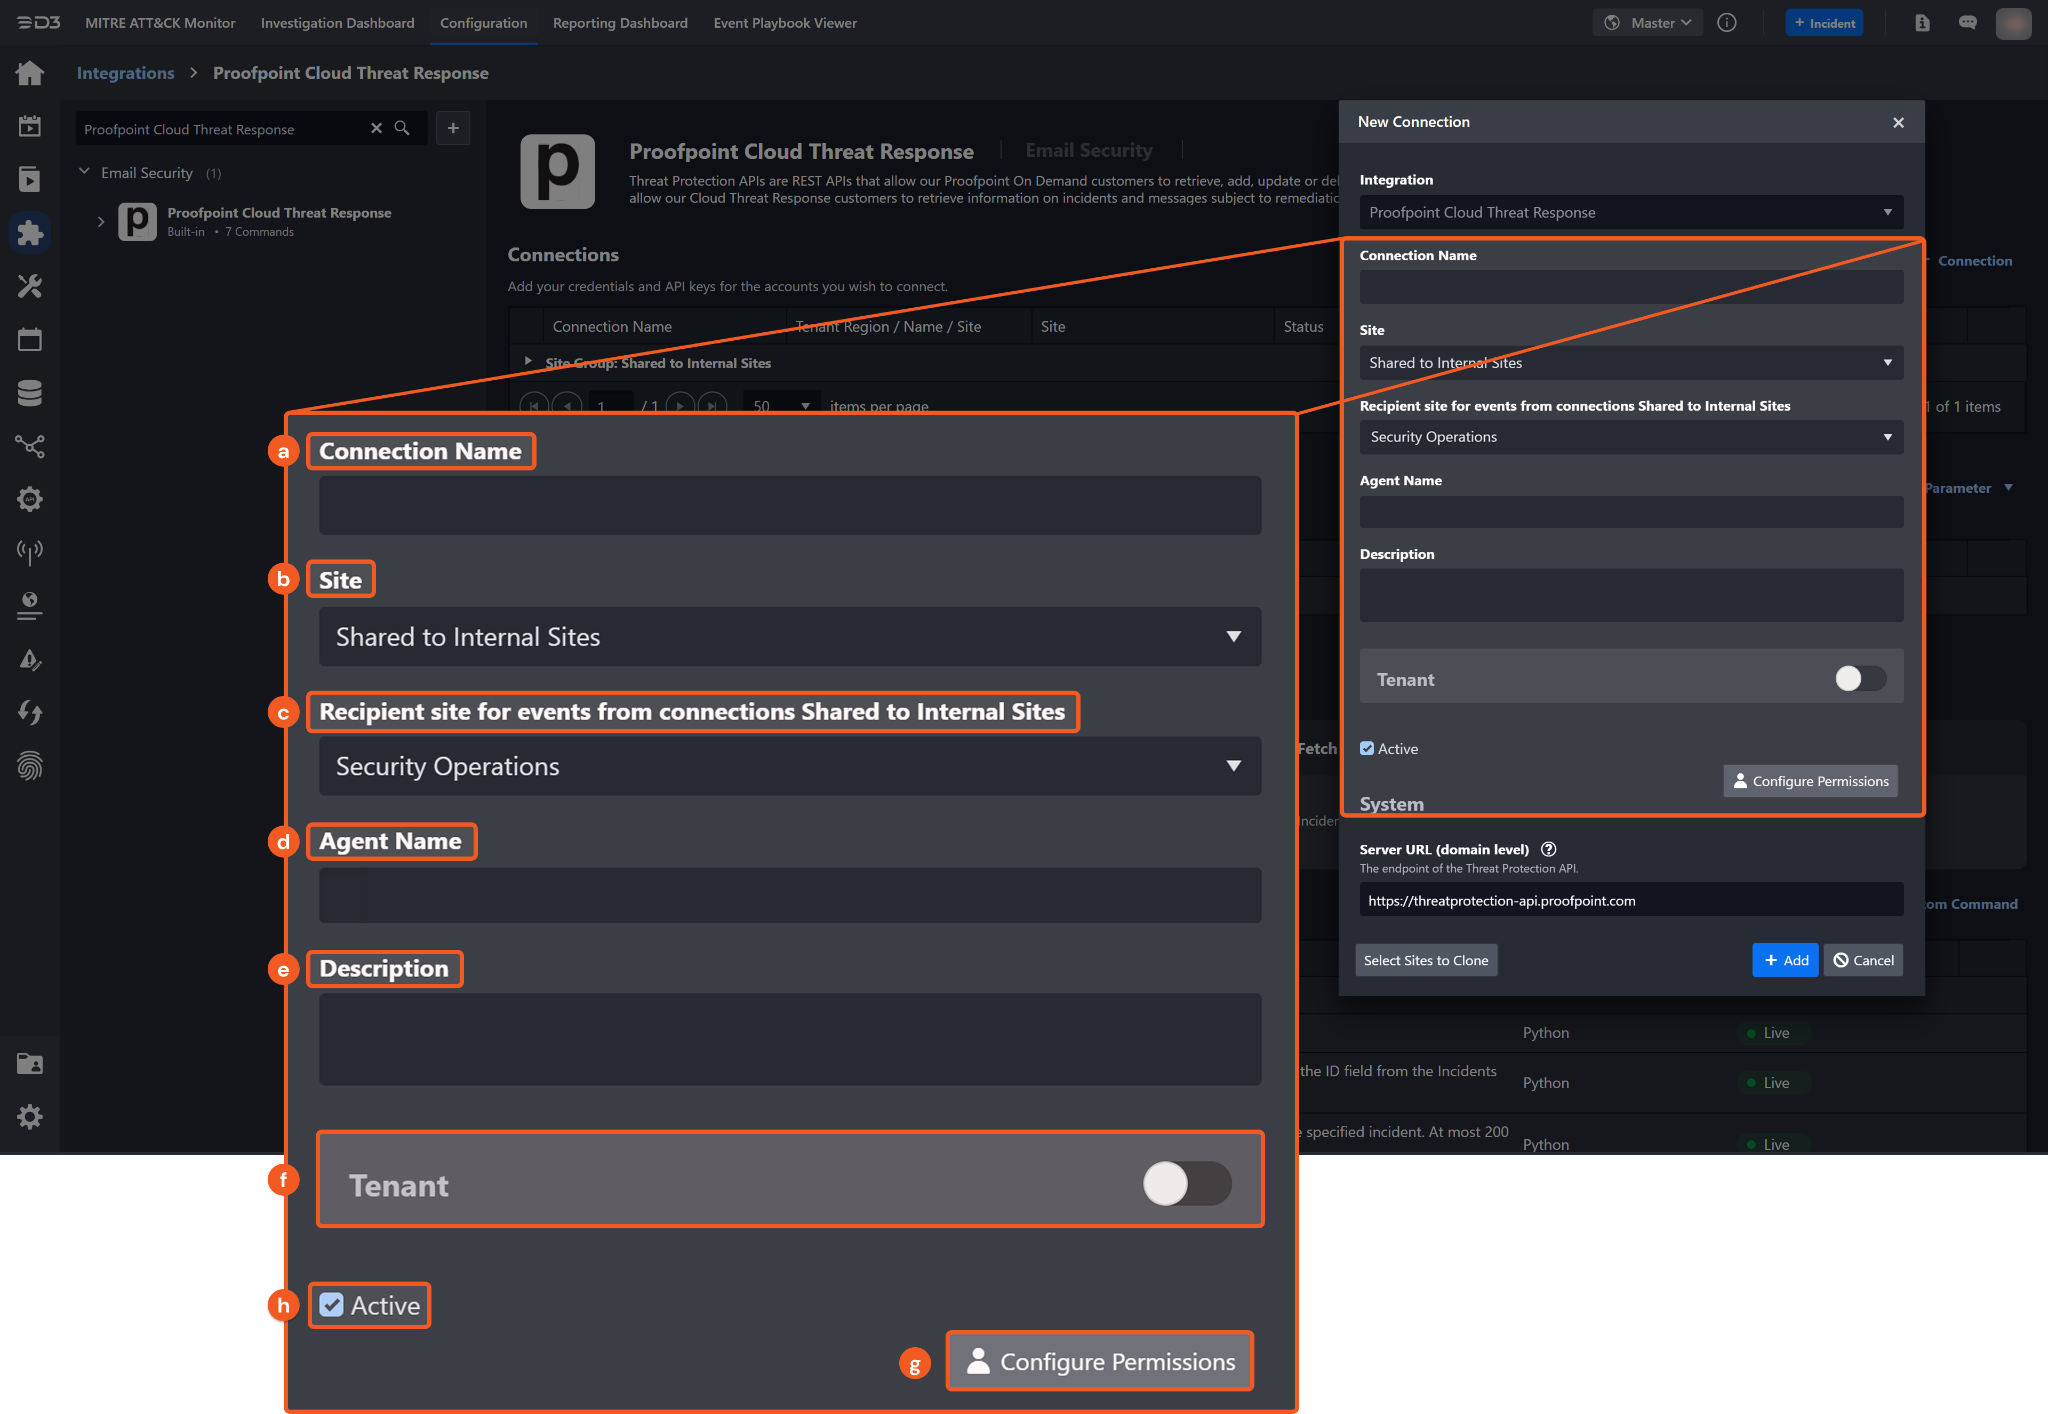
Connection Name: The desired name for the connection.
Site: The site on which to use the integration connection. Use the drop-down menu to select the site. The Share to Internal Sites option enables all internal sites to use the connection. Selecting a specific site will only enable that site to use the connection.
Recipient site for events from connections Shared to Internal Sites: This field is displayed when Share to Internal Sites is selected for the Site field, allowing selection of the internal site for deploying the integration connection.
Agent Name (Optional): The proxy agent required to build the connection. Use the dropdown menu to select the proxy agent from a list of previously configured proxy agents.
Description (Optional): The description for the connection.
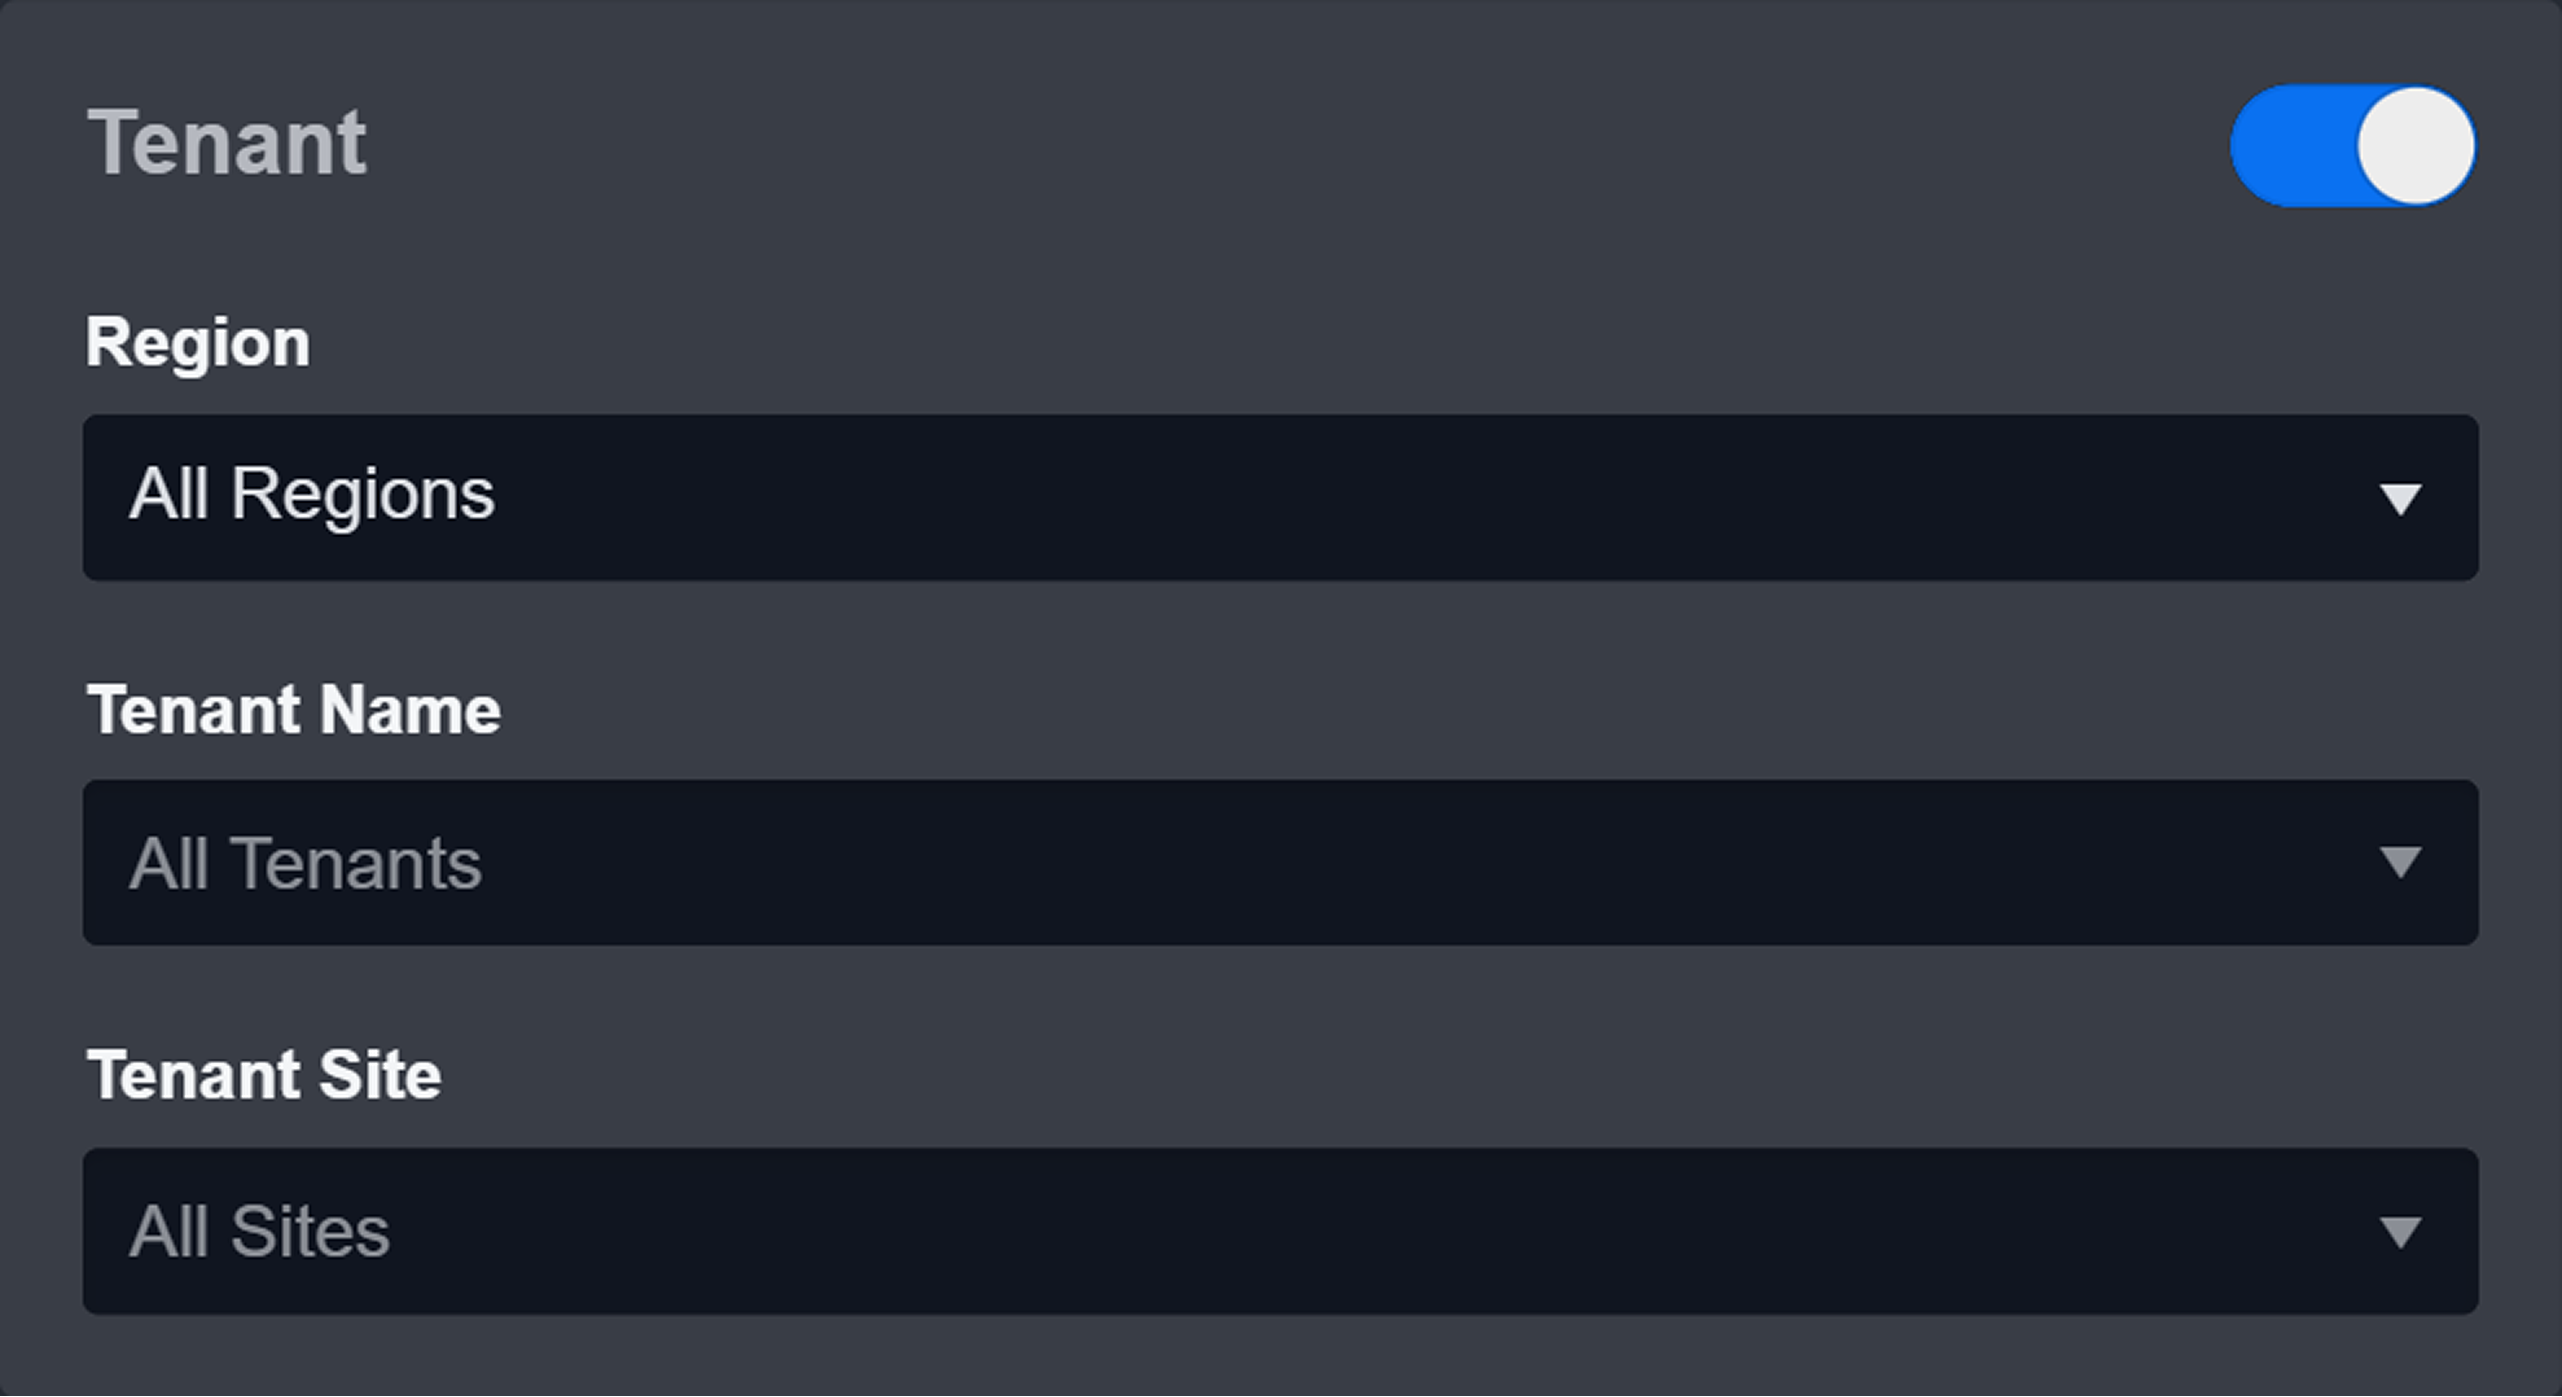
Tenant (Optional): When configuring the connection from a master tenant site, users can choose the specific tenant sites with which to share the connection. Once this setting is enabled, users can filter and select the desired tenant sites from the dropdowns to share the connection.
Configure User Permissions: Defines which users have access to the connection
Active: The checkbox that enables the connection to be used when selected.
System: This section contains the parameters defined specifically for the integration. These parameters must be configured to create the integration connection.
-20250825-225636.png?inst-v=a9107af0-b04c-4e31-bb5a-938372783868)
1. Input the Server URL.
2. Input the API Key from the Proofpoint Cloud Threat Response platform.
3. Input the API Secret from the Proofpoint Cloud Threat Response platform.
4. Input the API Version. The default value is v1.Enable Password Vault: An optional feature that allows users to take the stored credentials from their own password vault. Refer to the password vault connection guide if needed.
Connection Health Check: Periodically checks the connection status by scheduling the Test Connection command at the specified interval (in minutes). Available only for active connections, this feature also allows configuring email notifications for failed attempts.
Test the connection.
Click on the Test Connection button to verify credentials and connectivity. A success alert displays Passed with a green checkmark. If the connection fails, review the parameters and retry.
Click OK to close the alert window.
Click + Add to create and add the configured connection.
Commands
Proofpoint Cloud Threat Response includes the following executable commands for users to set up schedules or create playbook workflows. With the Test Command function, users can execute these commands independently for playbook troubleshooting.
Note for Time-related parameters
The input format of time-related parameters may vary based on user account settings, which may cause the sample data in commands to differ from what is displayed. To adjust the time format, follow these steps:
Navigate to Configuration > Application Settings. Select Date/Time Format.
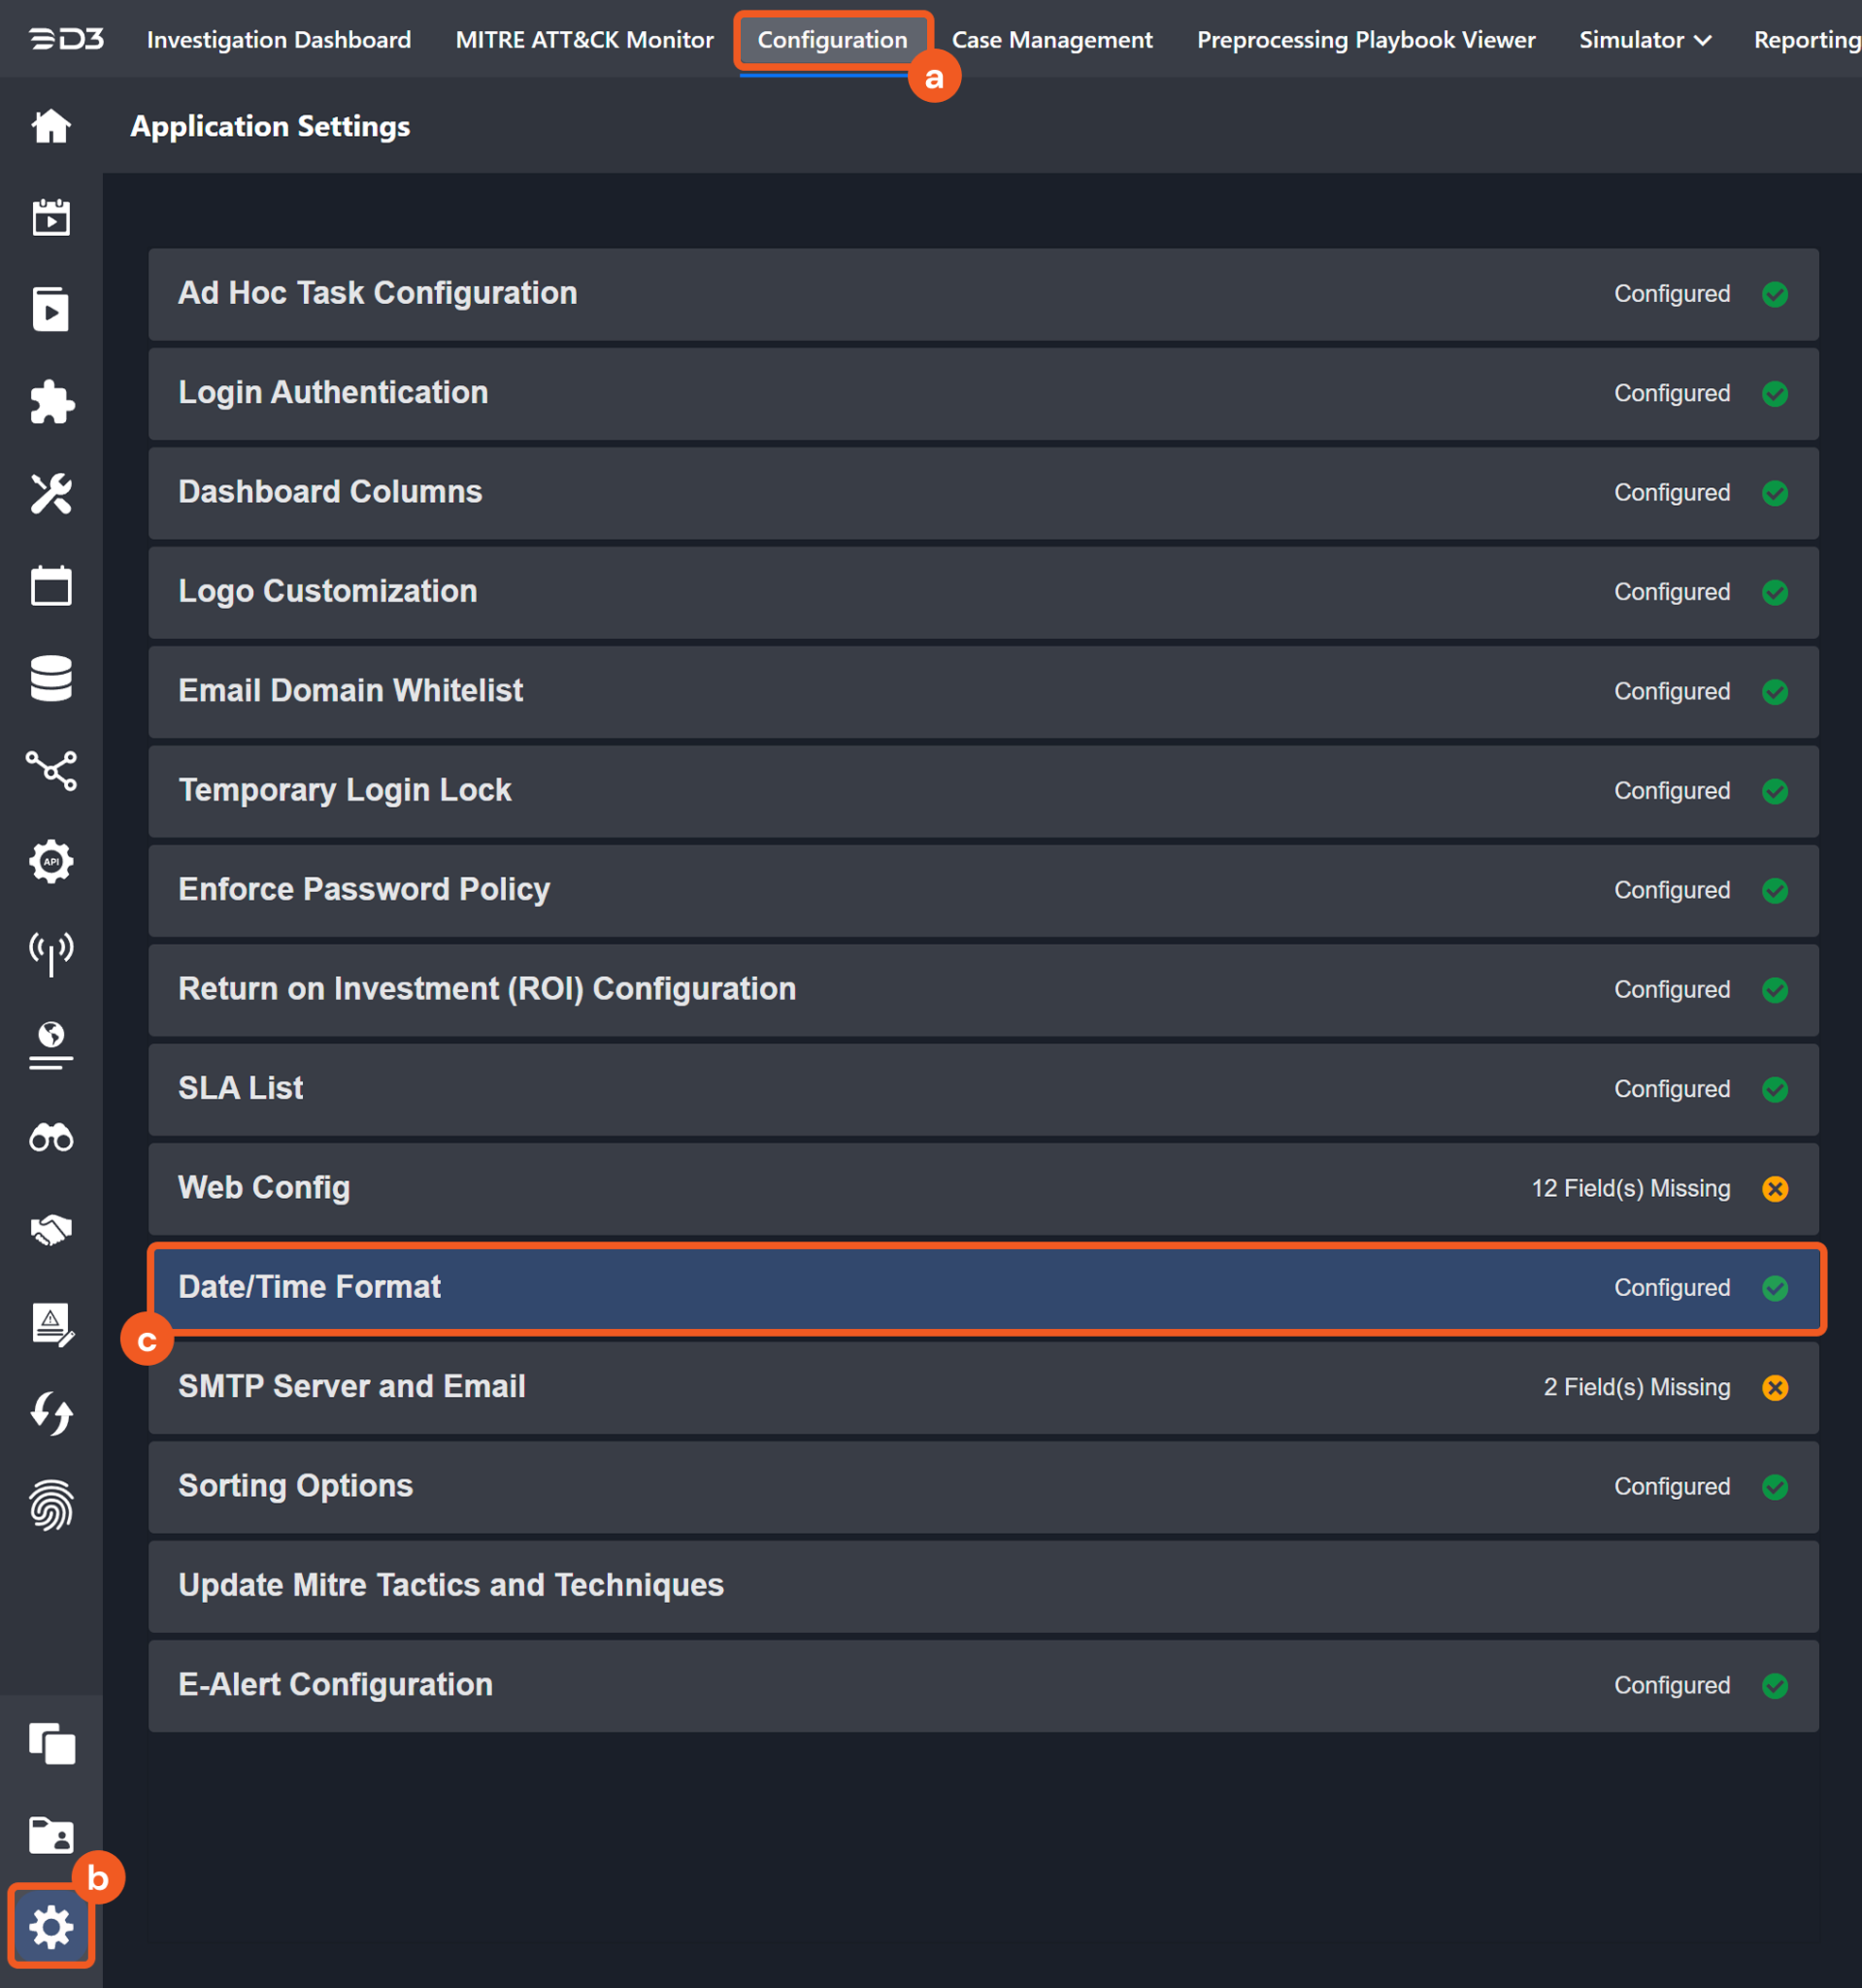
Choose the desired date and time format, then click on the Save button.
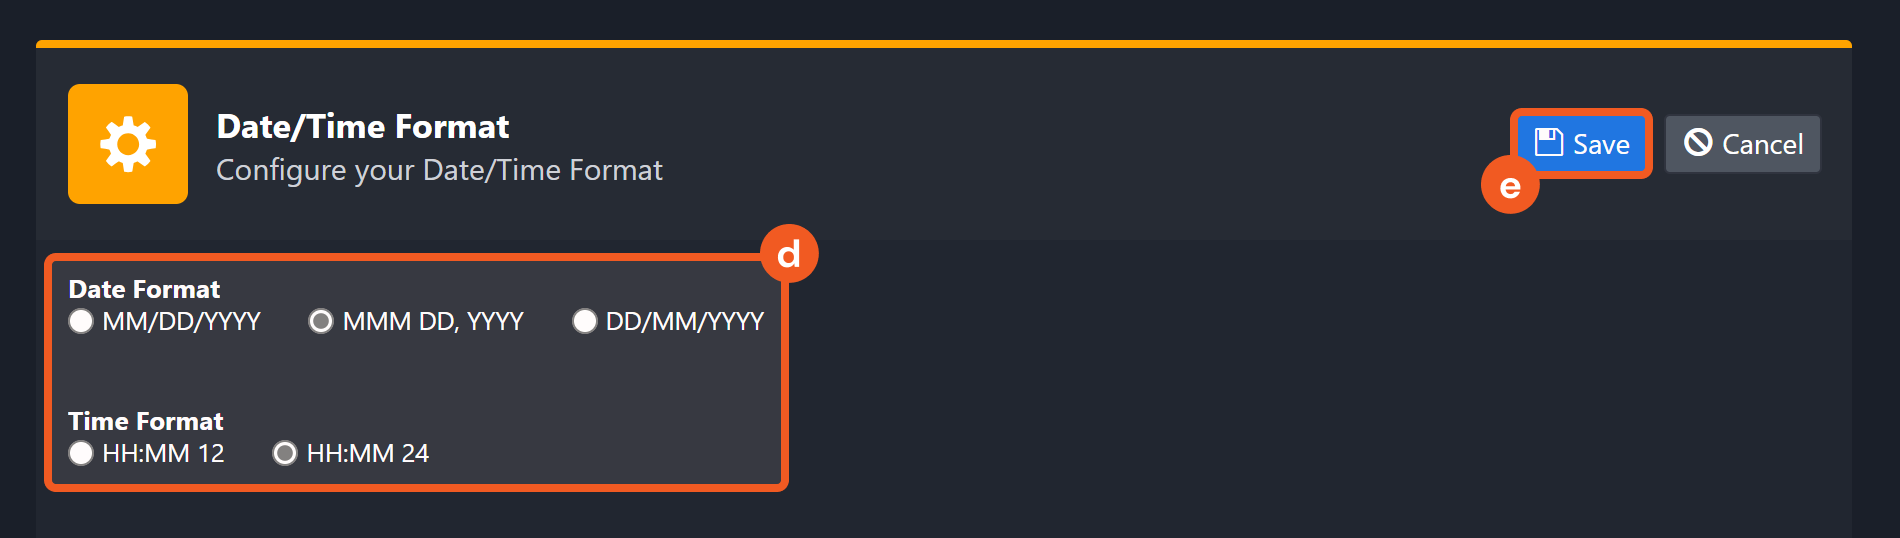
The selected time format will now be visible when configuring Date/Time command input parameters.
Check Message Body Fetch Status
Checks the status of the fetch message.
READER NOTE
Internal Message IDs is a required parameter to run this command.
Run the Get Incident Details command to obtain the Internal Message IDs. Internal Message IDs can be found in the raw data at $.messages[*].id.
Input
Input Parameter | Required/Optional | Description | Example |
Internal Message IDs | Required | The Proofpoint internal message IDs used to check the status of the fetch message. Messages IDs can be obtained using the Get Incident Details command. |
JSON
|
Output
To view the sample output data for all commands, refer to this article.
Error Handling
If the Return Data displays Partially Successful or Failed, an Error tab will appear in the Test Result window.
The error tab contains the details responded from D3 SOAR or third-party API calls, including Failure Indicator, Status Code, and Message. This can help locate the root cause of a command failure.
Parts in Error | Description | Example |
Failure Indicator | Indicates the command failure that happened at a specific input and/or API call. | Check Message Body Fetch Status failed. |
Status Code | The response code issued by the third-party API server or the D3 SOAR system that can be used to locate the corresponding error category. For example, if the returned status code is 401, the selected connection is unauthorized to run the command. The user or system support would need to check the permission setting in the Proofpoint Cloud Threat Response portal. Refer to the HTTP Status Code Registry for details. | Status Code: 401. |
Message | The raw data or captured key error message from the integration API server about the API request failure. | Message: Unauthorized. |
Error Sample Data Check Message Body Fetch Status failed. Status Code: 401. Message: Unauthorized. |
Download Messages
Retrieves the MIME body of a message using the ID field from the Incidents API messages object.
READER NOTE
Internal Message IDs is a required parameter to run this command.
Run the Get Incident Details command to obtain the Internal Message IDs. Internal Message IDs can be found in the raw data at $.messages[*].id.
Input
Input Parameter | Required/Optional | Description | Example |
Internal Message IDs | Required | The internal message IDs required to download the complete MIME body of the messages. Internal Message IDs can be obtained using the Get Incident Details command. |
JSON
|
Output
To view the sample output data for all commands, refer to this article.
Error Handling
If the Return Data displays Partially Successful or Failed, an Error tab will appear in the Test Result window.
The error tab contains the details responded from D3 SOAR or third-party API calls, including Failure Indicator, Status Code, and Message. This can help locate the root cause of a command failure.
Parts in Error | Description | Example |
Failure Indicator | Indicates the command failure that happened at a specific input and/or API call. | Download Messages failed. |
Status Code | The response code issued by the third-party API server or the D3 SOAR system that can be used to locate the corresponding error category. For example, if the returned status code is 401, the selected connection is unauthorized to run the command. The user or system support would need to check the permission setting in the Proofpoint Cloud Threat Response portal. Refer to the HTTP Status Code Registry for details. | Status Code: 401. |
Message | The raw data or captured key error message from the integration API server about the API request failure. | Message: Unauthorized. |
Error Sample Data Download Messages failed. Status Code: 401. Message: Unauthorized. |
Fetch Event
Retrieves a list of incident summaries based on the specified criteria.
Input
Input Parameter | Required/Optional | Description | Example |
Start Time | Optional | The start of the time range to fetch for events (in UTC). By default, the value is 24 hours before End Time. | 2018-05-26 00:00 |
End Time | Optional | The end of the time range to fetch for events (in UTC). By default, the value is the current time. | 2018-05-27 00:00 |
Number of Event(s) Fetched | Optional | The maximum number of events to return. Valid values are integers between 1 and 200. By default, or if the value is 0 or negative, all events matching the search criteria will be returned. | 20 |
Incident State | Optional | Filters events by their state. Valid options are:
By default, all events regardless of their state will be returned. | Open |
Incident Priority | Optional | Filters events by their priority. Valid values are:
By default, all events regardless of their priority will be returned. |
JSON
|
VAP | Optional | The option to return events only for Very Attacked Person (VAP) when set to True. By default, the value is set to False. | True |
Source | Optional | Filters events by their message source. Valid values are:
By default, all events regardless of their source will be returned. |
JSON
|
Message Disposition | Optional | Filters events with the specified message dispositions. Valid values are:
By default, all events regardless of their message disposition will be returned. |
JSON
|
Clear Confidence | Optional | Filters events by their clear confidence. Available options are:
By default, all events regardless of their clear confidence level will be returned. | High |
Clear Verdict | Optional | Filters events by their clear verdict. Valid values are:
By default, all events regardless of their clear verdict will be returned. |
JSON
|
Output
To view the sample output data for all commands, refer to this article.
Fetch Event Field Mapping
See Field Mappings.
The Proofpoint Cloud Threat Response system integration includes pre-configured field mappings for the default event source.
The Default Event Source is the default system-provided set of field mappings applied when the fetch event command is executed. It includes a Main Event JSON Path, which is the JSONPath expression that points to the base array of event objects. The source field path continues from this array to locate the required data.
The Main Event JSON Path can be viewed by clicking on the Edit Event Source button.
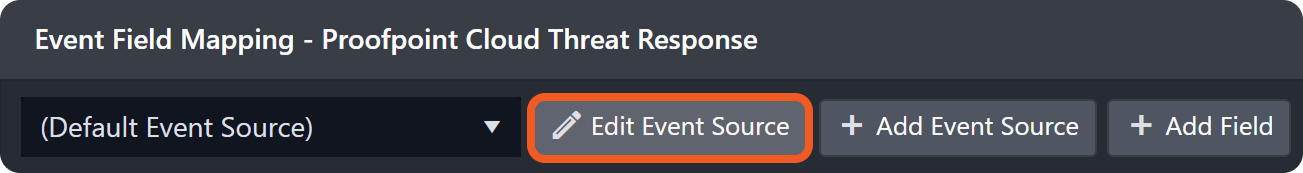
Main Event JSON Path: $.Results
The value array contains the event objects. Within each event object, the key abuseSourceIds denotes the Abuse Source ID field. As such, the full JSONPath expression to extract the Abuse Source ID is $.Results.abuseSourceIds.
The pre-configured field mappings are detailed below:
Field Name | Source Field |
Abuse Source ID | .abuseSourceIds |
Assigned Team ID | .assignedTeamId |
Assigned Team Name | .assignedTeamName |
Clear Confidence | .clearConfidences |
Clear Verdict | .clearVerdicts |
Closed Time | .closedAt |
Dispositions | .dispositions |
SID | .sid |
Tenant ID | .tenantId |
Updated Time | .updatedAt |
VAP | .vap |
VIP | .vip |
Document ID | .id |
Aggregated / Correlated Event count | .messageCount |
Event code | .displayId |
Event Type | .sourceTypes |
Start Time | .createdAt |
Description | .title |
Status | .state |
Error Handling
If the Return Data displays Failed, an Error tab will appear in the Test Result window.
The error tab contains the details responded from D3 SOAR or third-party API calls, including Failure Indicator, Status Code, and Message. This can help locate the root cause of a command failure.
Parts in Error | Description | Example |
Failure Indicator | Indicates the command failure that happened at a specific input and/or API call. | Fetch Event failed. |
Status Code | The response code issued by the third-party API server or the D3 SOAR system that can be used to locate the corresponding error category. For example, if the returned status code is 401, the selected connection is unauthorized to run the command. The user or system support would need to check the permission setting in the Proofpoint Cloud Threat Response portal. Refer to the HTTP Status Code Registry for details. | Status Code: 401. |
Message | The raw data or captured key error message from the integration API server about the API request failure. | Message: Unauthorized. |
Error Sample Data Fetch Event failed. Status Code: 401. Message: Unauthorized. |
Get Incident Details
Retrieves incident and message details for the specified incident. A maximum of 200 messages will be returned.
READER NOTE
Incident Unique ID is a required parameter to run this command.
Run the Fetch Event command to obtain the Incident Unique ID. Incident Unique IDs can be found in the raw data at $.Results[*].id.
Input
Input Parameter | Required/Optional | Description | Example |
Incident Unique ID | Required | The unique ID of the incident used to retrieve details. Incident Unique ID can be obtained using the Fetch Event command. | 63b9*****9786 |
Source | Optional | Filters incident and message details by their message source. Valid values are:
By default, all incident and message details regardless of their source will be returned. |
JSON
|
Message Disposition | Optional | Filters incident and message details with the specified message dispositions. Valid values are:
By default, all incident and message details regardless of their message disposition will be returned. |
JSON
|
Clear Confidence | Optional | Filters incident and message details by their clear confidence. Available options are:
By default, all incident and message details regardless of their clear confidence level will be returned. | High |
Clear Verdict | Optional | Filters incident and message details by their clear verdict. Valid values are:
By default, all incident and message details regardless of their clear verdict will be returned. |
JSON
|
Start Time | Optional | The start of the time range to retrieve incident and message details (in UTC). By default, the value is the created time of the first message in the incident. | 2018-05-26 00:00 |
End Time | Optional | The end of the time range to retrieve incident and message details (in UTC). By default, the value is the current time. | 2018-05-27 00:00 |
Output
To view the sample output data for all commands, refer to this article.
Error Handling
If the Return Data displays Failed, an Error tab will appear in the Test Result window.
The error tab contains the details responded from D3 SOAR or third-party API calls, including Failure Indicator, Status Code, and Message. This can help locate the root cause of a command failure.
Parts in Error | Description | Example |
Failure Indicator | Indicates the command failure that happened at a specific input and/or API call. | Get Incident Details failed. |
Status Code | The response code issued by the third-party API server or the D3 SOAR system that can be used to locate the corresponding error category. For example, if the returned status code is 401, the selected connection is unauthorized to run the command. The user or system support would need to check the permission setting in the Proofpoint Cloud Threat Response portal. Refer to the HTTP Status Code Registry for details. | Status Code: 401. |
Message | The raw data or captured key error message from the integration API server about the API request failure. | Message: Unauthorized. |
Error Sample Data Get Incident Details failed. Status Code: 401. Message: Unauthorized. |
Get Message Details
Retrieves details of a message using the ID field from the Incidents API messages object.
READER NOTE
Internal Message IDs is a required parameter to run this command.
Run the Get Incident Details command to obtain the Internal Message IDs. Internal Message IDs can be found in the raw data at $.messages[*].id.
Input
Input Parameter | Required/Optional | Description | Example |
Internal Message IDs | Required | The Proofpoint internal message IDs used to retrieve message details. Internal Message IDs can be obtained using the Get Incident Details command. | 598b*****a3b8 |
Output
To view the sample output data for all commands, refer to this article.
Error Handling
If the Return Data displays Partially Successful or Failed, an Error tab will appear in the Test Result window.
The error tab contains the details responded from D3 SOAR or third-party API calls, including Failure Indicator, Status Code, and Message. This can help locate the root cause of a command failure.
Parts in Error | Description | Example |
Failure Indicator | Indicates the command failure that happened at a specific input and/or API call. | Get Message Details failed. |
Status Code | The response code issued by the third-party API server or the D3 SOAR system that can be used to locate the corresponding error category. For example, if the returned status code is 401, the selected connection is unauthorized to run the command. The user or system support would need to check the permission setting in the Proofpoint Cloud Threat Response portal. Refer to the HTTP Status Code Registry for details. | Status Code: 401. |
Message | The raw data or captured key error message from the integration API server about the API request failure. | Message: Unauthorized. |
Error Sample Data Get Message Details failed. Status Code: 401. Message: Unauthorized. |
Submit Message Body Fetch
Submits requests to fetch the message body from the user's mailbox using the ID field from the Incidents API messages object.
READER NOTE
Internal Message IDs is a required parameter to run this command.
Run the Get Incident Details command to obtain the Internal Message IDs. Internal Message IDs can be found in the raw data at $.messages[*].id.
Input
Input Parameter | Required/Optional | Description | Example |
Internal Message IDs | Required | The Proofpoint internal message IDs used to submit message body fetch requests. Internal Message IDs can be obtained using the Get Incident Details command. |
JSON
|
Output
To view the sample output data for all commands, refer to this article.
Error Handling
If the Return Data displays Partially Successful or Failed, an Error tab will appear in the Test Result window.
The error tab contains the details responded from D3 SOAR or third-party API calls, including Failure Indicator, Status Code, and Message. This can help locate the root cause of a command failure.
Parts in Error | Description | Example |
Failure Indicator | Indicates the command failure that happened at a specific input and/or API call. | Submit Message Body Fetch failed. |
Status Code | The response code issued by the third-party API server or the D3 SOAR system that can be used to locate the corresponding error category. For example, if the returned status code is 401, the selected connection is unauthorized to run the command. The user or system support would need to check the permission setting in the Proofpoint Cloud Threat Response portal. Refer to the HTTP Status Code Registry for details. | Status Code: 401. |
Message | The raw data or captured key error message from the integration API server about the API request failure. | Message: Unauthorized. |
Error Sample Data Submit Message Body Fetch failed. Status Code: 401. Message: Unauthorized. |
Test Connection
Allows users to perform a health check on an integration connection. Users can schedule a periodic health check by selecting Connection Health Check when editing an integration connection.
Input
N/A
Output
Output Type | Description | Return Data Type |
Return Data | Indicates one of the possible command execution states: Successful or Failed. The Failed state can be triggered by any of the following errors:
More details about an error can be viewed in the Error tab. | String |
Error Handling
If the Return Data displays Failed, an Error tab will appear in the Test Result window.
The error tab contains the details responded from D3 SOAR or third-party API calls, including Failure Indicator, Status Code, and Message. This can help locate the root cause of a command failure.
Parts in Error | Description | Example |
Failure Indicator | Indicates the command failure that happened at a specific input and/or API call. | Test Connection failed. Failed to check the connector. |
Status Code | The response code issued by the third-party API server or the D3 SOAR system that can be used to locate the corresponding error category. For example, if the returned status code is 401, the selected connection is unauthorized to run the command. The user or system support would need to check the permission setting in the Proofpoint Cloud Threat Response portal. Refer to the HTTP Status Code Registry for details. | Status Code: 401. |
Message | The raw data or captured key error message from the integration API server about the API request failure. | Message: Unauthorized. |
Error Sample Data Test Connection failed. Failed to check the connector. Status Code: 401. Message: Unauthorized. |