
Expel Workbench
LAST UPDATED: JULY 30, 2025
Overview
Expel Workbench is a security operations platform that provides managed detection and response (MDR) services. It helps cybersecurity teams by automating threat detection, alert analysis, and response actions. The platform integrates with various security tools, reducing alert fatigue by prioritizing significant alerts and filtering out false positives.
D3 SOAR is providing REST operations to function with Expel Workbench. Expel Workbench is available for use in:
Connection
To connect to Expel Workbench from D3 SOAR, follow this part to collect the required information below:
Parameter | Description | Example |
Server URL | The API server URL for the API connection at domain level. | https://workbench.expel.io |
API Key | The API Key you generated on Organization Settings > Service Accounts (only users with API access can view this page and generate API keys - contact sales to upgrade). | ***** |
API Version | The API version to use for the connection. | v2 |
Configuring D3 SOAR to Work with Expel Workbench
Log in to D3 SOAR.
Find the Expel Workbench integration.
Navigate to Configuration on the top header menu.
Click on the Integration icon on the left sidebar.
Type Expel Workbench in the search box to find the integration, then click it to select it.
Click + Connection, on the right side of the Connections section. A new connection window will appear.
Configure the following fields to create a connection to Expel Workbench.
Connection Name: The desired name for the connection.
Site: Specifies the site to use the integration connection. Use the drop-down menu to select the site. The Share to Internal Sites option enables all sites defined as internal sites to use the connection. Selecting a specific site will only enable that site to use the connection.
Recipient site for events from connections Shared to Internal Sites: This field appears if you selected Share to Internal Sites for Site to let you select the internal site to deploy the integration connection.
Agent Name (Optional): Specifies the proxy agent required to build the connection. Use the dropdown menu to select the proxy agent from a list of previously configured proxy agents.
Description (Optional): Add your desired description for the connection.
Tenant (Optional): When configuring the connection from a master tenant site, you have the option to choose the specific tenant sites you want to share the connection with. Once you enable this setting, you can filter and select the desired tenant sites from the dropdowns to share the connection.
Configure User Permissions: Defines which users have access to the connection.
Active: Check the checkbox to ensure the connection is available for use.
System: This section contains the parameters defined specifically for the integration. These parameters must be configured to create the integration connection.
1. Input the Server URL.
2. Copy the API Key from the Expel Workbench platform.
3. Input the API Version. The default value is v4.Enable Password Vault: An optional feature that allows users to take the stored credentials from their own password vault. Refer to the password vault connection guide if needed.
Connection Health Check: Updates the connection status you have created. A connection health check is done by scheduling the Test Connection command of this integration. This can only be done when the connection is active.
To set up a connection health check, check the Connection Health Check tick box. You can customize the interval (minutes) for scheduling the health check. An email notification can be set up after a specified number of failed connection attempts.
Test the connection.
Click Test Connection to verify the account credentials and network connection. If the Test Connection Passed alert window appears, the test connection is successful. You will see Passed with a green check mark appear beside the Test Connection button. If the test connection fails, check your connection parameters and try again.
Click OK to close the alert window.
Click + Add to create and add the configured connection.
Commands
Expel Workbench includes the following executable commands for users to set up schedules or create playbook workflows. With the Test Command, you can execute these commands independently for playbook troubleshooting.
Integration API Note
For more information about the Expel Workbench API, refer to the Expel Workbench API reference.
Note for Time-related parameters
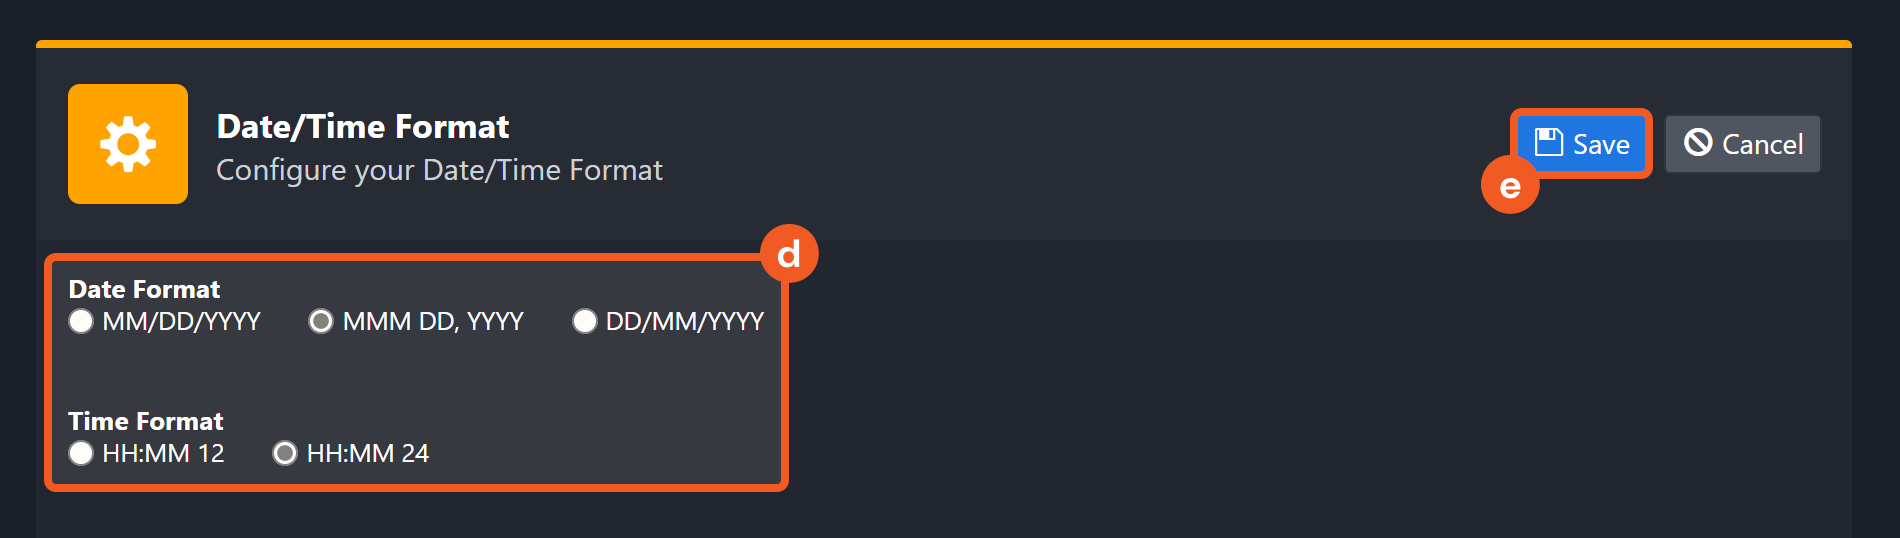
The input format of time-related parameters may vary based on your account settings. As a result, the sample data provided in our commands is different from what you see. To set your preferred time format, follow these steps:
Navigate to Configuration > Application Settings. Select Date/Time Format.
Choose your desired date and time format, then click on the Save button.
After that, you will be able to view your preferred time format when configuring the DateTime input parameters for commands.
Fetch Event
Ingests Expel Workbench alerts or investigations as events based on the specified parameters. The results are sorted by the updated_at timestamp in descending order.
Input
Input Parameter | Required/Optional | Description | Example |
Event Type | Optional | The event type to be ingested. By default, the event type is Alert. | Investigation |
Start Time | Optional | The alerts or investigations updated after the Start Time, in UTC, will be returned. By default, the value is 24 hours prior to the end time. | 2024-08-06 18:00:00 |
End Time | Optional | The alerts or investigations updated before the End Time, in UTC, will be returned. By default, the value is the current time. | 2024-08-06 18:59:59 |
Number of Event(s) Fetched | Optional | The number of the most recently updated events to retrieve. By default, the value is 50. The allowable range is an integer between 1 and 100. To ingest all events that meet the Search Condition, enter -1. | 50 |
Search Condition | Optional | Filters workbench alerts. Refer to Workbench API for details. | filter[status]=IN_PROGRESS&filter[expel_severity]=CRITICAL |
Includes | Optional | The relationship records to include in the alert or investigation response data, such as evidence, investigation, vendor_alerts, etc. For available relationships, refer to the following links: This parameter can be resource intensive, and the records returned by the Includes parameter cannot be paginated – it is all-or-nothing. |
JSON
|
Output
Fetch Event Field Mapping
Fetch Event commands require event field mapping. Field mapping plays a key role for data normalization within the event pipeline. Field mapping converts the original data fields from the different providers to standardized D3 fields as defined by the D3 Model. Refer to Event and Incident Intake Field Mapping for details.
To customize field mapping, click + Add Field and add the custom field of your choice. You can also remove built-in field mappings by clicking x. Note that two underscore characters will automatically prefix the defined Field Name as the System Name for a custom field mapping. Additionally, if an input Field Name contains any spaces, they will automatically be replaced with underscores for the corresponding System Name.
As a system integration, the Expel Workbench integration has some pre-configured field mappings for default field mapping.
Default Event Source
The Default Event Source is the default set of field mappings that are applied when this fetch event command is executed. For out-of-the-box integrations, you will find a set of field mapping provided by the system. Default event source provides field mappings for common fields from fetched events. The default event source has a "Main Event JSON Path" (i.e. $.data) that is used to extract a batch of events from the response raw data. Click Edit Main JSON Path to view the "Main Event JSON Path".
Main Event JSON Path: $.data
The Main Event JSON Path determines the root path where the system starts parsing raw response data into D3 event data. The JSON path begins with $, representing the root element. The path is formed by appending a sequence of child elements to $, each separated by a dot (.). Square brackets with nested quotation marks ([‘...’]) should be used to separate child elements in JSON arrays.
For example, the root node of a JSON Path is data. The child node denoting the Alert Name field would be .attributes.expel_name. Putting it together, the JSON Path expression to extract the Alert Name is $.data.attributes.expel_name.
The pre-configured field mappings are detailed below:
Field Name | Source Field |
Alert Name | .attributes.expel_name |
Alert type | .attributes.alert_type |
Document ID | .id |
Event Type | .type |
Start Time | .attributes.expel_alert_time |
Description | .attributes.expel_message |
Severity | .attributes.expel_severity |
Status | .attributes.status |
Error Handling
If the Return Data displays Failed, an Error tab will appear in the Test Result window.
The error tab contains the details responded from D3 SOAR or third-party API calls, including Failure Indicator, Status Code, and Message. This can help you locate the root cause of a command failure.
Parts in Error | Description | Example |
Failure Indicator | Indicates the command failure that happened at a specific input and/or API call. | Add Channel Member failed. |
Status Code | The response code issued by the third-party API server or the D3 SOAR system that can be used to locate the corresponding error category. For example, if the returned status code is 401, the selected connection is unauthorized to run the command. The user or system support would need to check the permission setting in the Expel Workbench portal. Refer to the HTTP Status Code Registry for details. | Status Code: 401. |
Message | The raw data or captured key error message from the integration API server about the API request failure. | Message: Unauthorized. |
Error Sample Data Fetch Event failed. Status Code: 401. Message: Unauthorized. |
Update Alerts
Updates the specified workbench alerts.
READER NOTE
Alert IDs is a required parameter to run this command.
Run the Fetch Event command to obtain the Alert IDs. Alert IDs can be found in the raw data at the path $.data[*].id.
Input
Input Parameter | Required/Optional | Description | Example |
Alert IDs | Required | The IDs of Expel Workbench alerts to update. Alert ID can be obtained using the Fetch Event command with the Alert event type. |
JSON
|
Attributes | Required | The alert attribute key value pairs to update. |
JSON
|
Relationships | Required | The relationships used to overwrite existing relationships of the specified alerts. |
JSON
|
Includes | Optional | The relationship records to include in the alert response data, such as evidence, investigation, vendor_alerts, etc. For available relationships, refer to Expel Alerts. This parameter can be resource intensive, and the records returned by the Includes parameter cannot be paginated – it is all-or-nothing. |
JSON
|
Output
Error Handling
If the Return Data displays Partially Successful or Failed, an Error tab will appear in the Test Result window.
The error tab contains the details responded from D3 SOAR or third-party API calls, including Failure Indicator, Status Code, and Message. This can help you locate the root cause of a command failure.
Parts in Error | Description | Example |
Failure Indicator | Indicates the command failure that happened at a specific input and/or API call. | Fetch Event failed. |
Status Code | The response code issued by the third-party API server or the D3 SOAR system that can be used to locate the corresponding error category. For example, if the returned status code is 401, the selected connection is unauthorized to run the command. The user or system support would need to check the permission setting in the Expel Workbench portal. Refer to the HTTP Status Code Registry for details. | Status Code: 400. |
Message | The raw data or captured key error message from the integration API server about the API request failure. | Message: Bad Request. |
Error Sample Data Add Channel Member failed. Status Code: 400. Message: Bad Request. |
Update Investigations
Updates the specified investigations.
READER NOTE
Investigation IDs is a required parameter to run this command.
Run the Fetch Event command to obtain the Investigation IDs. Investigation IDs can be found in the raw data at the path $.data[*].id.
Input
Input Parameter | Required/Optional | Description | Example |
Investigation IDs | Required | The IDs of Expel Workbench investigations to update. Investigation ID can be obtained using the Fetch Event command with the Investigation event type. |
JSON
|
Attributes | Required | The key-value pairs of investigation attributes to update. |
JSON
|
Relationships | Required | The relationships used to overwrite existing relationships of the specified investigations. |
JSON
|
Includes | Optional | The relationship records to include in the alert or investigation response data, such as evidence, investigation, vendor_alerts, etc. For available relationships, refer to Expel Investigations. This parameter can be resource intensive, and the records returned by the Includes parameter cannot be paginated – it is all-or-nothing. |
JSON
|
Output
Error Handling
If the Return Data displays Partially Successful or Failed, an Error tab will appear in the Test Result window.
The error tab contains the details responded from D3 SOAR or third-party API calls, including Failure Indicator, Status Code, and Message. This can help you locate the root cause of a command failure.
Parts in Error | Description | Example |
Failure Indicator | Indicates the command failure that happened at a specific input and/or API call. | Update Investigations failed. |
Status Code | The response code issued by the third-party API server or the D3 SOAR system that can be used to locate the corresponding error category. For example, if the returned status code is 401, the selected connection is unauthorized to run the command. The user or system support would need to check the permission setting in the Expel Workbench portal. Refer to the HTTP Status Code Registry for details. | Status Code: 400. |
Message | The raw data or captured key error message from the integration API server about the API request failure. | Message: The value for parameter (Attributes) is invalid. |
Error Sample Data Update Investigations failed. Status Code: 400. Message: The value for parameter (Attributes) is invalid. |
Test Connection
Performs a health check on an integration connection. Users can schedule a periodic health check by selecting Connection Health Check when editing an integration connection.
Input
N/A
Output
Error Handling
If the Return Data displays Failed, an Error tab will appear in the Test Result window.
The error tab contains the details responded from D3 SOAR or third-party API calls, including Failure Indicator, Status Code, and Message. This can help you locate the root cause of a command failure.
Parts in Error | Description | Example |
Failure Indicator | Indicates the command failure that happened at a specific input and/or API call. | Test Connection failed. Failed to check the connector. |
Status Code | The response code issued by the third-party API server or the D3 SOAR system that can be used to locate the corresponding error category. For example, if the returned status code is 401, the selected connection is unauthorized to run the command. The user or system support would need to check the permission setting in the Expel Workbench portal. Refer to the HTTP Status Code Registry for details. | Status Code: 400. |
Message | The raw data or captured key error message from the integration API server about the API request failure. | Message: Server URL is not valid in format. |
Error Sample Data Test Connection failed. Failed to check the connector. Status Code: 400. Message: You must have a valid Support account to call this API |