
Darktrace
LAST UPDATED: DECEMBER 10, 2025
Overview
Darktrace offers intelligent, automatic threat detection and response, powered by self-learning AI that can catch every potential threat.
D3 SOAR is providing REST operations to function with the Darktrace.
For example, you can use Darktrace Integration to monitor your digital infrastructure and take intelligent preventive action to stop any threats from escalating into a crisis.
Darktrace Integration is available for use in:
Connection
Gather the following information to connect D3 SOAR to Darktrace.
Parameter | Description | Example |
Server URL | The Darktrace server URL. | https://usw1-***-01.cloud.darktrace.com |
Private Token | The private token for authentication with Darktrace. | ***** |
Public Token | The public token for authentication with Darktrace. | ***** |
Configuring Darktrace to Work with D3 SOAR
Creating the API token requires access to the Darktrace Threat Visualizer interface and a user account with appropriate permissions to access and modify the System Config page.
Navigate to the System Config page on the Threat Visualizer of the appliance from which to retrieve data. Select Settings from the left-hand menu.
Locate the API Token subsection and click New to obtain a Public and Private token.
The Private token will no longer be displayed after this point.
Configuring D3 SOAR to Work with Darktrace
Log in to D3 SOAR.
Find the Darktrace integration.
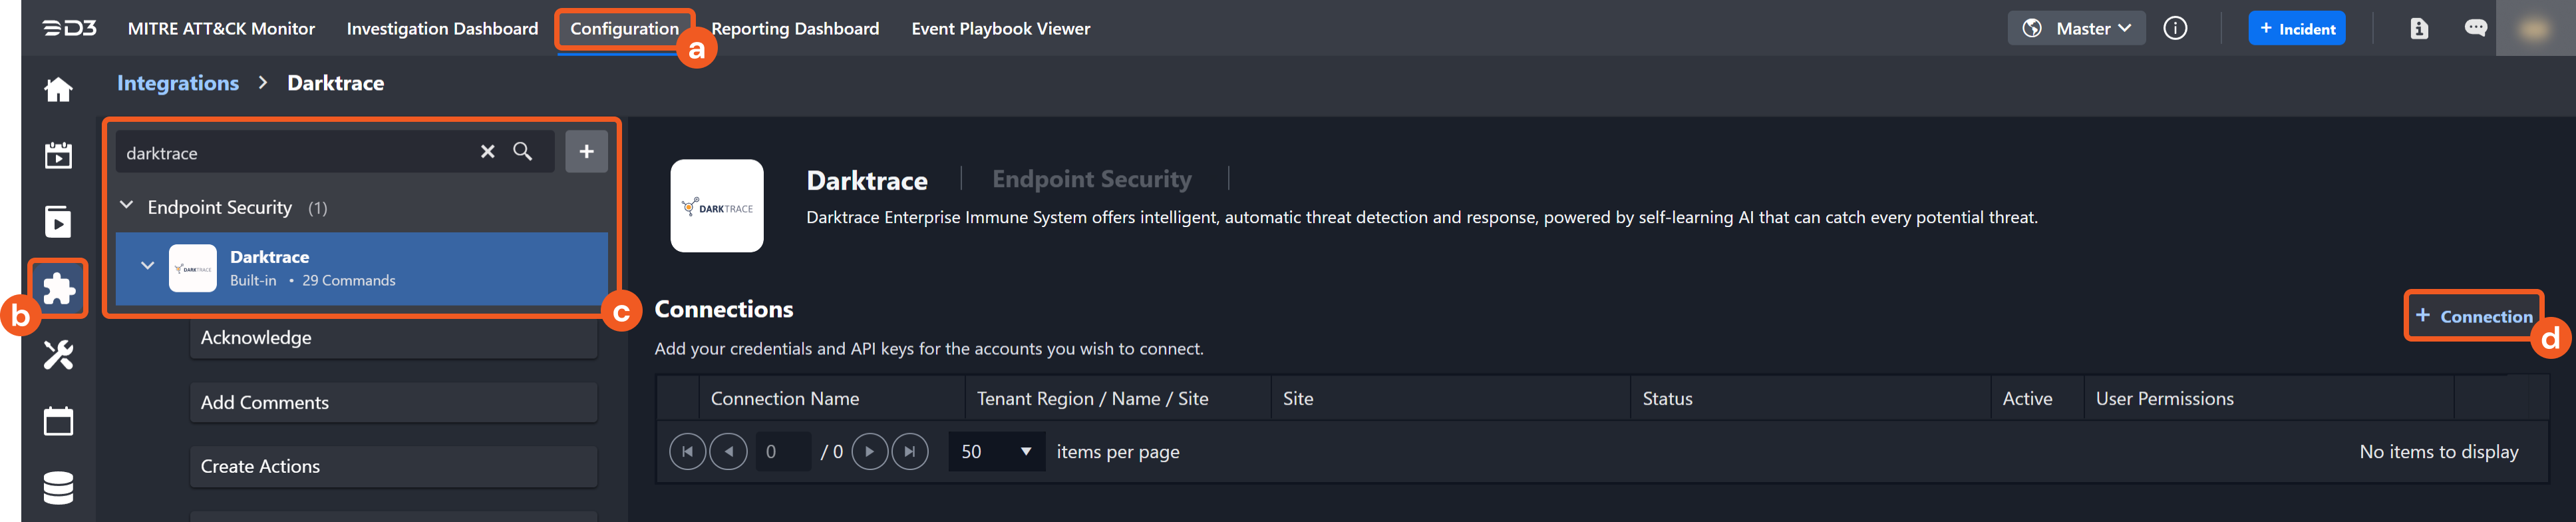
Navigate to Configuration on the top header menu.
Click on the Integration icon on the left sidebar.
Type Darktrace in the search box to find the integration, then click it to select it.
Click + Connection, on the right side of the Connections section. A new connection window will appear.
Configure the following fields to create a connection to Darktrace.
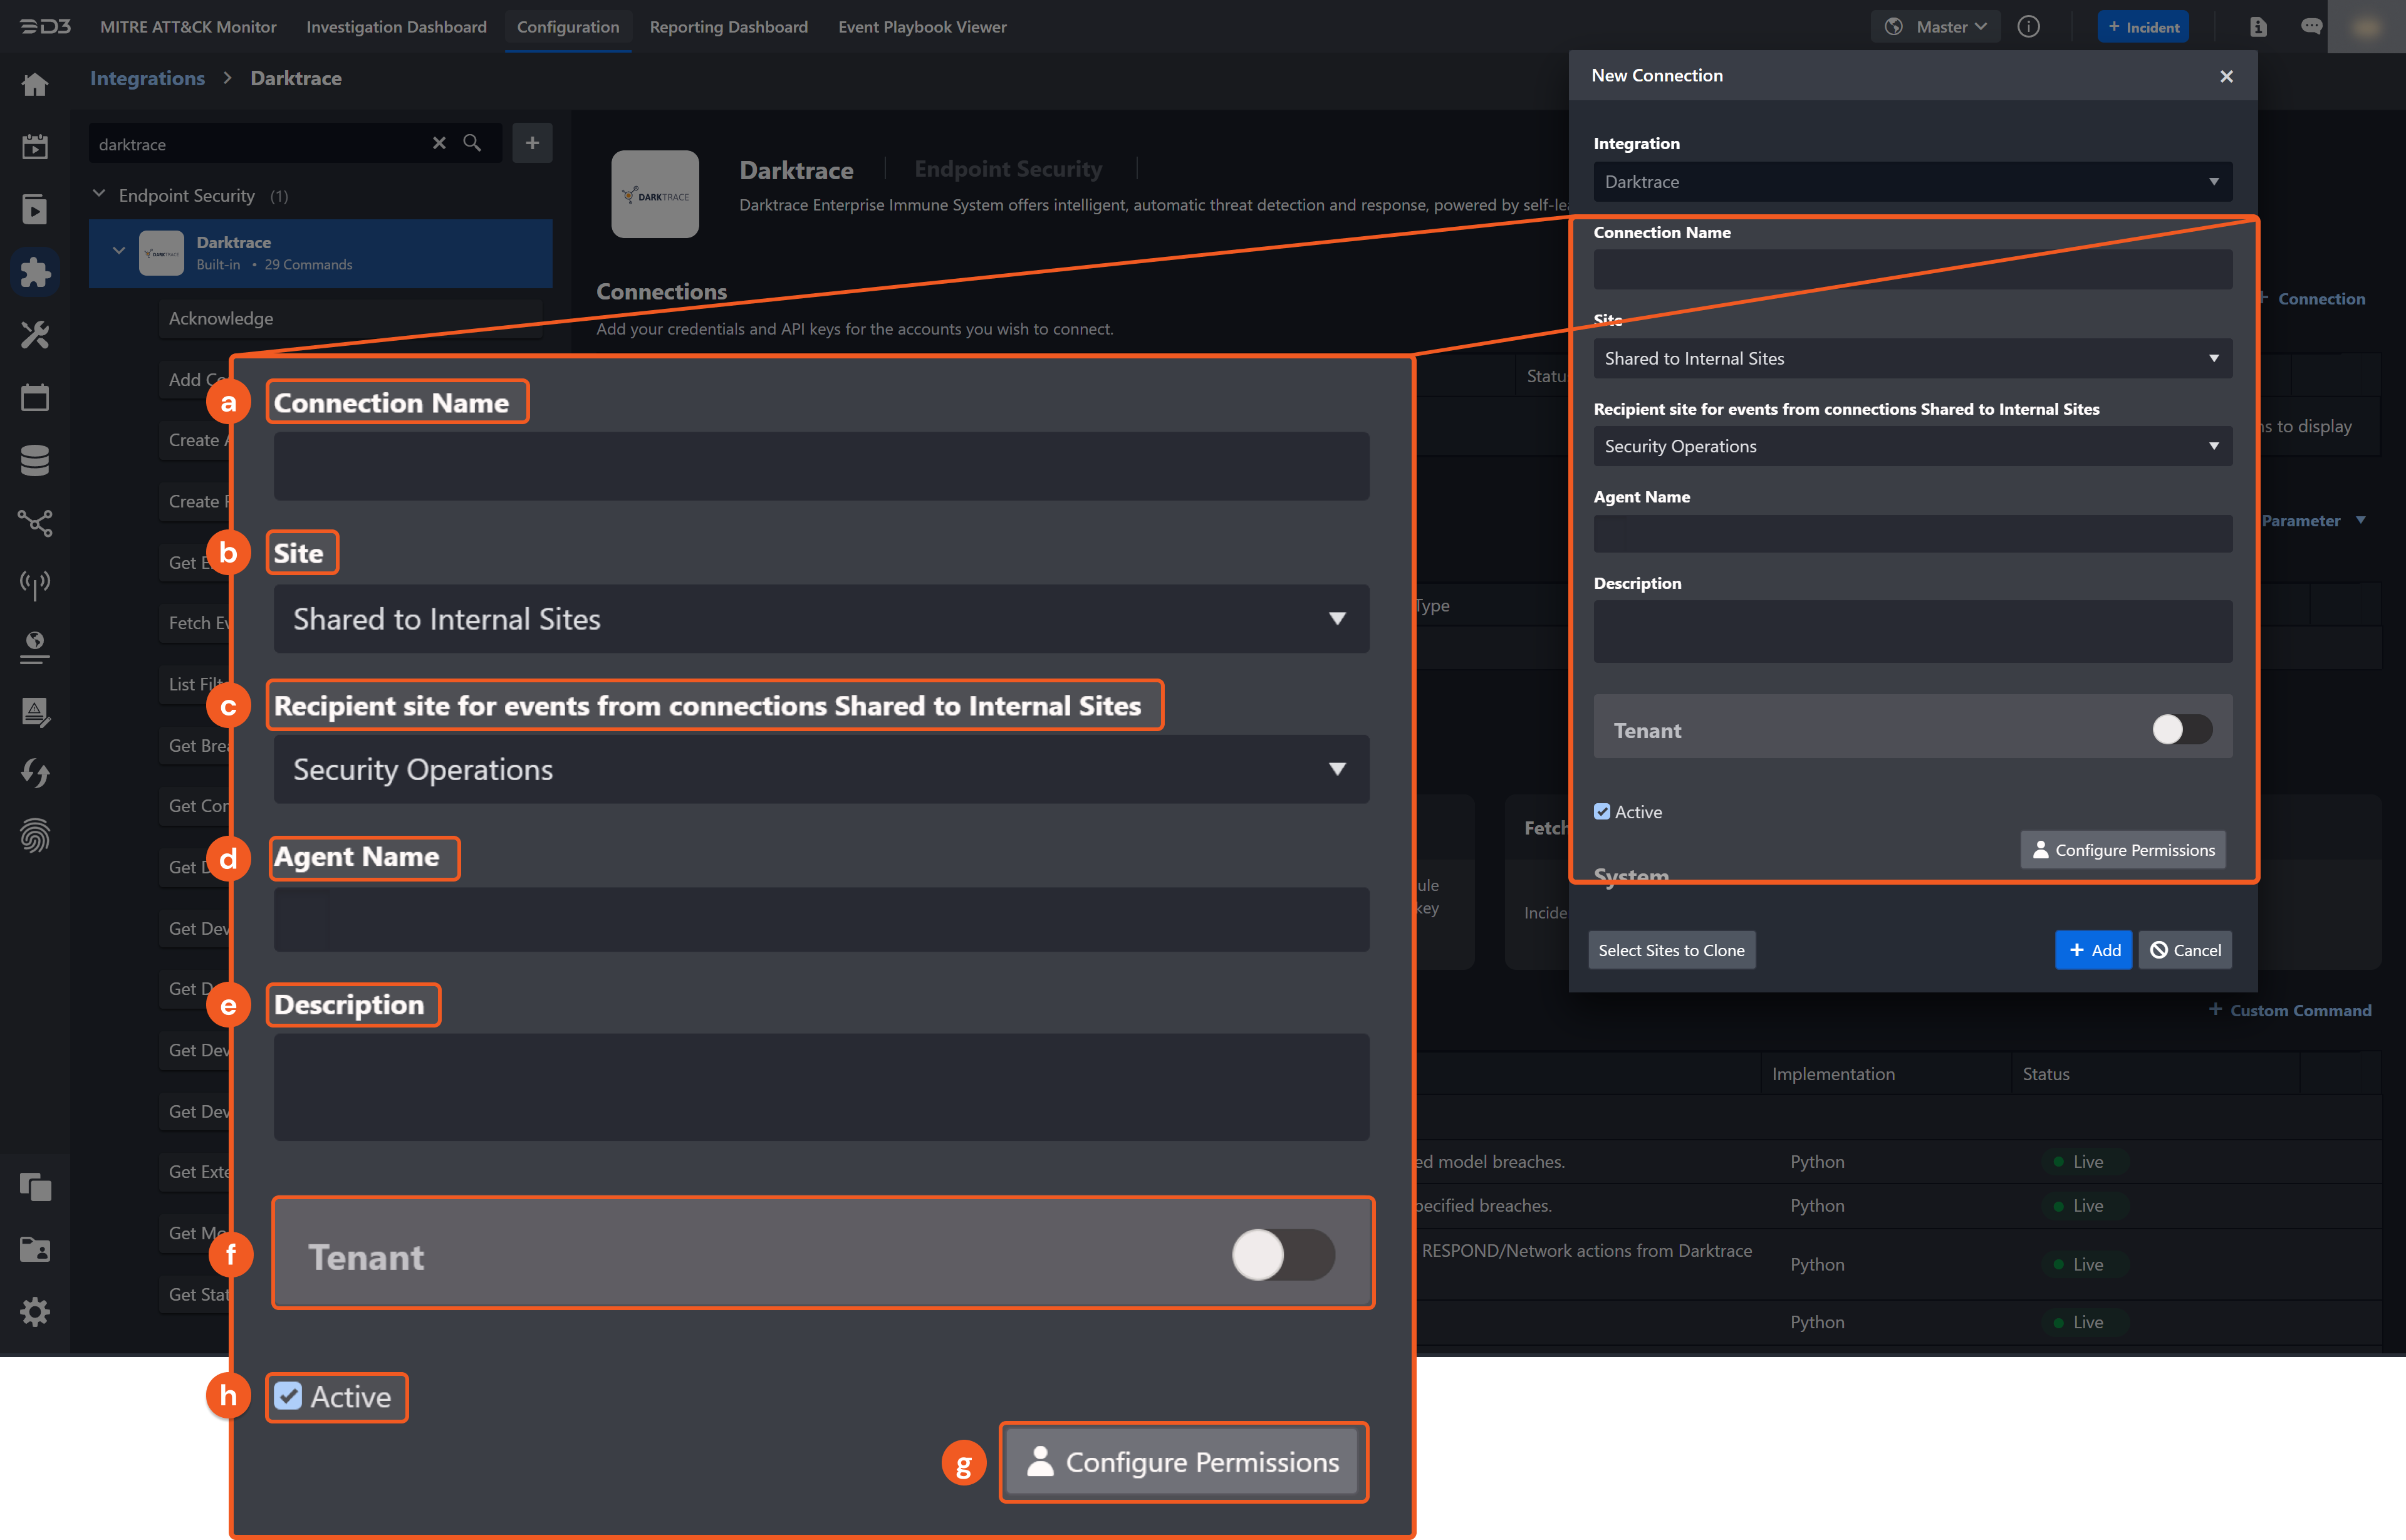
Connection Name: The desired name for the connection.
Site: The site on which to use the integration connection. Use the drop-down menu to select the site. The Share to Internal Sites option enables all internal sites to use the connection. Selecting a specific site will only enable that site to use the connection.
Recipient site for events from connections Shared to Internal Sites: This field is displayed when Share to Internal Sites is selected for the Site field, allowing selection of the internal site for deploying the integration connection.
Agent Name (Optional): The proxy agent required to build the connection. Use the dropdown menu to select the proxy agent from a list of previously configured proxy agents.
Description (Optional): The description for the connection.
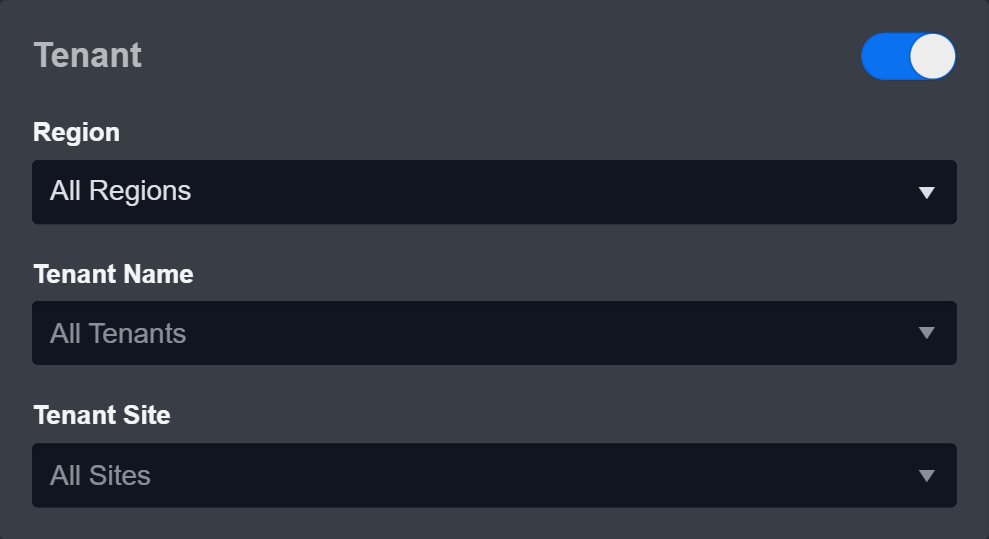
Tenant (Optional): When configuring the connection from a master tenant site, users can choose the specific tenant sites with which to share the connection. Once this setting is enabled, users can filter and select the desired tenant sites from the dropdowns to share the connection.
Configure User Permissions: Defines which users have access to the connection.
Active: The checkbox that enables the connection to be used when selected.
.png?inst-v=58b65ad9-4f60-4ed1-a7f3-2491ba9726de)
System: This section contains the parameters defined specifically for the integration. These parameters must be configured to create the integration connection.
1. Input your domain level Server URL.
2. Input your Public Token.
3. Input your Private Token.Connection Health Check: Periodically checks the connection status by scheduling the Test Connection command at the specified interval (in minutes). Available only for active connections, this feature also allows configuring email notifications for failed attempts.
Enable Password Vault: An optional feature that allows users to take the stored credentials from their own password vault. Refer to the password vault connection guide if needed.
Test the connection.
Click on the Test Connection button to verify credentials and connectivity. A success alert displays Passed with a green checkmark. If the connection fails, review the parameters and retry.
Click OK to close the alert window.
Click + Add to create and add the configured connection.
Commands
Darktrace includes the following executable commands for users to set up schedules or create playbook workflows. With the Test Command, users can execute these commands independently for playbook troubleshooting.
Note for Time-related parameters
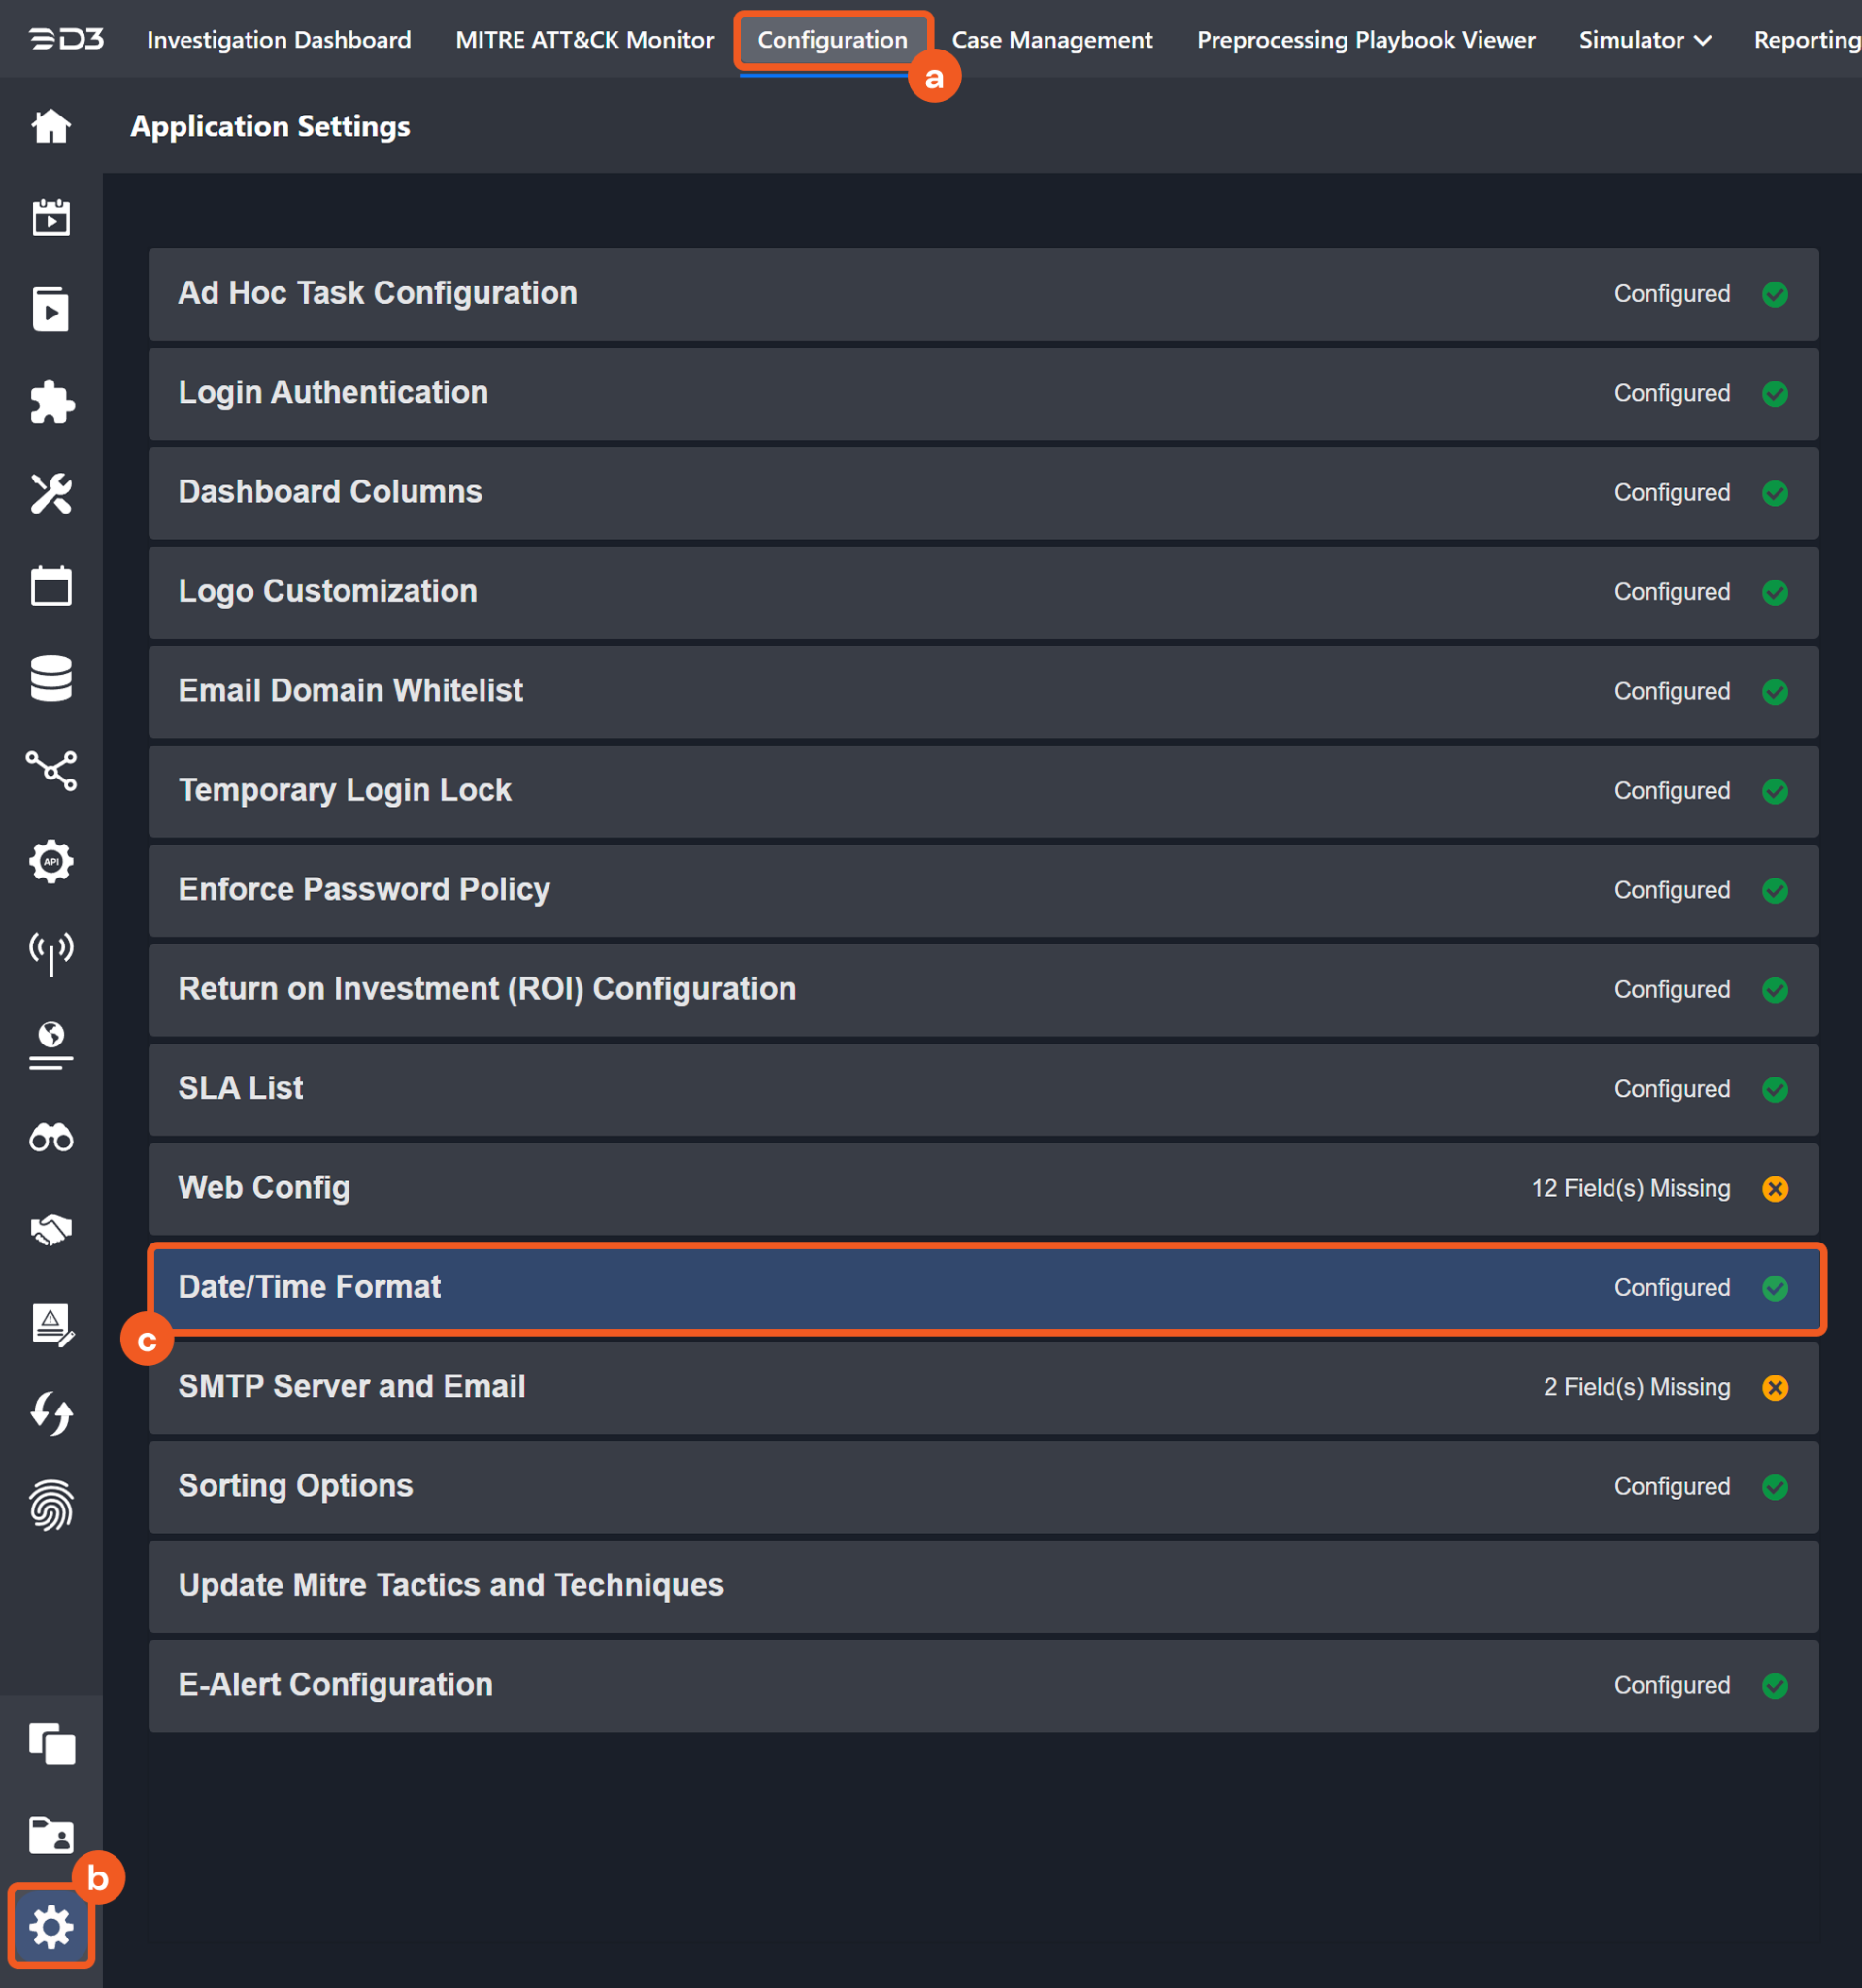
The input format of time-related parameters may vary based on user account settings, which may cause the sample data in commands to differ from what is displayed. To adjust the time format, follow these steps:
Navigate to Configuration > Application Settings. Select Date/Time Format.
Choose the desired date and time format, then click on the Save button.
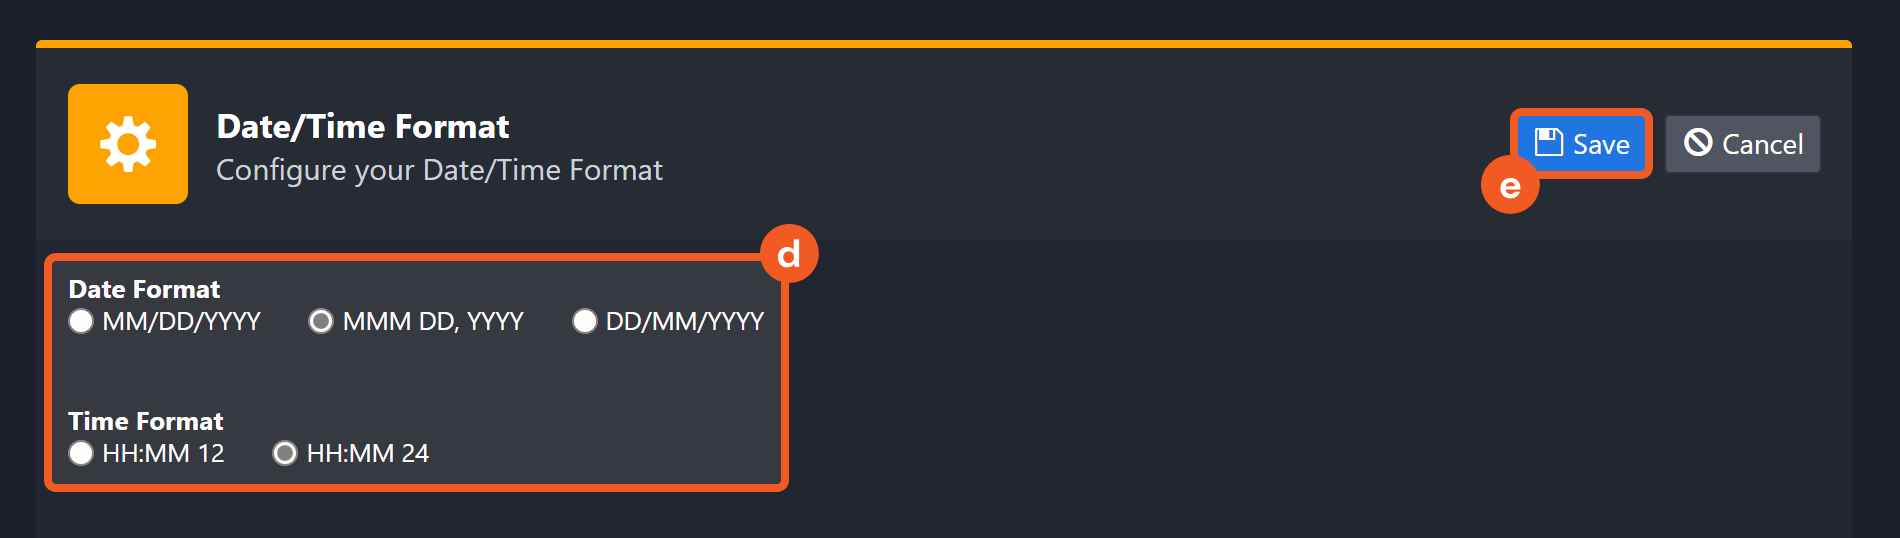
The selected time format will now be visible when configuring Date/Time command input parameters.
Acknowledge
Acknowledges the specified model breaches.
READER NOTE
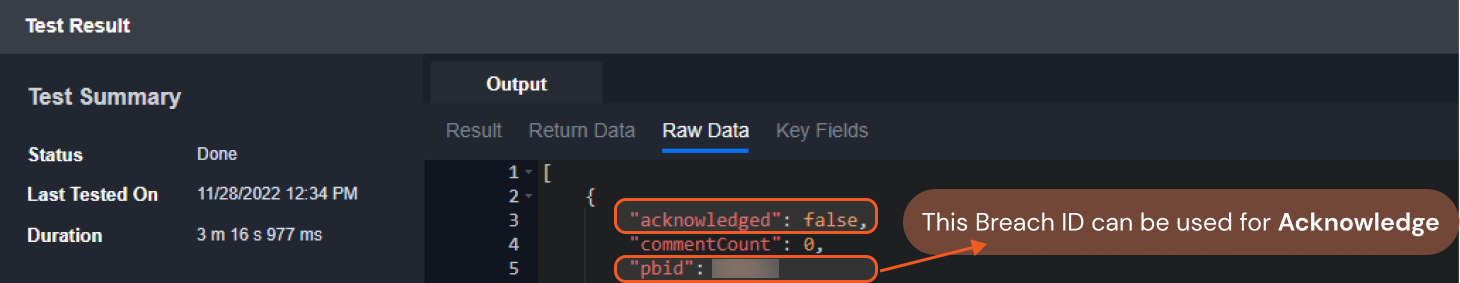
Breach IDs is a required parameter to run this command.
Run the Search Breaches command to obtain the Breach IDs. Breach IDs can be found in the raw data at $[*].pbid.
The Fetch Event response exposes breach-acknowledgment status at the JSON path $.[*].acknowledge. A value of false indicates unacknowledged breaches. The associated breach IDs appear under the pbid key.
Input
Input Parameter | Required/Optional | Description | Example |
Breach IDs | Required | The ID(s) of the model breach(es) to acknowledge. Breach IDs can be obtained using the Search Breaches command. |
JSON
|
Output
To view the sample output data for all commands, refer to this article.
Error Handling
If the Return Data is Partially Successful or Failed, an Error tab will appear in the Test Result window.
The error tab contains the details responded from D3 SOAR or third-party API calls, including Failure Indicator, Status Code, and Message. This can help locate the root cause of a command failure.
Parts in Error | Description | Example |
Failure Indicator | Indicates the command failure that happened at a specific input and/or API call. | Acknowledge failed. |
Status Code | The response code issued by the third-party API server or the D3 SOAR system that can be used to locate the corresponding error category. For example, if the returned status code is 401, the selected connection is unauthorized to run the command. The user or system support would need to check the permission setting in the Darktrace portal. Refer to the HTTP Status Code Registry for details. | Status Code: 400. |
Message | The raw data or captured key error message from the integration API server about the API request failure. | Message: ERROR |
Error Sample Data Acknowledge failed. Status Code: 400. Message: ERROR |
Add Comments
Adds a comment to the specified breaches.
READER NOTE
Breach IDs is a required parameter to run this command.
Run the Search Breaches command to obtain the Breach IDs. Breach IDs can be found in the raw data at $[*].pbid.
Input
Input Parameter | Required/Optional | Description | Example |
Breach IDs | Required | The ID(s) of the model breach(es) to add a comment. Breach IDs can be obtained using the Search Breaches command. |
JSON
|
Comment | Required | The comment text to add. | Hello World!!! |
Output
To view the sample output data for all commands, refer to this article.
Error Handling
If the Return Data is Failed, an Error tab will appear in the Test Result window.
The error tab contains the details responded from D3 SOAR or third-party API calls, including Failure Indicator, Status Code, and Message. This can help locate the root cause of a command failure.
Parts in Error | Description | Example |
Failure Indicator | Indicates the command failure that happened at a specific input and/or API call. | Add Comments failed. |
Status Code | The response code issued by the third-party API server or the D3 SOAR system that can be used to locate the corresponding error category. For example, if the returned status code is 401, the selected connection is unauthorized to run the command. The user or system support would need to check the permission setting in the Darktrace portal. Refer to the HTTP Status Code Registry for details. | Status Code: 400. |
Message | The raw data or captured key error message from the integration API server about the API request failure. | Message: API SIGNATURE ERROR. |
Error Sample Data Add Comments failed. Status Code: 400. Message: API SIGNATURE ERROR. |
Create Actions
Creates manual Darktrace RESPOND/Network actions from Darktrace Threat Visualizer 6.
READER NOTE
Device IDs is a required parameter to run this command.
Run the List Devices command to obtain the Device IDs. Device IDs can be found in the raw data at $[*].did.
Input
Input Parameter | Required/Optional | Description | Example |
Device IDs | Required | The IDs of the devices modeled in the Darktrace system on which to take action. Device IDs can be obtained using the List Devices command. |
JSON
|
Action | Required | The action to take on the specified devices. Available action options are Block Matching Connections(connection), Enforce pattern of life(pol), Enforce group pattern of life(gpol), Quarantine device(quarantine), Block all outgoing traffic(quarantineOutgoing) and Block all incoming traffic(quarantineIncoming). | Block Matching Connections |
Duration | Optional | The duration of the action in seconds. If this parameter is not defined, the default duration is 60 seconds. | 30 |
Reason | Optional | The purpose of the action. | Test |
Connections | Optional | The connection pairs to block against. Inputs are in Array format with available fields src, dst and port. Please note, this parameter is valid only for the Action parameter choose to Connections. Each connection pair must include src and dst fields, and port field is optional. Src can be an IP or hostname of an endpoint to block connections from. Dst can be an IP or hostname of an endpoint to block connections to. Port is an optional port for dst. |
JSON
|
Output
To view the sample output data for all commands, refer to this article.
Error Handling
If the Return Data is Partially Successful or Failed, an Error tab will appear in the Test Result window.
The error tab contains the details responded from D3 SOAR or third-party API calls, including Failure Indicator, Status Code, and Message. This can help locate the root cause of a command failure.
Parts in Error | Description | Example |
Failure Indicator | Indicates the command failure that happened at a specific input and/or API call. | Create Actions failed. |
Status Code | The response code issued by the third-party API server or the D3 SOAR system that can be used to locate the corresponding error category. For example, if the returned status code is 401, the selected connection is unauthorized to run the command. The user or system support would need to check the permission setting in the Darktrace portal. Refer to the HTTP Status Code Registry for details. | Status Code: 404 |
Message | The raw data or captured key error message from the integration API server about the API request failure. | Message: Device ID Not found. |
Error Sample Data Create Actions failed. Status Code: 404 Message: Device ID Not found. |
Create PCAP
Creates new PCAP files.
Input
Input Parameter | Required/Optional | Description | Example |
Source IP | Required | The source IP of connections in the packet capture. | ***.***.***.*** |
Source Port | Optional | The port number for the source IP. | 443 |
Destination IP | Optional | The destination IP of connections in the packet capture. | ***.***.***.*** |
Destination Port | Optional | The port number for the destination IP. | 80 |
Start Time | Required | The start time for the packet capture in UTC time. Please note, the maximum timeframe for PCAP creation between Start Time and End Time is 30 minutes. | 2023-01-24 00:00 |
End Time | Required | The end time for the packet capture in UTC time. Please note, the maximum timeframe for PCAP creation between Start Time and End Time is 30 minutes. | 2023-01-25 00:00 |
Protocol | Optional | The layer 3 protocol to be specified. Accepts “TCP” or “UDP”. Please note, to use the protocol filter, the Destination IP and Destination port must be specified. | TCP |
Output
To view the sample output data for all commands, refer to this article.
Error Handling
If the Return Data is Failed, an Error tab will appear in the Test Result window.
The error tab contains the details responded from D3 SOAR or third-party API calls, including Failure Indicator, Status Code, and Message. This can help locate the root cause of a command failure.
Parts in Error | Description | Example |
Failure Indicator | Indicates the command failure that happened at a specific input and/or API call. | Create PCAP failed. |
Status Code | The response code issued by the third-party API server or the D3 SOAR system that can be used to locate the corresponding error category. For example, if the returned status code is 401, the selected connection is unauthorized to run the command. The user or system support would need to check the permission setting in the Darktrace portal. Refer to the HTTP Status Code Registry for details. | Status Code: 403. |
Message | The raw data or captured key error message from the integration API server about the API request failure. | Message: Invalid Source IP. |
Error Sample Data Create PCAP failed. Status Code: 403. Message: Invalid Source IP. |
Get Enumerated Types
Returns the corresponding string values for numeric codes (enumerated types) that are used in many API responses.
Input
Input Parameter | Required/Optional | Description | Example |
Enumerated Types | Optional | The enumerated type to retrieve string values for numeric codes. The valid enumerated types are applicationprotocols, protocols, countries, destinationdevicetypes, sourcedevicetypes and vendors. If this parameter is not defined, all enumerated types will be returned. |
JSON
|
Output
To view the sample output data for all commands, refer to this article.
Error Handling
If the Return Data is Partially Successful or Failed, an Error tab will appear in the Test Result window.
The error tab contains the details responded from D3 SOAR or third-party API calls, including Failure Indicator, Status Code, and Message. This can help locate the root cause of a command failure.
Parts in Error | Description | Example |
Failure Indicator | Indicates the command failure that happened at a specific input and/or API call. | Get Enumerated Types failed. |
Status Code | The response code issued by the third-party API server or the D3 SOAR system that can be used to locate the corresponding error category. For example, if the returned status code is 401, the selected connection is unauthorized to run the command. The user or system support would need to check the permission setting in the Darktrace portal. Refer to the HTTP Status Code Registry for details. | Status Code: 400. |
Message | The raw data or captured key error message from the integration API server about the API request failure. | Message: API SIGNATURE ERROR. |
Error Sample Data Get Enumerated Types failed. Status Code: 400. Message: API SIGNATURE ERROR. |
Fetch Event
Returns events (model breaches) based on the specified criteria. Note: Events beyond one year cannot be returned.
READER NOTE
The syntax for the Search Condition input parameter is the following:
<field1>=<value1>&<field2>=<value2>....
Available input filter fields are:
did
minscore
pid
pbid
uuid
& is the AND operator, which is the only supported operator for input.
Without defined parameters, up to 100 events within a year are returned.
If only Start Time and End Time parameters are defined, all events within the time range will be returned.
Input
Input Parameter | Required/Optional | Description | Example |
Start Time | Optional | The start time of the time range to fetch events in UTC time. Note: Both Start Time and End Time must be defined for the input value of this command to be effective. Otherwise, breaches within a year will return. | 2023-01-26 00:00 |
End Time | Optional | The end time of the time range to fetch events in UTC time format. Note: Both Start Time and End Time must be defined for the input value of this command to be effective. Otherwise, breaches within a year will return. | 2023-01-27 00:00 |
Number of Event(s) Fetched | Optional | The number of events to return. Note: If this parameter is not defined, but the Start Time and End time parameters are, all breaches between the specified time range will be returned. If all three parameters are not defined, the default value of 100 for this parameter will be used. | 10 |
Search Condition | Optional | The search condition to filter fetched events. The syntax for the Search Condition input parameter is <field1>=<value1>&<field2>=<value2>.... The available input filter fields are did, minscore, pid, pbid and uuid. Note: Do not input time range fields (i.e. starttime, endtime, from and to). They will be overridden by the Start Time and End Time parameters. | did=33&minscore=0.5 |
Tolerance Scope | Optional | The tolerance scope (the default value is 10) in minutes of the query to fetch events between start and end time to avoid the loss of events. Events will be fetched between {Start Time - Tolerance Scope, End Time}. | 0 |
Output
To view the sample output data for all commands, refer to this article.
Fetch Event Field Mapping
The Darktrace system integration includes pre-configured field mappings for the default event source.
The Default Event Source is the default system-provided set of field mappings applied when the fetch event command is executed. It includes a Main Event JSON Path, which is the JSONPath expression that points to the base array of event objects. The source field path continues from this array to locate the required data.
The Main Event JSON Path can be viewed by clicking on the Edit Main JSON Path button.
.png?inst-v=58b65ad9-4f60-4ed1-a7f3-2491ba9726de)
Main Event JSON Path: $
The root array contains the event objects. Within each event object, the key pbid denotes the Unique Event Key field. As such, the full JSONPath expression to extract the Unique Event Key is $.pbid.
The pre-configured field mappings are detailed below:
Field Name | Source Field |
Unique Event Key | .pbid |
Event Type | .model.now.name |
Start Time | .time |
Description | .model.now.description |
Score | .score |
Device | .device.hostname |
Device IP Address | .device.ip |
Device Mac Address | .device.macaddress |
Device category | .device.typelabel |
Device ID | .device.did |
Acknowledged | .acknowledged |
Creation Time | .creationTime |
Severity | .model.now.category |
Priority | .model.now.priority |
Metric Logic ID | .triggeredComponents[*].metric.mlid |
Metric Name | .triggeredComponents[*].metric.label |
Error Handling
If the Return Data is Failed, an Error tab will appear in the Test Result window.
The error tab contains the details responded from D3 SOAR or third-party API calls, including Failure Indicator, Status Code, and Message. This can help locate the root cause of a command failure.
Parts in Error | Description | Example |
Failure Indicator | Indicates the command failure that happened at a specific input and/or API call. | Fetch Event failed. |
Status Code | The response code issued by the third-party API server or the D3 SOAR system that can be used to locate the corresponding error category. For example, if the returned status code is 401, the selected connection is unauthorized to run the command. The user or system support would need to check the permission setting in the Darktrace portal. Refer to the HTTP Status Code Registry for details. | Status Code: 400. |
Message | The raw data or captured key error message from the integration API server about the API request failure. | Message: API SIGNATURE ERROR. |
Error Sample Data Fetch Event failed. Status Code: 400. Message: API SIGNATURE ERROR. |
List Filter Types
Returns all internal Darktrace filters used in the Model Editor, their filter types (e.g. boolean and numeric) and the available comparators.
Input
N/A
Output
To view the sample output data for all commands, refer to this article.
Error Handling
If the Return Data is Failed, an Error tab will appear in the Test Result window.
The error tab contains the details responded from D3 SOAR or third-party API calls, including Failure Indicator, Status Code, and Message. This can help locate the root cause of a command failure.
Parts in Error | Description | Example |
Failure Indicator | Indicates the command failure that happened at a specific input and/or API call. | List Filter Types failed. |
Status Code | The response code issued by the third-party API server or the D3 SOAR system that can be used to locate the corresponding error category. For example, if the returned status code is 401, the selected connection is unauthorized to run the command. The user or system support would need to check the permission setting in the Darktrace portal. Refer to the HTTP Status Code Registry for details. | Status Code: 400. |
Message | The raw data or captured key error message from the integration API server about the API request failure. | Message: API DATE ERROR. |
Error Sample Data List Filter Types failed. Status Code: 400. Message: API DATE ERROR. |
Get Breaches
Returns information from the specified model breaches.
READER NOTE
Breach IDs is a required parameter to run this command.
Run the Search Breaches command to obtain the Breach IDs. Breach IDs can be found in the raw data at $[*].pbid.
The command returns both acknowledged and unacknowledged breaches.
Input
Input Parameter | Required/Optional | Description | Example |
Breach IDs | Required | The ID(s) of the model breach(es) to retrieve information from. Breach IDs can be obtained using the Search Breaches command. |
JSON
|
Output
To view the sample output data for all commands, refer to this article.
Error Handling
If the Return Data is Partially Successful or Failed, an Error tab will appear in the Test Result window.
The error tab contains the details responded from D3 SOAR or third-party API calls, including Failure Indicator, Status Code, and Message. This can help locate the root cause of a command failure.
Parts in Error | Description | Example |
Failure Indicator | Indicates the command failure that happened at a specific input and/or API call. | Get Breaches failed. |
Status Code | The response code issued by the third-party API server or the D3 SOAR system that can be used to locate the corresponding error category. For example, if the returned status code is 401, the selected connection is unauthorized to run the command. The user or system support would need to check the permission setting in the Darktrace portal. Refer to the HTTP Status Code Registry for details. | Status Code: 400. |
Message | The raw data or captured key error message from the integration API server about the API request failure. | Message: API DATE ERROR. |
Error Sample Data Get Breaches failed. Status Code: 400. Message: API DATE ERROR. |
Get Comments
Returns the current comments of the specified model breaches. The returned comments are sorted by comment time, in ascending order.
READER NOTE
Breach IDs is a required parameter to run this command.
Run the Search Breaches command to obtain the Breach IDs. Breach IDs can be found in the raw data at $[*].pbid.
Input
Input Parameter | Required/Optional | Description | Example |
Breach IDs | Required | The ID(s) of the model breach(es) to retrieve comments. Breach IDs can be obtained using the Search Breaches command. |
JSON
|
Output
To view the sample output data for all commands, refer to this article.
Error Handling
If the Return Data is Failed, an Error tab will appear in the Test Result window.
The error tab contains the details responded from D3 SOAR or third-party API calls, including Failure Indicator, Status Code, and Message. This can help locate the root cause of a command failure.
Parts in Error | Description | Example |
Failure Indicator | Indicates the command failure that happened at a specific input and/or API call. | Get Comments failed. |
Status Code | The response code issued by the third-party API server or the D3 SOAR system that can be used to locate the corresponding error category. For example, if the returned status code is 401, the selected connection is unauthorized to run the command. The user or system support would need to check the permission setting in the Darktrace portal. Refer to the HTTP Status Code Registry for details. | Status Code: 400. |
Message | The raw data or captured key error message from the integration API server about the API request failure. | Message: API DATE ERROR. |
Error Sample Data Get Comments failed. Status Code: 400. Message: API DATE ERROR. |
Get Details
Returns a time-sorted list of connections and events for a device or entity (e.g. a SaaS credential). The request requires a device (returned under the “did” field of the raw data from the List Devices command), a model breach ID (returned under the “pbid” field of the raw data from the Search Breaches command) or a message field value (“msg”). You must specify at least one of three parameters - device ID, breach ID or message.
ALERT
At least one of Device ID, Breach ID, or Message must be defined. The command applies all input parameters using the AND operator, and only connections and events matching all conditions are returned. Otherwise, the command may return no results.
READER NOTE
Device ID and Breach ID are optional parameters to run this command.
Run the List Devices command to obtain the Device ID. Device IDs can be found in the raw data at $[*].did.
Run the Search Breaches command to obtain the Breach ID. Breach IDs can be found in the raw data at $[*].pbid.
The format of the returned raw data may vary depending on the returned connections and events.
Input
Input Parameter | Required/Optional | Description | Example |
Start Time | Optional | The start time of the time range to search for connections and events in UTC time. | 2023-01-26 00:00 |
End Time | Optional | The end time of the time range to search for connections and events in UTC time. | 2023-01-27 00:00 |
Device ID | Optional | The ID of the device to retrieve corresponding connections and events. Device IDs can be obtained using the List Devices command. | *** |
Breach ID | Optional | The ID of the model breach to retrieve corresponding connections and events. Breach IDs can be obtained using the Search Breaches command. | *** |
Message | Optional | The value of the message field in notice events to return details for. Typically used to specify user credential strings. | google.com |
Event Type | Optional | The event type to retrieve details. The valid event types are Connection, Unusual Connection, New Connection, Notice, Device History, Model Breach, and Policy Breach. If not specified, all types of events will be returned. | 3 |
Count | Optional | The number of items to return. If this parameter is not defined, but the Start Time and End time parameters are, all connections and events between the specified time range will be returned. If all three parameters are not defined, the default value of 200 will be used for this parameter. | 10 |
Output
To view the sample output data for all commands, refer to this article.
Error Handling
If the Return Data is Failed, an Error tab will appear in the Test Result window.
The error tab contains the details responded from D3 SOAR or third-party API calls, including Failure Indicator, Status Code, and Message. This can help locate the root cause of a command failure.
Parts in Error | Description | Example |
Failure Indicator | Indicates the command failure that happened at a specific input and/or API call. | Get Details failed. |
Status Code | The response code issued by the third-party API server or the D3 SOAR system that can be used to locate the corresponding error category. For example, if the returned status code is 401, the selected connection is unauthorized to run the command. The user or system support would need to check the permission setting in the Darktrace portal. Refer to the HTTP Status Code Registry for details. | Status Code: 400. |
Message | The raw data or captured key error message from the integration API server about the API request failure. | Message: API SIGNATURE ERROR. |
Error Sample Data Get Details failed. Status Code: 400. Message: API SIGNATURE ERROR. |
Get Device Info
Returns the data used in the “Connections Data” view for the specified device(s) that can be accessed from the Threat Visualizer omnisearch. The data returned covers a 4 week period.
READER NOTE
Device ID and Destination Device ID are required parameters to run this command.
Run the List Devices command to obtain Device ID and Destination Device ID. It can be found in the raw data at $[*].did.
Input
Input Parameter | Required/Optional | Description | Example |
Device ID | Required | The ID of the device to retrieve info about. Device IDs can be obtained using the List Devices command. |
JSON
|
Data Type | Optional | The type of return data for either Connections, Data Size Out, or Data Size In. If this parameter is not defined, the default value is Connections. | Connections |
Destination Device ID | Optional | The ID of the destination device modeled in the Darktrace system to restrict data to. You can get Device ID using the List Devices command. If this parameter is not defined, all external connectivity will be returned. | ***** |
External Domain | Optional | Restricts external data to a particular domain name. | google.com |
Port | Optional | Restricts returned connection data to the port specified. | *** |
Output
To view the sample output data for all commands, refer to this article.
Error Handling
If the Return Data is Failed, an Error tab will appear in the Test Result window.
The error tab contains the details responded from D3 SOAR or third-party API calls, including Failure Indicator, Status Code, and Message. This can help locate the root cause of a command failure.
Parts in Error | Description | Example |
Failure Indicator | Indicates the command failure that happened at a specific input and/or API call. | Get Device Info failed. |
Status Code | The response code issued by the third-party API server or the D3 SOAR system that can be used to locate the corresponding error category. For example, if the returned status code is 401, the selected connection is unauthorized to run the command. The user or system support would need to check the permission setting in the Darktrace portal. Refer to the HTTP Status Code Registry for details. | Status Code: 404. |
Message | The raw data or captured key error message from the integration API server about the API request failure. | Message: Device ID not found. |
Error Sample Data Get Device Info failed. Status Code: 404. Message: Device ID not found. |
Get Device Metric Data
Returns time series metrics data of a device. The default interval is 1 minute. If the Start Time and End Time parameters are not specified, the default time range is from 10 hours ago to the current time. It is suggested not to enter a large time range to avoid oversized return data.
READER NOTE
Device ID and Metric Name are required parameters to run this command.
Run the List Devices command to obtain the Device ID. Device IDs can be found in the raw data at $[*].did.
Run the List Metrics command to obtain the Metric Name. Metric Name can be found in the raw data at $[*].name.
Input
Input Parameter | Required/Optional | Description | Example |
Device ID | Required | The ID of the device to retrieve metrics data. Device IDs can be obtained using the List Devices command. | 33 |
Metric Name | Required | The name of the metric to return. Metric names can be obtained using the List Metrics command. |
JSON
|
Start Time | Optional | The start time of the time range to fetch metrics data in UTC time. | 2023-01-28 00:00 |
End Time | Optional | The end time of the time range to fetch metrics data in UTC time. | 2023-01-29 00:00 |
Output
To view the sample output data for all commands, refer to this article.
Error Handling
If the Return Data is Failed, an Error tab will appear in the Test Result window.
The error tab contains the details responded from D3 SOAR or third-party API calls, including Failure Indicator, Status Code, and Message. This can help locate the root cause of a command failure.
Parts in Error | Description | Example |
Failure Indicator | Indicates the command failure that happened at a specific input and/or API call. | Get Device Metric Data failed. |
Status Code | The response code issued by the third-party API server or the D3 SOAR system that can be used to locate the corresponding error category. For example, if the returned status code is 401, the selected connection is unauthorized to run the command. The user or system support would need to check the permission setting in the Darktrace portal. Refer to the HTTP Status Code Registry for details. | Status Code: 400. |
Message | The raw data or captured key error message from the integration API server about the API request failure. | Message: API SIGNATURE ERROR. |
Error Sample Data Get Device Metric Data failed. Status Code: 400. Message: API SIGNATURE ERROR. |
Get Device Summary
Returns contextual information for the specified device(s).
READER NOTE
Device ID is a required parameter to run this command.
Run the List Devices command to obtain the Device ID. Device IDs can be found in the raw data at $[*].did.
Input
Input Parameter | Required/Optional | Description | Example |
Device ID | Required | The ID of the device to retrieve the summary. Device IDs can be obtained using the List Devices command. |
JSON
|
Output
To view the sample output data for all commands, refer to this article.
Error Handling
If the Return Data is Partially Successful or Failed, an Error tab will appear in the Test Result window.
The error tab contains the details responded from D3 SOAR or third-party API calls, including Failure Indicator, Status Code, and Message. This can help locate the root cause of a command failure.
Parts in Error | Description | Example |
Failure Indicator | Indicates the command failure that happened at a specific input and/or API call. | Get Device Summary failed. |
Status Code | The response code issued by the third-party API server or the D3 SOAR system that can be used to locate the corresponding error category. For example, if the returned status code is 401, the selected connection is unauthorized to run the command. The user or system support would need to check the permission setting in the Darktrace portal. Refer to the HTTP Status Code Registry for details. | Status Code: 404. |
Message | The raw data or captured key error message from the integration API server about the API request failure. | Message: Device ID Not Found. |
Error Sample Data Get Device Summary failed. Status Code: 404. Message: Device ID Not Found. |
Get Device Tags
Retrieves the current tag(s) for the specified device.
READER NOTE
Device ID is a required parameter to run this command.
Run the List Devices command to obtain the Device ID. Device IDs can be found in the raw data at $[*].did.
Input
Input Parameter | Required/Optional | Description | Example |
Device ID | Required | The ID of the device to retrieve tags. Device IDs can be obtained using the List Devices command. | ***** |
Output
To view the sample output data for all commands, refer to this article.
Error Handling
If the Return Data is Failed, an Error tab will appear in the Test Result window.
The error tab contains the details responded from D3 SOAR or third-party API calls, including Failure Indicator, Status Code, and Message. This can help locate the root cause of a command failure.
Parts in Error | Description | Example |
Failure Indicator | Indicates the command failure that happened at a specific input and/or API call. | Get Device Tags failed. |
Status Code | The response code issued by the third-party API server or the D3 SOAR system that can be used to locate the corresponding error category. For example, if the returned status code is 401, the selected connection is unauthorized to run the command. The user or system support would need to check the permission setting in the Darktrace portal. Refer to the HTTP Status Code Registry for details. | Status Code: 404. |
Message | The raw data or captured key error message from the integration API server about the API request failure. | Message: Device ID Not Found. |
Error Sample Data Get Device Tags failed. Status Code: 404. Message: Device ID Not Found. |
Get External Endpoint Details
Returns locations, IP address and device connection information for external IPs and hostnames.
Input
Input Parameter | Required/Optional | Description | Example |
Endpoint Value | Required | The IP address or hostname to return details. Both IPv4 and IPv6 addresses are supported. | google.com |
Output
To view the sample output data for all commands, refer to this article.
Error Handling
If the Return Data is Failed, an Error tab will appear in the Test Result window.
The error tab contains the details responded from D3 SOAR or third-party API calls, including Failure Indicator, Status Code, and Message. This can help locate the root cause of a command failure.
Parts in Error | Description | Example |
Failure Indicator | Indicates the command failure that happened at a specific input and/or API call. | Get External Endpoint Details failed. |
Status Code | The response code issued by the third-party API server or the D3 SOAR system that can be used to locate the corresponding error category. For example, if the returned status code is 401, the selected connection is unauthorized to run the command. The user or system support would need to check the permission setting in the Darktrace portal. Refer to the HTTP Status Code Registry for details. | Status Code: 408. |
Message | The raw data or captured key error message from the integration API server about the API request failure. | Message: Request Timeout. |
Error Sample Data Get External Endpoint Details failed. Status Code: 408. Message: Request Timeout. |
Get Models
Returns information of the specified model UUIDs.
READER NOTE
Model UUIDs is an optional parameter to run this command.
Run the Search Breaches command to obtain the Model UUIDs. Module UUIDs are located at the JSON path $.model.uuid in the returned raw data.
Input
Input Parameter | Required/Optional | Description | Example |
Model UUIDs | Optional | The UUID(s) of the model(s) to return. Model UUIDs can be obtained using the Search Breaches command. If this parameter is not defined, all models will be returned. |
JSON
|
Output
To view the sample output data for all commands, refer to this article.
Error Handling
If the Return Data is Failed, an Error tab will appear in the Test Result window.
The error tab contains the details responded from D3 SOAR or third-party API calls, including Failure Indicator, Status Code, and Message. This can help locate the root cause of a command failure.
Parts in Error | Description | Example |
Failure Indicator | Indicates the command failure that happened at a specific input and/or API call. | Get Models failed. |
Status Code | The response code issued by the third-party API server or the D3 SOAR system that can be used to locate the corresponding error category. For example, if the returned status code is 401, the selected connection is unauthorized to run the command. The user or system support would need to check the permission setting in the Darktrace portal. Refer to the HTTP Status Code Registry for details. | Status Code: 404. |
Message | The raw data or captured key error message from the integration API server about the API request failure. | Message: DATANOTFOUND ERROR. |
Error Sample Data Get Models failed. Status Code: 404. Message: DATA NOT FOUND ERROR. |
Get Status
Returns detailed system health information.
Input
N/A
Output
To view the sample output data for all commands, refer to this article.
Error Handling
If the Return Data is Failed, an Error tab will appear in the Test Result window.
The error tab contains the details responded from D3 SOAR or third-party API calls, including Failure Indicator, Status Code, and Message. This can help locate the root cause of a command failure.
Parts in Error | Description | Example |
Failure Indicator | Indicates the command failure that happened at a specific input and/or API call. | Get Status failed. |
Status Code | The response code issued by the third-party API server or the D3 SOAR system that can be used to locate the corresponding error category. For example, if the returned status code is 401, the selected connection is unauthorized to run the command. The user or system support would need to check the permission setting in the Darktrace portal. Refer to the HTTP Status Code Registry for details. | Status Code: 408. |
Message | The raw data or captured key error message from the integration API server about the API request failure. | Message: Request Timeout |
Error Sample Data Get Status failed. Status Code: 408. Message: Request Timeout |
List Actions
Returns information about current and past Darktrace RESPOND/Network (formerly Antigena Network) actions. It can be used to retrieve a list of currently quarantined devices or Darktrace RESPOND Actions requiring approval.
READER NOTE
Breach ID is a required parameter to run this command.
Run the Search Breaches command to obtain the Breach ID. Breach IDs can be found in the raw data at $[*].pbid.
Input
Input Parameter | Required/Optional | Description | Example |
From | Optional | The start time of actions to return in UTC time. | 2023-01-23 00:00 |
To | Optional | The end time of actions to return in UTC time. | 2023-01-24 00:00 |
Breach ID | Optional | The ID of the model breach to retrieve corresponding connections and events. Breach ID can be obtained using the Search Breaches command. | ***** |
Include Cleared | Optional | The option to return Darktrace RESPOND actions that are already cleared. The default option is False. | True |
Include History | Optional | The option to include additional history information about the action state, such as when it was created or extended. The default option is False. | True |
Need Confirming | Optional | Filters returned Darktrace RESPOND actions by those that need human confirmation or do not need human confirmation. The default option is False. | False |
Output
To view the sample output data for all commands, refer to this article.
Error Handling
If the Return Data is Failed, an Error tab will appear in the Test Result window.
The error tab contains the details responded from D3 SOAR or third-party API calls, including Failure Indicator, Status Code, and Message. This can help locate the root cause of a command failure.
Parts in Error | Description | Example |
Failure Indicator | Indicates the command failure that happened at a specific input and/or API call. | List Actions failed. |
Status Code | The response code issued by the third-party API server or the D3 SOAR system that can be used to locate the corresponding error category. For example, if the returned status code is 401, the selected connection is unauthorized to run the command. The user or system support would need to check the permission setting in the Darktrace portal. Refer to the HTTP Status Code Registry for details. | Status Code: 404. |
Message | The raw data or captured key error message from the integration API server about the API request failure. | Message: Breach ID Not Found. |
Error Sample Data List Actions failed. Status Code: 404. Message: Breach ID Not Found. |
List Devices
Returns a list of devices identified by Darktrace.
READER NOTE
Returned devices are sorted by the dids field in ascending order.
The minimum input value for the Seen Since parameter is 1 second.
The Seen Since parameter accepts only one time unit for each input value. Multiple time units, such as 1 week and 1 min, are not supported.
Valid time units for the Seen Since parameter are:
Second: <number> (seconds serve as the default unit and do not require an explicit label).
Minute: <number> min(s).
Hour: <number> hour(s). The abbreviation hr is not valid.
Day: <number> day(s).
Week: <number> week(s).
Input
Input Parameter | Required/Optional | Description | Example |
Seen Since | Optional | Filters returned devices by last seen activity time. The valid input can be the number of seconds before the current time, or a number with a time unit modifier such as day or week. If this parameter is not defined, all devices will be returned. | 10min |
Output
To view the sample output data for all commands, refer to this article.
Error Handling
If the Return Data is Failed, an Error tab will appear in the Test Result window.
The error tab contains the details responded from D3 SOAR or third-party API calls, including Failure Indicator, Status Code, and Message. This can help locate the root cause of a command failure.
Parts in Error | Description | Example |
Failure Indicator | Indicates the command failure that happened at a specific input and/or API call. | List Devices failed. |
Status Code | The response code issued by the third-party API server or the D3 SOAR system that can be used to locate the corresponding error category. For example, if the returned status code is 401, the selected connection is unauthorized to run the command. The user or system support would need to check the permission setting in the Darktrace portal. Refer to the HTTP Status Code Registry for details. | Status Code: 400. |
Message | The raw data or captured key error message from the integration API server about the API request failure. | Message: API SIGNATURE ERROR. |
Error Sample Data List Devices failed. Status Code: 400. Message: API SIGNATURE ERROR. |
List Metrics
Returns the list of metrics available for filtering other API calls and for use in model making.
Input
N/A
Output
To view the sample output data for all commands, refer to this article.
Error Handling
If the Return Data is Failed, an Error tab will appear in the Test Result window.
The error tab contains the details responded from D3 SOAR or third-party API calls, including Failure Indicator, Status Code, and Message. This can help locate the root cause of a command failure.
Parts in Error | Description | Example |
Failure Indicator | Indicates the command failure that happened at a specific input and/or API call. | List Metrics failed. |
Status Code | The response code issued by the third-party API server or the D3 SOAR system that can be used to locate the corresponding error category. For example, if the returned status code is 401, the selected connection is unauthorized to run the command. The user or system support would need to check the permission setting in the Darktrace portal. Refer to the HTTP Status Code Registry for details. | Status Code: 403. |
Message | The raw data or captured key error message from the integration API server about the API request failure. | Message: API SIGNATURE ERROR. |
Error Sample Data List Metrics failed. Status Code: 400. Message: API SIGNATURE ERROR. |
Get Model Components
Returns information for the specified components.
READER NOTE
Component CIDs is an optional parameter to run this command.
Run the Search Breaches command to obtain the Component CIDs. Component CIDs will be returned in the returned raw data under the cid key.
It is recommended to input the most recent component CIDs.
Without any input parameters defined, all model components are returned. This may cause longer than expected command execution.
Input
Input Parameter | Required/Optional | Description | Example |
Component CIDs | Optional | The ID(s) of the component(s) to return. Component CIDs can be obtained using the Search Breaches command. If this parameter is not defined, all components will be returned. |
JSON
|
Output
To view the sample output data for all commands, refer to this article.
Error Handling
If the Return Data is Failed, an Error tab will appear in the Test Result window.
The error tab contains the details responded from D3 SOAR or third-party API calls, including Failure Indicator, Status Code, and Message. This can help locate the root cause of a command failure.
Parts in Error | Description | Example |
Failure Indicator | Indicates the command failure that happened at a specific input and/or API call. | Get Model Components failed. |
Status Code | The response code issued by the third-party API server or the D3 SOAR system that can be used to locate the corresponding error category. For example, if the returned status code is 401, the selected connection is unauthorized to run the command. The user or system support would need to check the permission setting in the Darktrace portal. Refer to the HTTP Status Code Registry for details. | Status Code: 404. |
Message | The raw data or captured key error message from the integration API server about the API request failure. | Message: DATANOTFOUND ERROR. |
Error Sample Data Get Model Components failed. Status Code: 404. Message: DATA NOT FOUND ERROR. |
List PCAPs
Returns a list of PCAPs and their status.
READER NOTE
Once the Create PCAP command returns a PCAP status with state:"finished", the PCAP can be retrieved with this command.
Input
N/A
Output
To view the sample output data for all commands, refer to this article.
Error Handling
If the Return Data is Failed, an Error tab will appear in the Test Result window.
The error tab contains the details responded from D3 SOAR or third-party API calls, including Failure Indicator, Status Code, and Message. This can help locate the root cause of a command failure.
Parts in Error | Description | Example |
Failure Indicator | Indicates the command failure that happened at a specific input and/or API call. | List PCAPs failed. |
Status Code | The response code issued by the third-party API server or the D3 SOAR system that can be used to locate the corresponding error category. For example, if the returned status code is 401, the selected connection is unauthorized to run the command. The user or system support would need to check the permission setting in the Darktrace portal. Refer to the HTTP Status Code Registry for details. | Status Code: 400. |
Message | The raw data or captured key error message from the integration API server about the API request failure. | Message: API SIGNATURE ERROR. |
Error Sample Data List PCAPs failed. Status Code: 400. Message: API SIGNATURE ERROR. |
List Similar Devices
Returns a list of devices similar to the specified device on the network.
READER NOTE
Device ID is a required parameter to run this command.
Run the List Devices command to obtain the Device ID. Device IDs can be found in the raw data at $[*].did.
Input
Input Parameter | Required/Optional | Description | Example |
Device ID | Required | The ID of the device to list similar devices. Device IDs can be obtained using the List Devices command. | ***** |
Output
To view the sample output data for all commands, refer to this article.
Error Handling
If the Return Data is Failed, an Error tab will appear in the Test Result window.
The error tab contains the details responded from D3 SOAR or third-party API calls, including Failure Indicator, Status Code, and Message. This can help locate the root cause of a command failure.
Parts in Error | Description | Example |
Failure Indicator | Indicates the command failure that happened at a specific input and/or API call. | List Similar Metrics failed. |
Status Code | The response code issued by the third-party API server or the D3 SOAR system that can be used to locate the corresponding error category. For example, if the returned status code is 401, the selected connection is unauthorized to run the command. The user or system support would need to check the permission setting in the Darktrace portal. Refer to the HTTP Status Code Registry for details. | Status Code: 400. |
Message | The raw data or captured key error message from the integration API server about the API request failure. | Message: API DATE ERROR |
Error Sample Data List Similar Metrics failed. Status Code: 400. Message: API DATE ERROR |
List Subnets
Retrieves subnets with activity in the specified time period processed by Darktrace.
READER NOTE
Returned subnets are sorted by the mlid field in ascending order.
The Seen Since parameter accepts only one time unit for each input value. Multiple time units, such as 1 week and 1 min, are not supported.
Valid time units for the Seen Since parameter are:
Second: <number> (seconds serve as the default unit and do not require an explicit label).
Minute: <number> min(s).
Hour: <number> hour(s). The abbreviation hr is not valid.
Day: <number> day(s).
Week: <number> week(s).
Month: <number>months. The maximum value is 6 months.
Input
Input Parameter | Required/Optional | Description | Example |
Seen Since | Optional | Filters returned subnets by last seen activity time. The valid input can be the number of seconds before the current time, or a number with a time unit modifier such as day or week (e.g. 2hour or 1day). Note: The minimum input value is 1second, and the maximum is 6months. | 5min |
Output
To view the sample output data for all commands, refer to this article.
Error Handling
If the Return Data is Failed, an Error tab will appear in the Test Result window.
The error tab contains the details responded from D3 SOAR or third-party API calls, including Failure Indicator, Status Code, and Message. This can help locate the root cause of a command failure.
Parts in Error | Description | Example |
Failure Indicator | Indicates the command failure that happened at a specific input and/or API call. | List Subnets failed. |
Status Code | The response code issued by the third-party API server or the D3 SOAR system that can be used to locate the corresponding error category. For example, if the returned status code is 401, the selected connection is unauthorized to run the command. The user or system support would need to check the permission setting in the Darktrace portal. Refer to the HTTP Status Code Registry for details. | Status Code: 400 |
Message | The raw data or captured key error message from the integration API server about the API request failure. | Message: API SIGNATURE ERROR. |
Error Sample Data List Subnets failed. Status Code: 400 Message: API SIGNATURE ERROR. |
List Tags
Returns the details for all current tags.
Input
Input Parameter | Required/Optional | Description | Example |
Tag Names | Optional | The name(s) of the tag(s) to retrieve. Tag Names are case insensitive. |
JSON
|
Output
To view the sample output data for all commands, refer to this article.
Error Handling
If the Return Data is Failed, an Error tab will appear in the Test Result window.
The error tab contains the details responded from D3 SOAR or third-party API calls, including Failure Indicator, Status Code, and Message. This can help locate the root cause of a command failure.
Parts in Error | Description | Example |
Failure Indicator | Indicates the command failure that happened at a specific input and/or API call. | List Tags failed. |
Status Code | The response code issued by the third-party API server or the D3 SOAR system that can be used to locate the corresponding error category. For example, if the returned status code is 401, the selected connection is unauthorized to run the command. The user or system support would need to check the permission setting in the Darktrace portal. Refer to the HTTP Status Code Registry for details. | Status Code: 404. |
Message | The raw data or captured key error message from the integration API server about the API request failure. | Message: Tag Name not found. |
Error Sample Data List Tags failed. Status Code: 404. Message: Tag name Not Found. |
Search Breaches
Returns a time-sorted list of model breaches, filtered by the specified parameters.
READER NOTE
Device ID is an optional parameter to run this command.
Run the List Devices command to obtain the Device ID. Device IDs can be found in the raw data at $[*].did.
Without any input parameters defined, up to 100 non-acknowledged breaches are returned.
If only the Start Time and End Time parameters are defined, all non-acknowledged breaches within the time range are returned.
Input
Input Parameter | Required/Optional | Description | Example |
Start Time | Optional | The start time of the time range to search breaches in UTC time. | 2023-01-26 00:00 |
End Time | Optional | The end time of the time range to search breaches in UTC time. | 2023-01-27 00:00 |
Minimum Score | Optional | The minimum score to filter searched breaches. | 0.5 |
Device ID | Optional | The ID of the device modeled in Darktrace to search breaches. Device IDs can be obtained using the List Devices command. | ***** |
Include Acknowledged | Optional | The option to return acknowledged breaches in the search. If this parameter is not defined, the returned data will exclude acknowledged breaches. | True |
Count | Optional | The number of breaches to return. Note: If this parameter is not defined, but the Start Time and End time parameters are, all items between the specified time range will be returned. If all three parameters are not defined, the default value of 100 for this parameter will be used. | 3 |
Output
To view the sample output data for all commands, refer to this article.
Error Handling
If the Return Data is Failed, an Error tab will appear in the Test Result window.
The error tab contains the details responded from D3 SOAR or third-party API calls, including Failure Indicator, Status Code, and Message. This can help locate the root cause of a command failure.
Parts in Error | Description | Example |
Failure Indicator | Indicates the command failure that happened at a specific input and/or API call. | Search Breaches failed. |
Status Code | The response code issued by the third-party API server or the D3 SOAR system that can be used to locate the corresponding error category. For example, if the returned status code is 401, the selected connection is unauthorized to run the command. The user or system support would need to check the permission setting in the Darktrace portal. Refer to the HTTP Status Code Registry for details. | Status Code: 400. |
Message | The raw data or captured key error message from the integration API server about the API request failure. | Message: API SIGNATURE ERROR. |
Error Sample Data Search Breaches failed. Status Code: 400. Message: API SIGNATURE ERROR. |
Tag Devices
Adds tag(s) to the specified device(s).
READER NOTE
Device ID and Tags are required parameters to run this command.
Run the List Devices command to obtain the Device IDs. Device IDs can be found in the raw data at $[*].did.
Run the List Tags command to obtain the Tags. Tags referring to the Tag Names, which can be found in the returned raw data at the path $.name.
Input
Input Parameter | Required/Optional | Description | Example |
Device IDs | Required | The IDs of the devices modeled in the Darktrace system to add tags to. Device IDs can be obtained using the List Devices command. |
JSON
|
Tags | Required | The existing tag name(s) to add to the devices. You can obtain existing tag names using the List Tags command. |
JSON
|
Duration | Optional | How long the tag should be set for the device in seconds. The tag will be removed once this duration has expired. | 3600 |
Output
To view the sample output data for all commands, refer to this article.
Error Handling
If the Return Data is Partially Successful or Failed, an Error tab will appear in the Test Result window.
The error tab contains the details responded from D3 SOAR or third-party API calls, including Failure Indicator, Status Code, and Message. This can help locate the root cause of a command failure.
Parts in Error | Description | Example |
Failure Indicator | Indicates the command failure that happened at a specific input and/or API call. | List Tags failed. |
Status Code | The response code issued by the third-party API server or the D3 SOAR system that can be used to locate the corresponding error category. For example, if the returned status code is 401, the selected connection is unauthorized to run the command. The user or system support would need to check the permission setting in the Darktrace portal. Refer to the HTTP Status Code Registry for details. | Status Code: 404. |
Message | The raw data or captured key error message from the integration API server about the API request failure. | Message: Device IDs Not Found. |
Error Sample Data List Tags failed. Status Code: 404. Message: Device IDs Not Found. |
Unacknowledge
Unacknowledges the specified model breaches.
READER NOTE
Breach IDs is a required parameter to run this command.
Run the Search Breaches command to obtain the Breach IDs. Breach IDs can be found in the raw data at $[*].pbid.
The Fetch Event response exposes breach-acknowledgment status at the JSON path $.[*].acknowledge. A value of false indicates unacknowledged breaches. The associated breach IDs appear under the pbid key.
Input
Input Parameter | Required/Optional | Description | Example |
Breach IDs | Required | The ID(s) of the model breach(es) to unacknowledge. Breach IDs can be obtained using the Search Breaches command. |
JSON
|
Output
To view the sample output data for all commands, refer to this article.
Error Handling
If the Return Data is Partially Successful or Failed, an Error tab will appear in the Test Result window.
The error tab contains the details responded from D3 SOAR or third-party API calls, including Failure Indicator, Status Code, and Message. This can help locate the root cause of a command failure.
Parts in Error | Description | Example |
Failure Indicator | Indicates the command failure that happened at a specific input and/or API call. | Unacknowledge failed. |
Status Code | The response code issued by the third-party API server or the D3 SOAR system that can be used to locate the corresponding error category. For example, if the returned status code is 401, the selected connection is unauthorized to run the command. The user or system support would need to check the permission setting in the Darktrace portal. Refer to the HTTP Status Code Registry for details. | Status Code: 400. |
Message | The raw data or captured key error message from the integration API server about the API request failure. | Message: API DATE ERROR |
Error Sample Data Unacknowledge failed. Status Code: 400. Message: API DATE ERROR |
Test Connection
Allows users to perform a health check on an integration connection. Users can schedule a periodic health check by selecting Connection Health Check when editing an integration connection.
Input
N/A
Output
Output Type | Description | Return Data Type |
Return Data | Indicates one of the possible command execution states: Successful or Failed. The Failed state can be triggered by any of the following errors:
More details about an error can be viewed in the Error tab. | String |
Error Handling
If the Return Data is failed, an Error tab will appear in the Test Result window.
The error tab contains the responses from the third-party API calls including Failure Indicator, Status Code, and Message. This can help locate the root cause of a command failure.
Parts in Error | Description | Example |
Failure Indicator | Indicates the command failure that happened at a specific input and/or API call. | Test Connection failed. Failed to check the connector. |
Status Code | The response code issued by the third-party API server or the D3 SOAR system that can be used to locate the corresponding error category. For example, if the returned status code is 401, the selected connection is unauthorized to run the command. The user or system support would need to check the permission setting in the Darktrace portal. Refer to the HTTP Status Code Registry for details. | Status Code: 400. |
Message | The raw data or captured key error message from the integration API server about the API request failure. | Message: API SIGNATURE ERROR. |
Error Sample Data Test Connection failed. Failed to check the connector. Status Code: 400. Message: API SIGNATURE ERROR. |