
Barracuda Web Application Firewall
LAST UPDATED: SEPTEMBER 16, 2025
Overview
Barracuda Web Application Firewall protects applications, APIs, and mobile app backends against a variety of attacks including the OWASP Top 10, zero-day threats, data leakage, and application-layer denial of service (DoS) attacks. By combining signature-based policies and positive security with robust anomaly-detection capabilities, Barracuda Web Application Firewall can defeat today’s most sophisticated attacks targeting web applications.
Barracuda Web Application Firewall is available for use in:
D3 SOAR | V16.8+ |
Category | Network Security |
Deployment Options |
Connection
To connect to Barracuda Web Application Firewall from D3 SOAR, follow this part to collect the required information below:
Parameter | Description | Example |
Server URL | The server URL of your Barracuda Web Application Firewall instance. | https://*****:8443 |
User Name | The user name to generate the access token. | jdoe |
Password | The password to generate the access token. | ***** |
API Version | The API version to use for the connection. | v3.2 |
Configuring D3 SOAR to Work with Barracuda Web Application Firewall
Log in to D3 SOAR.
Find the Barracuda Web Application Firewall integration.
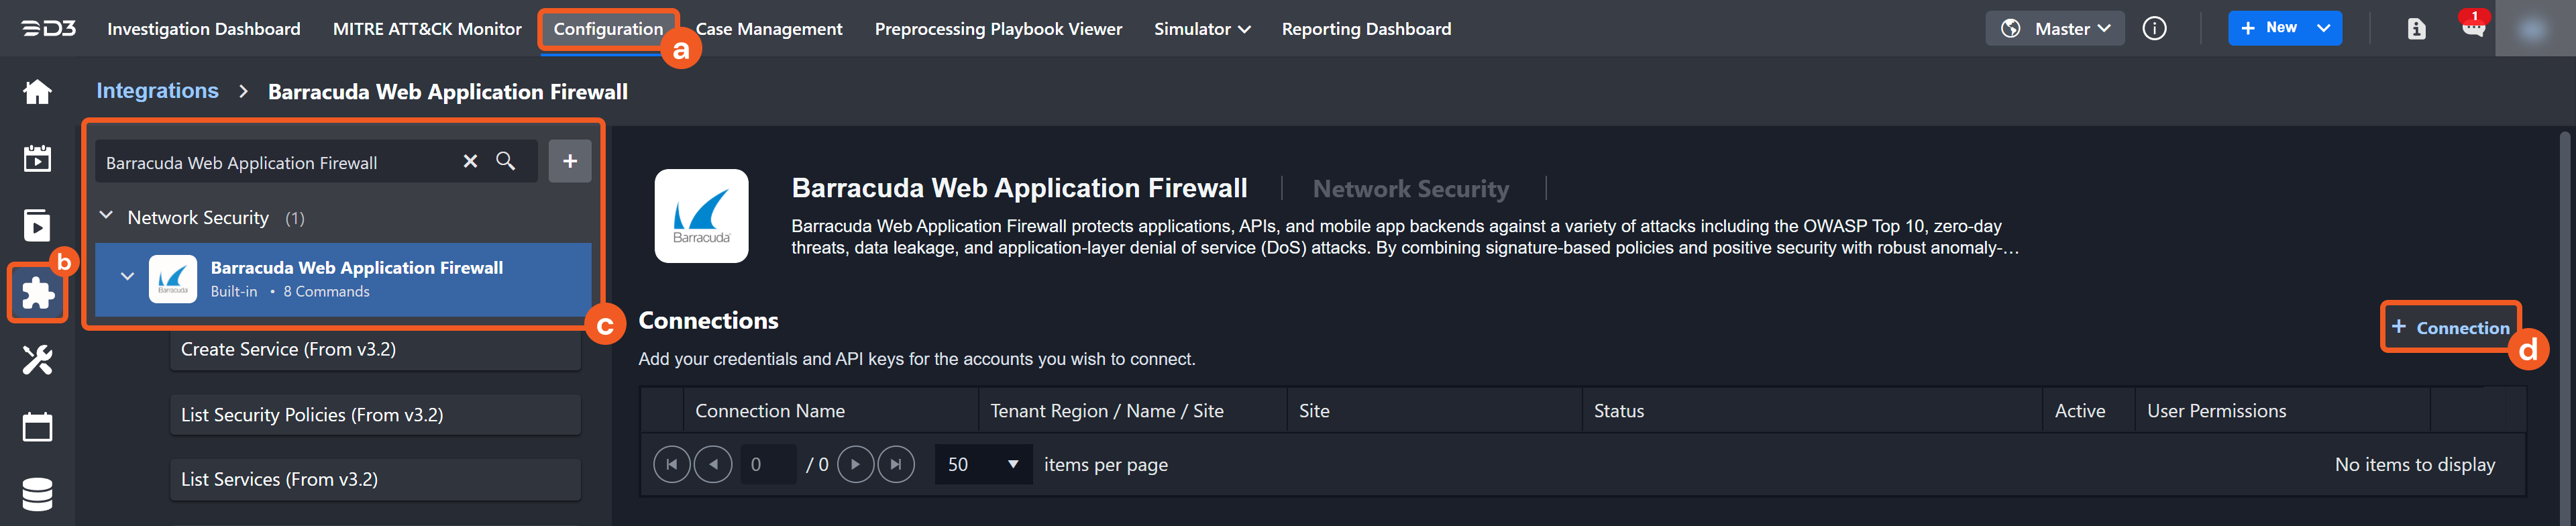
Navigate to Configuration on the top header menu.
Click on the Integration icon on the left sidebar.
Type Barracuda Web Application Firewall in the search box to find the integration, then click it to select it.
Click New Connection, on the right side of the Connections section. A new connection window will appear.
Configure the following fields to create a connection to Barracuda Web Application Firewall.
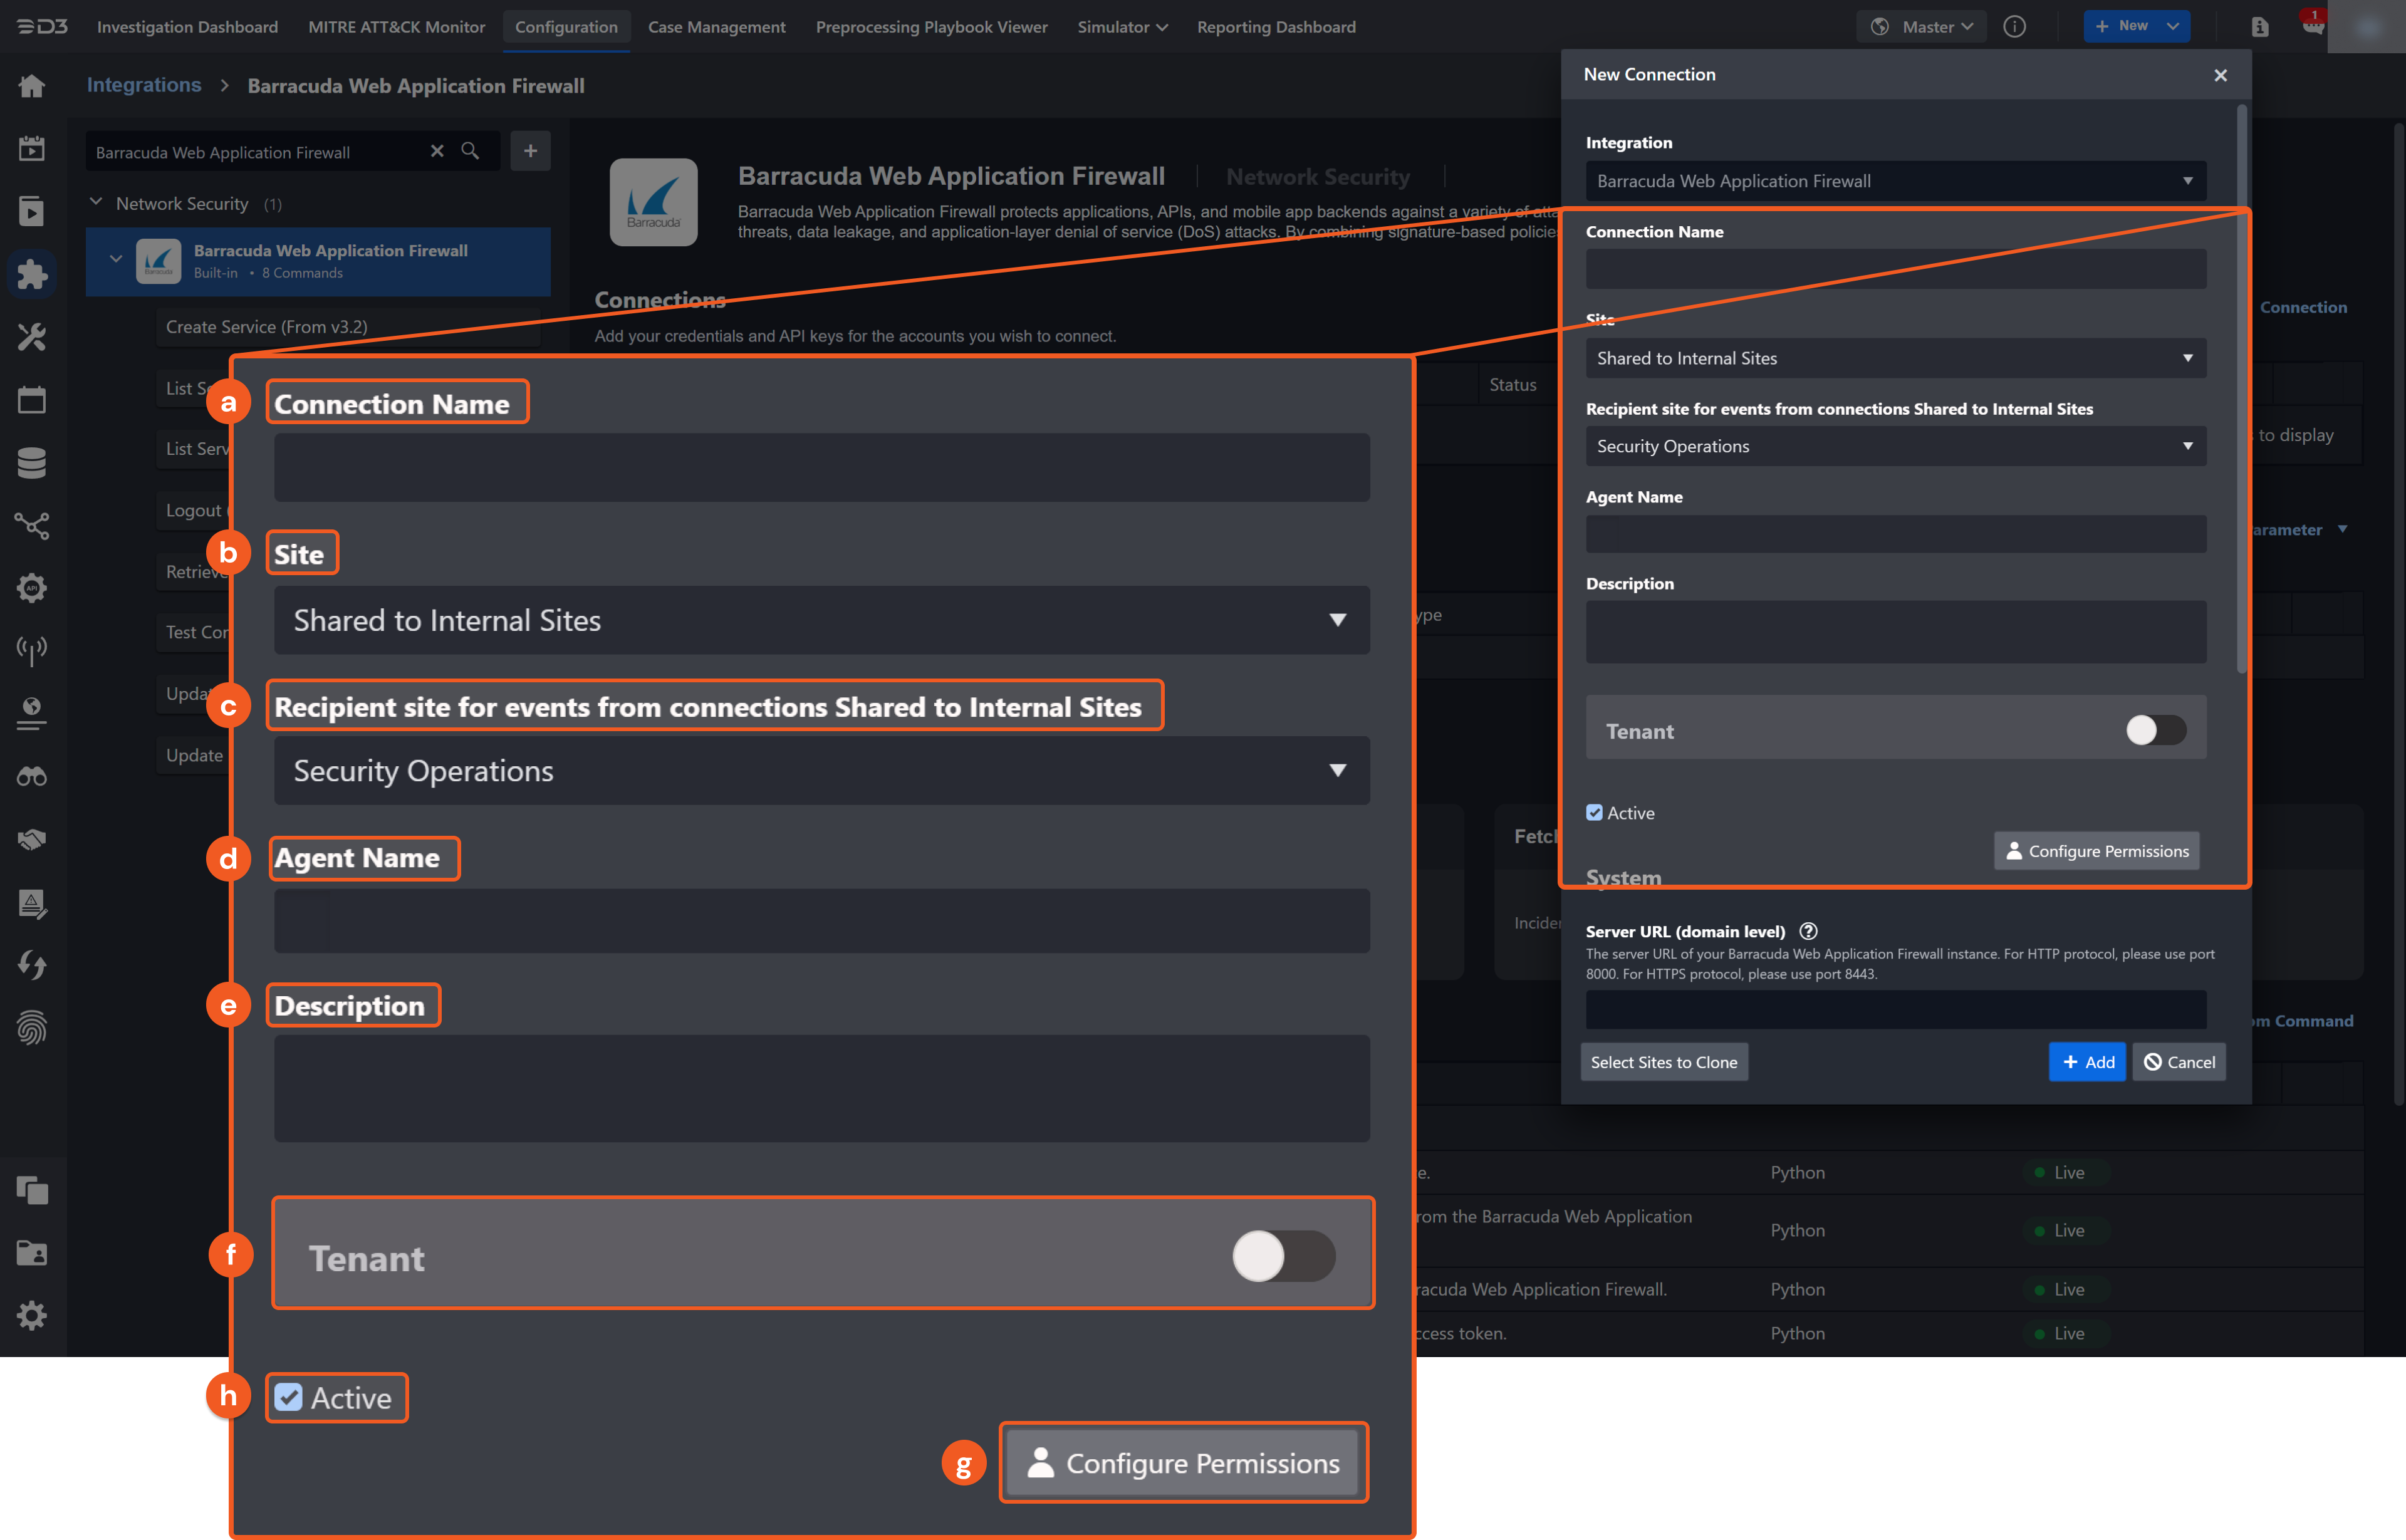
Connection Name: The desired name for the connection.
Site: The site on which to use the integration connection. Use the drop-down menu to select the site. The Share to Internal Sites option enables all internal sites to use the connection. Selecting a specific site will only enable that site to use the connection.
Recipient site for events from connections Shared to Internal Sites: This field is displayed when Share to Internal Sites is selected for the Site field, allowing selection of the internal site for deploying the integration connection.
Agent Name (Optional): The proxy agent required to build the connection. Use the dropdown menu to select the proxy agent from a list of previously configured proxy agents.
Description (Optional): The description for the connection.
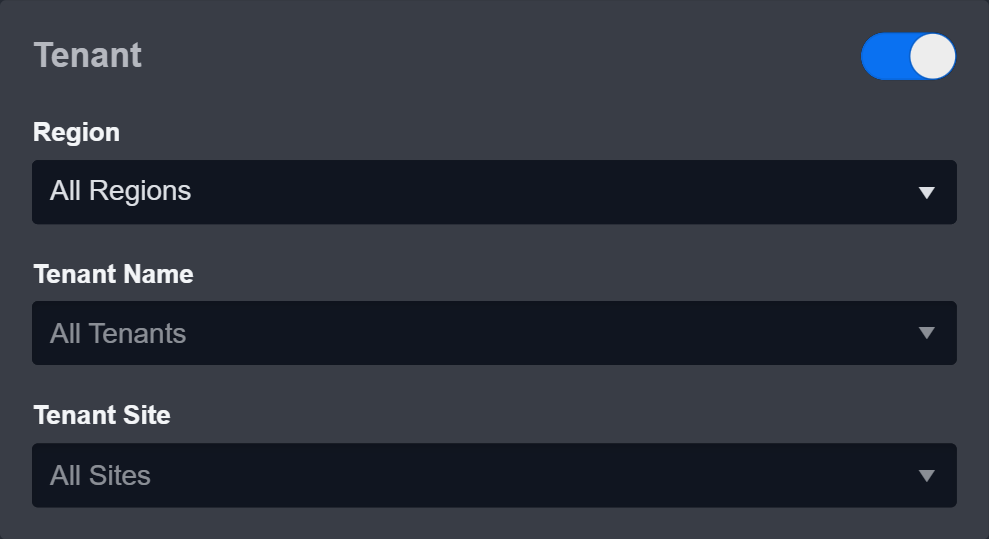
Tenant (Optional): When configuring the connection from a master tenant site, users can choose the specific tenant sites with which to share the connection. Once this setting is enabled, users can filter and select the desired tenant sites from the dropdowns to share the connection.
Configure User Permissions: Defines which users have access to the connection.
Active: The checkbox that enables the connection to be used when selected.
System: This section contains the parameters defined specifically for the integration. These parameters must be configured to create the integration connection.
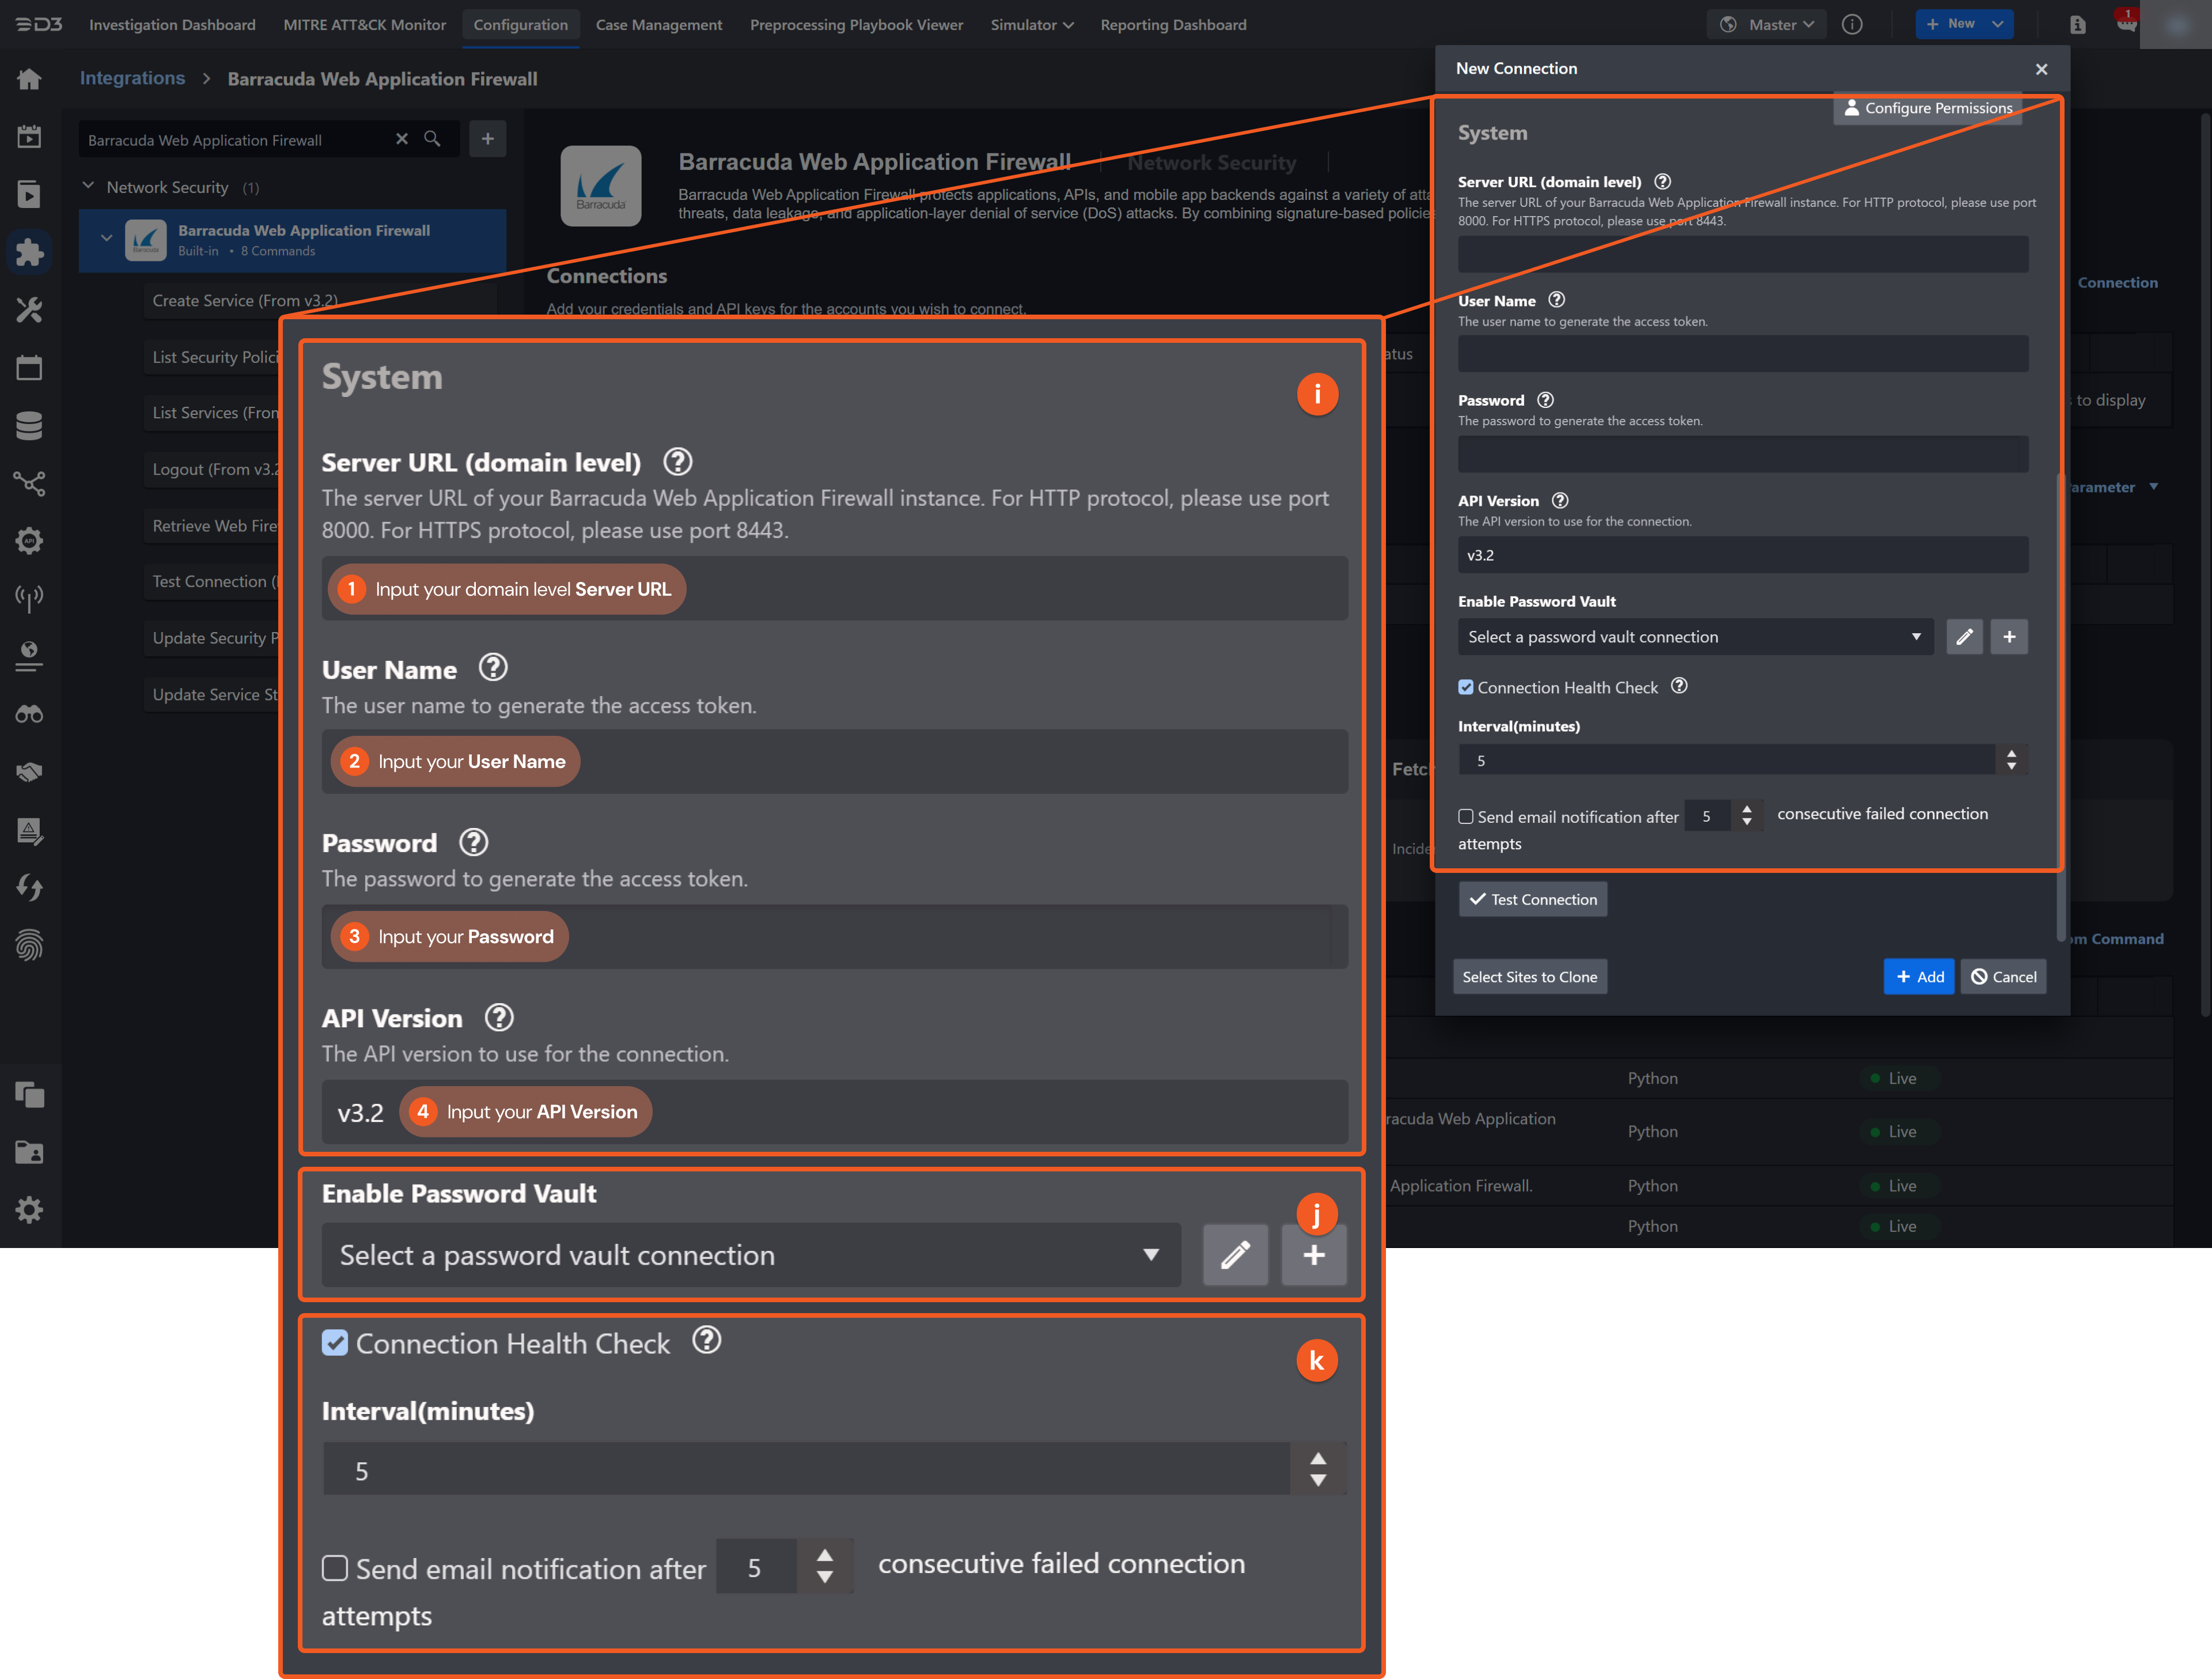
1. Input the Server URL.
2. Input the User Name.
3. Input the Password.4. Input the API Version. The default value is v3.2.
Enable Password Vault: An optional feature that allows users to take the stored credentials from their own password vault. Refer to the password vault connection guide if needed.
Connection Health Check: Periodically checks the connection status by scheduling the Test Connection command at the specified interval (in minutes). Available only for active connections, this feature also allows configuring email notifications for failed attempts.
Test the connection.
Click on the Test Connection button to verify credentials and connectivity. A success alert displays Passed with a green checkmark. If the connection fails, review the parameters and retry.
Click OK to close the alert window.
Click Add to create and add the configured connection.
Commands
Barracuda Web Application Firewall includes the following executable commands for users to set up schedules or create playbook workflows. With the Test Command, users can execute these commands independently for playbook troubleshooting.
Integration API Note
For more information about the Barracuda Web Application Firewall API, refer to the Barracuda Web Application Firewall API reference.
Note for Time-related parameters
The input format of time-related parameters may vary based on user account settings, which may cause the sample data in commands to differ from what is displayed. To adjust the time format, follow these steps:
Navigate to Configuration > Application Settings. Select Date/Time Format.
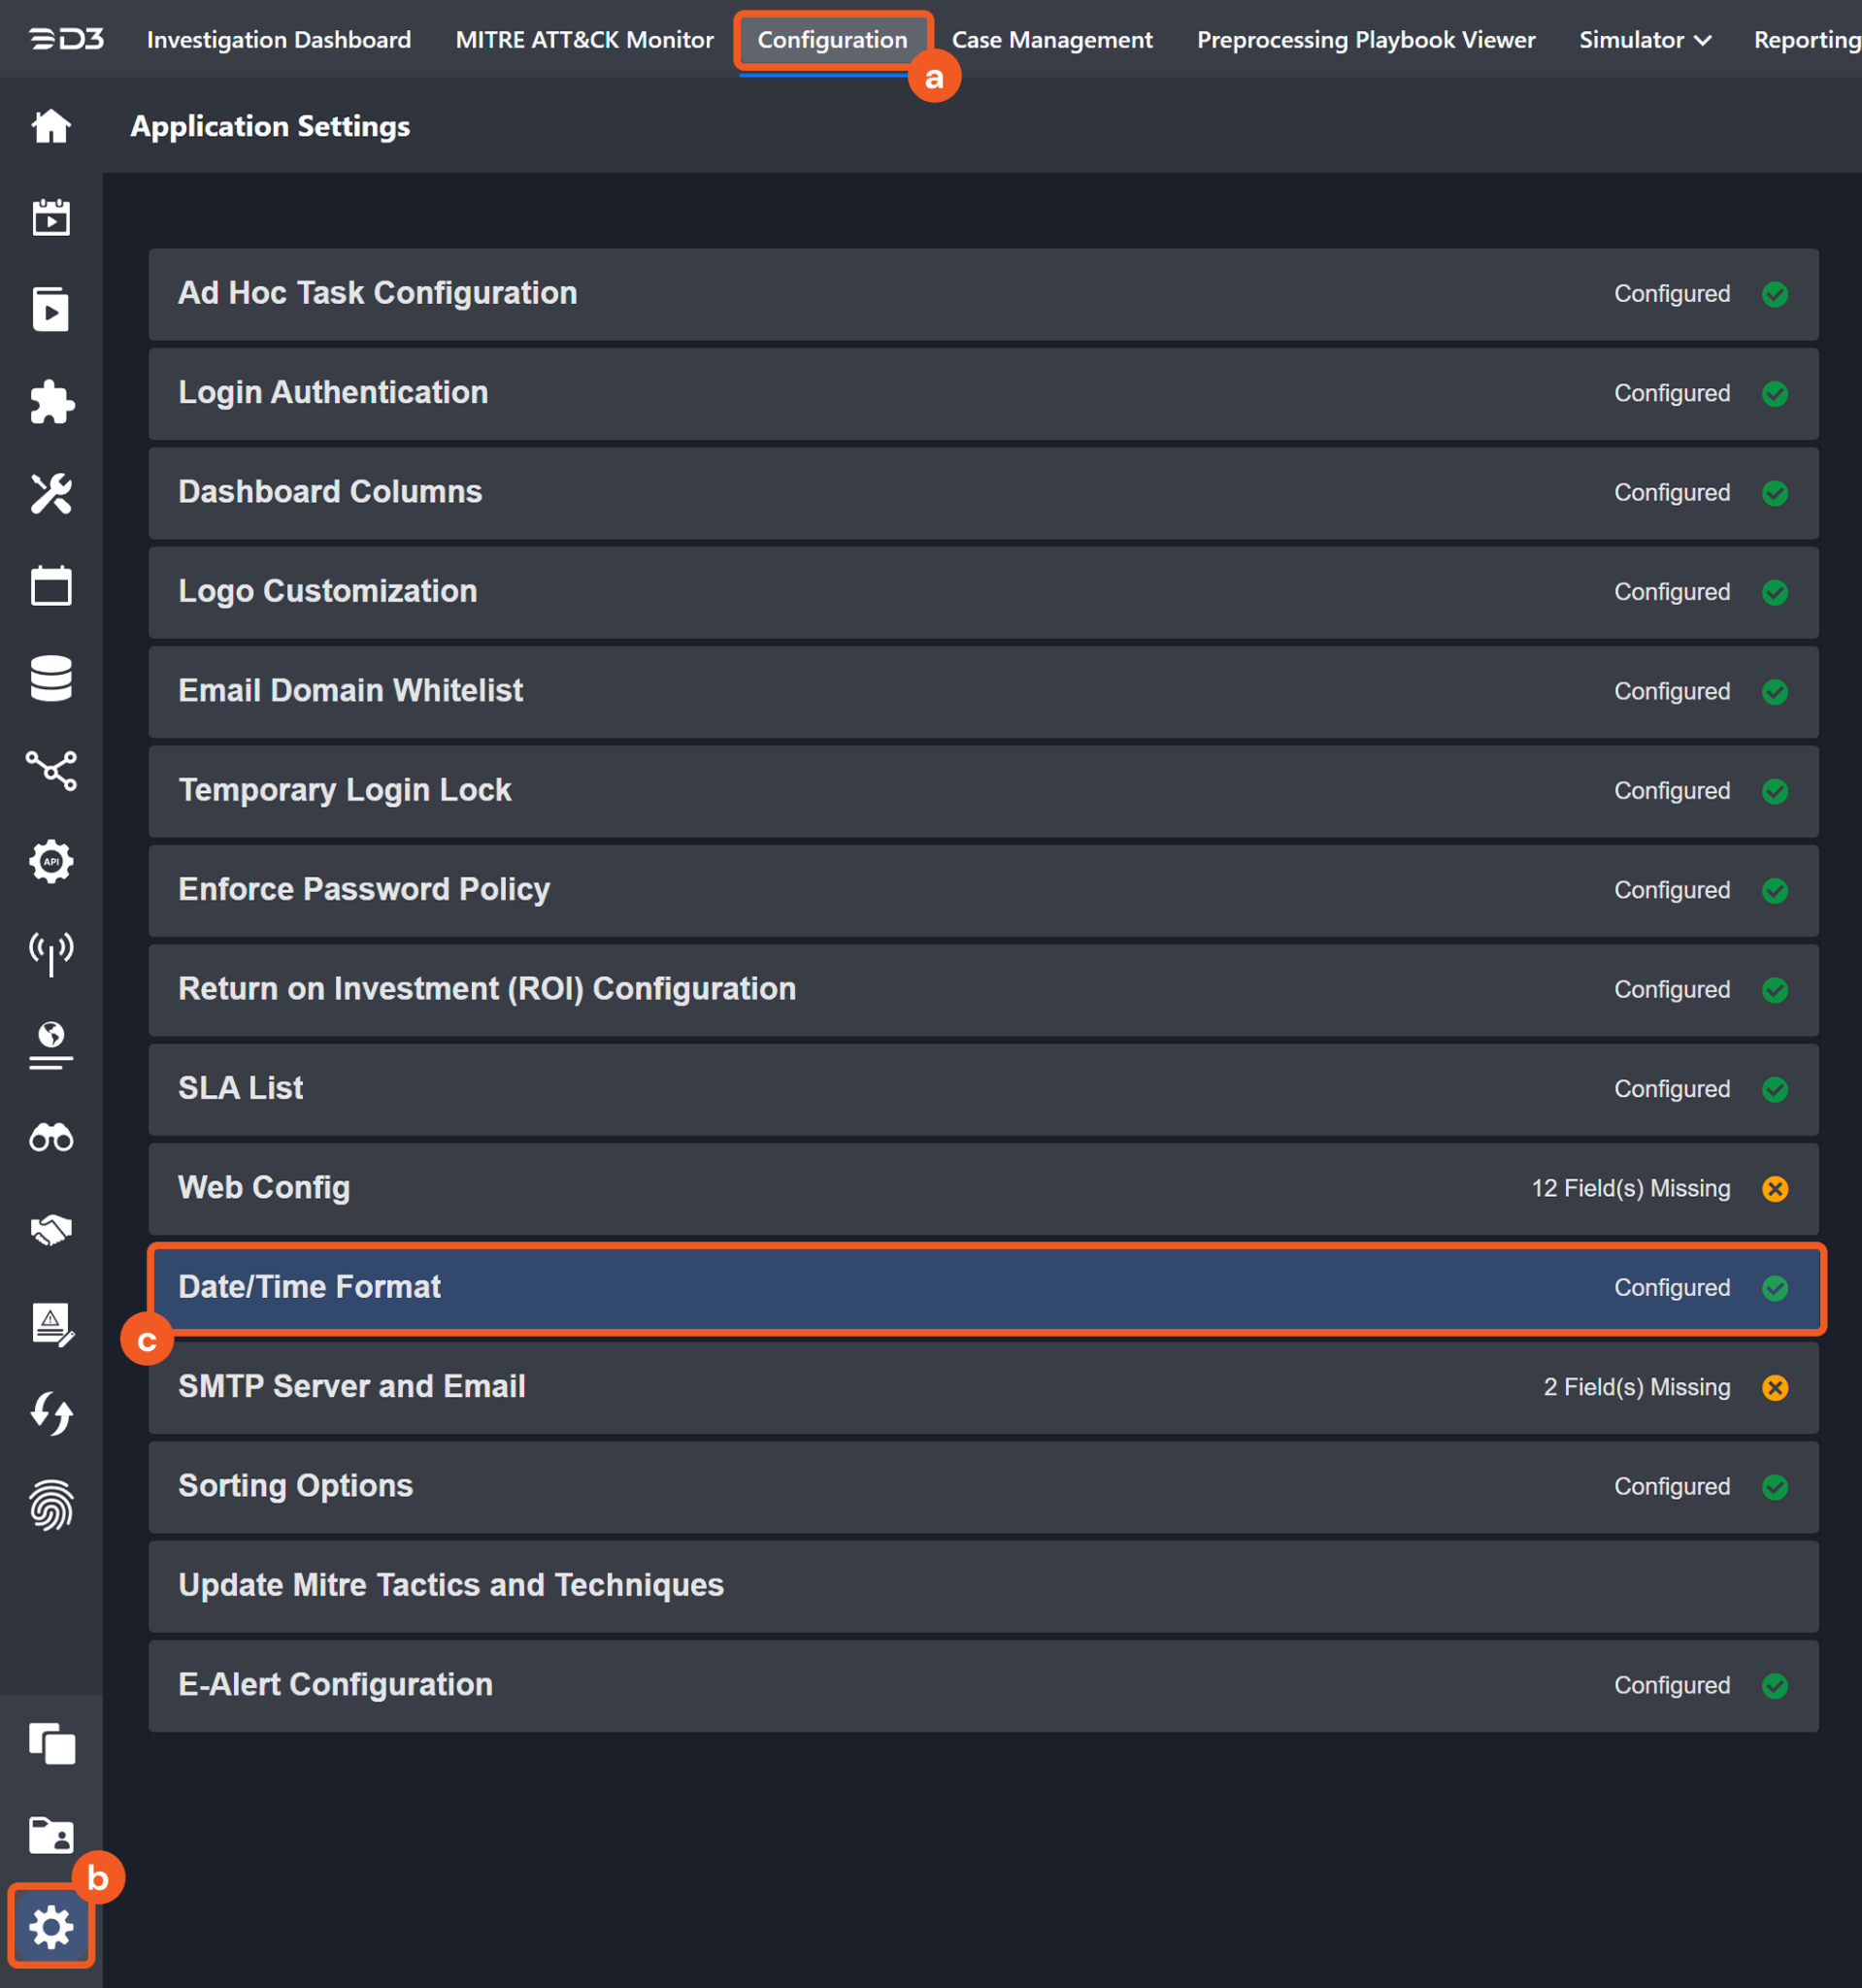
Choose the desired date and time format, then click on the Save button.
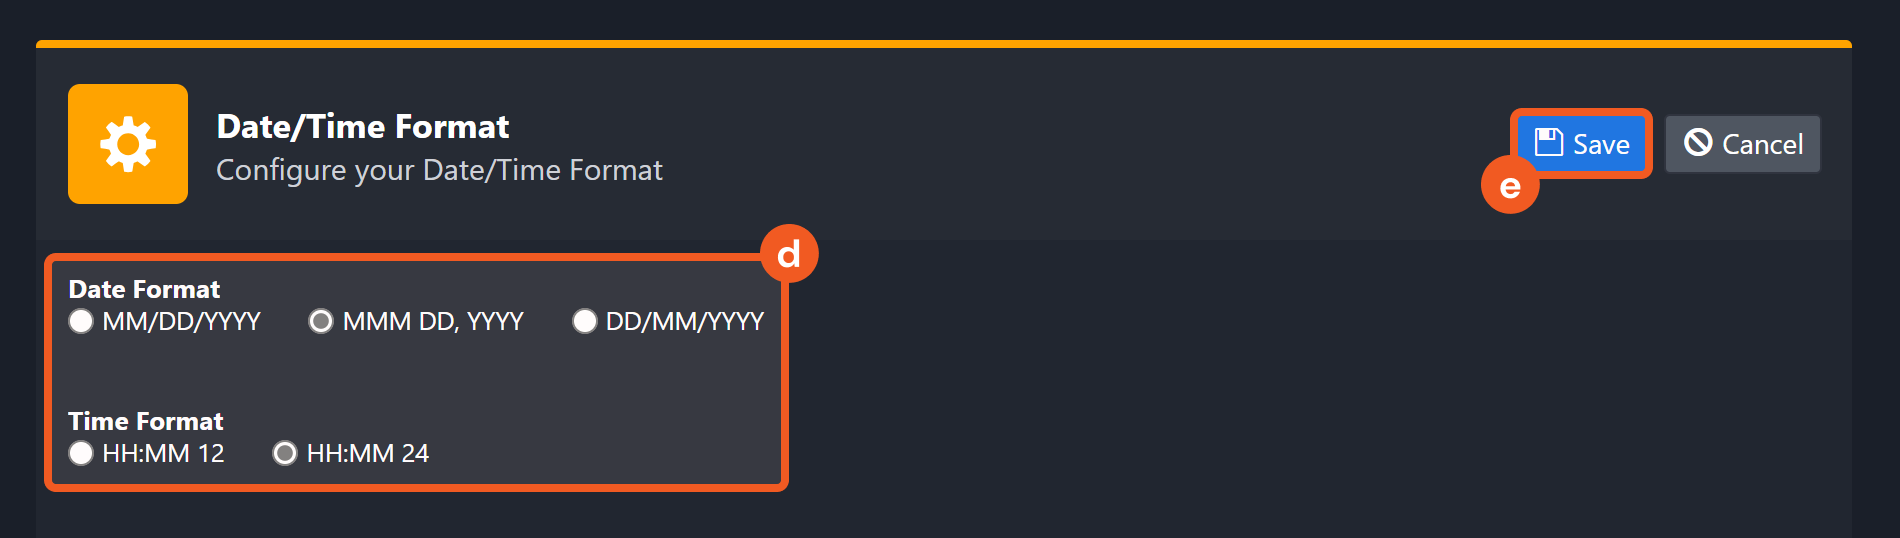
The selected time format will now be visible when configuring Date/Time command input parameters.
Create Service
Creates a new virtual service.
Input
Input Parameter | Required/Optional | Description | Example |
Service Name | Required | The name of the web application service. The maximum length of the Service Name is 64 characters. | service_app1_secure |
Address Version | Optional | The IP address version, IPv4 or IPv6. | IPv4 |
App ID | Optional | The Service App ID. The maximum length of the Service App ID is 63 characters. | ***** |
Certificate | Optional | The ID of the certificate. | ***** |
Comments | Optional | A comment on the service. | This is a demo service |
IP Address | Optional | The IP address of the service. | ***.***.***.*** |
Mask | Optional | The subnet mask for the service. | ***.***.***.*** |
ECDSA Certificate | Optional | The ID of the ECDSA (Elliptic Curve Digital Signature Algorithm) certificate. | ***** |
Service Group | Optional | The name of the service group. The maximum length of service group name is 64 characters. | serviceGroup1 |
Port Number | Optional | The port number, between 1 and 65535. | 443 |
Secure Site Domain | Optional | The secure site domains. |
JSON
|
Session Timeout | Optional | The session timeout in seconds, between 0 and 86400. By default, the value is 0. | 3600 |
Status | Optional | The service status. Available options are:
| On |
Type | Optional | The service type. Available options are:
| HTTPS |
Vsite | Optional | The name of the Vsite on which to create the service. | Default |
Output
To view the sample output data for all commands, refer to this article.
Error Handling
If the Return Data displays Failed, an Error tab will appear in the Test Result window.
The error tab contains the details responded from D3 SOAR or third-party API calls, including Failure Indicator, Status Code, and Message. This can help locate the root cause of a command failure.
Parts in Error | Description | Example |
Failure Indicator | Indicates the command failure that happened at a specific input and/or API call. | Create Service failed. |
Status Code | The response code issued by the third-party API server or the D3 SOAR system that can be used to locate the corresponding error category. For example, if the returned status code is 401, the selected connection is unauthorized to run the command. The user or system support would need to check the permission setting in the Barracuda Web Application Firewall portal. Refer to the HTTP Status Code Registry for details. | Status Code: 400. |
Message | The raw data or captured key error message from the integration API server about the API request failure. | Message: Bad request. |
Error Sample Data Create Service failed. Status Code: 400. Message: Bad request. |
List Security Policies
Retrieves security policies from the Barracuda Web Application Firewall.
Input
Input Parameter | Required/Optional | Description | Example |
Groups | Optional | Filters security policies by groups. By default, the security policies of all groups will be returned. |
JSON
|
Output
To view the sample output data for all commands, refer to this article.
Error Handling
If the Return Data displays Failed, an Error tab will appear in the Test Result window.
The error tab contains the details responded from D3 SOAR or third-party API calls, including Failure Indicator, Status Code, and Message. This can help locate the root cause of a command failure.
Parts in Error | Description | Example |
Failure Indicator | Indicates the command failure that happened at a specific input and/or API call. | List Security Policies failed. |
Status Code | The response code issued by the third-party API server or the D3 SOAR system that can be used to locate the corresponding error category. For example, if the returned status code is 401, the selected connection is unauthorized to run the command. The user or system support would need to check the permission setting in the Barracuda Web Application Firewall portal. Refer to the HTTP Status Code Registry for details. | Status Code: 400. |
Message | The raw data or captured key error message from the integration API server about the API request failure. | Message: Bad request. |
Error Sample Data List Security Policies failed. Status Code: 400. Message: Bad request. |
List Services
Retrieves services from Barracuda Web Application Firewall.
Input
Input Parameter | Required/Optional | Description | Example |
Group | Optional | Filters services by service groups. Available values are:
By default, all service groups will be returned. |
JSON
|
Output
To view the sample output data for all commands, refer to this article.
Error Handling
If the Return Data displays Failed, an Error tab will appear in the Test Result window.
The error tab contains the details responded from D3 SOAR or third-party API calls, including Failure Indicator, Status Code, and Message. This can help locate the root cause of a command failure.
Parts in Error | Description | Example |
Failure Indicator | Indicates the command failure that happened at a specific input and/or API call. | List Services failed. |
Status Code | The response code issued by the third-party API server or the D3 SOAR system that can be used to locate the corresponding error category. For example, if the returned status code is 401, the selected connection is unauthorized to run the command. The user or system support would need to check the permission setting in the Barracuda Web Application Firewall portal. Refer to the HTTP Status Code Registry for details. | Status Code: 400. |
Message | The raw data or captured key error message from the integration API server about the API request failure. | Message: Bad request. |
Error Sample Data List Services failed. Status Code: 400. Message: Bad request. |
Logout
Logs out and deletes the access token.
Input
N/A
Output
To view the sample output data for all commands, refer to this article.
Error Handling
If the Return Data displays Failed, an Error tab will appear in the Test Result window.
The error tab contains the details responded from D3 SOAR or third-party API calls, including Failure Indicator, Status Code, and Message. This can help locate the root cause of a command failure.
Parts in Error | Description | Example |
Failure Indicator | Indicates the command failure that happened at a specific input and/or API call. | Logout failed. |
Status Code | The response code issued by the third-party API server or the D3 SOAR system that can be used to locate the corresponding error category. For example, if the returned status code is 401, the selected connection is unauthorized to run the command. The user or system support would need to check the permission setting in the Barracuda Web Application Firewall portal. Refer to the HTTP Status Code Registry for details. | Status Code: 400. |
Message | The raw data or captured key error message from the integration API server about the API request failure. | Message: Bad request. |
Error Sample Data Logout failed. Status Code: 400. Message: Bad request. |
Retrieve Web Firewall Logs
Retrieves information on Network Firewall Logs. The log entries are sorted by created time in descending order.
Input
Input Parameter | Required/Optional | Description | Example |
Client IPs | Optional | Filters web firewall logs by client IPs. |
JSON
|
Start Time | Optional | Web firewall log entries generated after this time will be returned. By default, the value is 4 hours before End Time. | 2021-07-23T00:40:00 |
End Time | Optional | Web firewall log entries generated before this time will be returned. By default, the value is the current time. | 2021-07-23T01:40:00 |
Limit | Optional | The maximum number of logs that can be fetched at a time using the Logs REST API, between 1 and 100,000. By default, the value is 20. | 100 |
Output
To view the sample output data for all commands, refer to this article.
Error Handling
If the Return Data displays Failed, an Error tab will appear in the Test Result window.
The error tab contains the details responded from D3 SOAR or third-party API calls, including Failure Indicator, Status Code, and Message. This can help locate the root cause of a command failure.
Parts in Error | Description | Example |
Failure Indicator | Indicates the command failure that happened at a specific input and/or API call. | Retrieve Web Firewall Logs failed. |
Status Code | The response code issued by the third-party API server or the D3 SOAR system that can be used to locate the corresponding error category. For example, if the returned status code is 401, the selected connection is unauthorized to run the command. The user or system support would need to check the permission setting in the Barracuda Web Application Firewall portal. Refer to the HTTP Status Code Registry for details. | Status Code: 400. |
Message | The raw data or captured key error message from the integration API server about the API request failure. | Message: Bad request. |
Error Sample Data Retrieve Web Firewall Logs failed. Status Code: 400. Message: Bad request. |
Update Security Policy
Updates security policies from the Barracuda Web Application Firewall.
Input
Input Parameter | Required/Optional | Description | Example |
Policy Name | Required | The name of the security policy to be updated. | New_policy |
Policy Object | Required | The JSON object of the security policy to update. Only fields that need to be updated are required. |
JSON
|
Output
To view the sample output data for all commands, refer to this article.
Error Handling
If the Return Data displays Failed, an Error tab will appear in the Test Result window.
The error tab contains the details responded from D3 SOAR or third-party API calls, including Failure Indicator, Status Code, and Message. This can help locate the root cause of a command failure.
Parts in Error | Description | Example |
Failure Indicator | Indicates the command failure that happened at a specific input and/or API call. | Update Security Policy failed. |
Status Code | The response code issued by the third-party API server or the D3 SOAR system that can be used to locate the corresponding error category. For example, if the returned status code is 401, the selected connection is unauthorized to run the command. The user or system support would need to check the permission setting in the Barracuda Web Application Firewall portal. Refer to the HTTP Status Code Registry for details. | Status Code: 400. |
Message | The raw data or captured key error message from the integration API server about the API request failure. | Message: Bad request. |
Error Sample Data Update Security Policy failed. Status Code: 400. Message: Bad request. |
Update Service Status
Updates the status of the specified Web Application services.
READER NOTE
Service Names is a required parameter to run this command.
Run the List Services command to obtain the Service Names. Service Names can be found in the raw data at the path $.data.
Input
Input Parameter | Required/Optional | Description | Example |
Service Names | Required | The names of the web application services for which to update the status. Service Names can be obtained using the List Services command. |
JSON
|
Status | Required | The updated service status. Available options are:
| On |
Output
To view the sample output data for all commands, refer to this article.
Error Handling
If the Return Data displays Partially Successful or Failed, an Error tab will appear in the Test Result window.
The error tab contains the details responded from D3 SOAR or third-party API calls, including Failure Indicator, Status Code, and Message. This can help locate the root cause of a command failure.
Parts in Error | Description | Example |
Failure Indicator | Indicates the command failure that happened at a specific input and/or API call. | Update Service Status failed. |
Status Code | The response code issued by the third-party API server or the D3 SOAR system that can be used to locate the corresponding error category. For example, if the returned status code is 401, the selected connection is unauthorized to run the command. The user or system support would need to check the permission setting in the Barracuda Web Application Firewall portal. Refer to the HTTP Status Code Registry for details. | Status Code: 400. |
Message | The raw data or captured key error message from the integration API server about the API request failure. | Message: Bad request. |
Error Sample Data Update Service Status failed. Status Code: 400. Message: Bad request. |
Test Connection
Performs a health check on an integration connection. You can schedule a periodic health check by selecting Connection Health Check when editing an integration connection.
Input
N/A
Output
Output Type | Description | Return Data Type |
Return Data | Indicates one of the possible command execution states: Successful or Failed. The Failed state can be triggered by any of the following errors:
You can view more details about an error in the Error tab. | String |
Error Handling
If the Return Data displays Failed, an Error tab will appear in the Test Result window.
The error tab contains the details responded from D3 SOAR or third-party API calls, including Failure Indicator, Status Code, and Message. This can help locate the root cause of a command failure.
Parts in Error | Description | Example |
Failure Indicator | Indicates the command failure that happened at a specific input and/or API call. | Test Connection failed. Failed to check the connector. |
Status Code | The response code issued by the third-party API server or the D3 SOAR system that can be used to locate the corresponding error category. For example, if the returned status code is 401, the selected connection is unauthorized to run the command. The user or system support would need to check the permission setting in the Barracuda Web Application Firewall portal. Refer to the HTTP Status Code Registry for details. | Status Code: 403. |
Message | The raw data or captured key error message from the integration API server about the API request failure. | Message: You must have a valid support account to call this API. |
Error Sample Data Test Connection failed. Failed to check the connector. Status Code: 400. Message: Server Url is not valid in format. |