.png)
Data Ingestion
The Data Ingestion module shows a complete list of all ingested events and incidents by data sources. This module is divided into two tabs:
Event Intake
Incident Intake
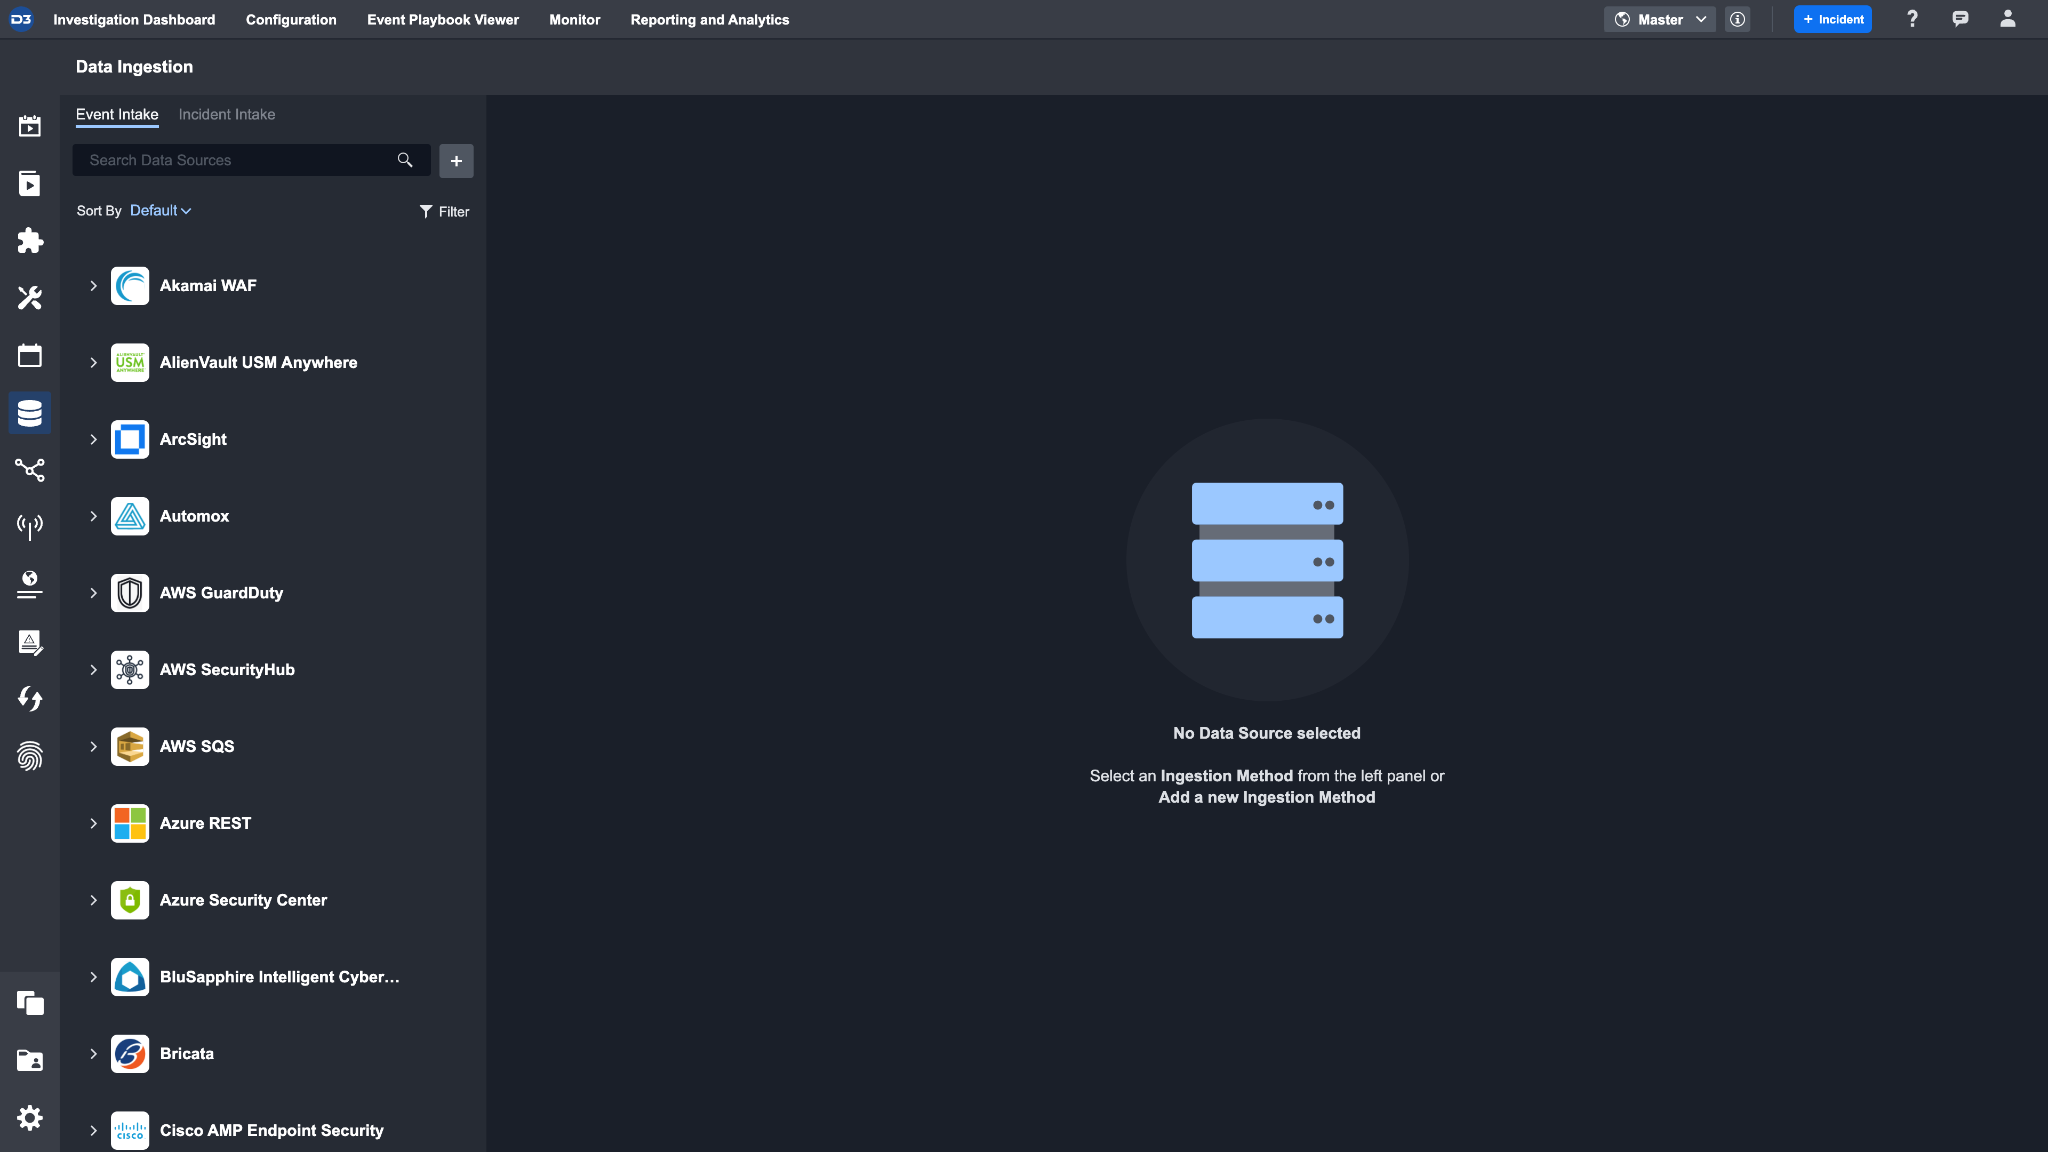
Intake Methods for Data Sources
There are three methods you can use to ingest data into D3 SOAR:
Schedule: Schedule a Fetch Event/Incident Command to ingest data
Webhook: Use a webhook to push data into the system
File: Upload Files to ingest Event data (For details on how to ingest data by file upload, please refer to Investigation Dashboard)
UI Structure
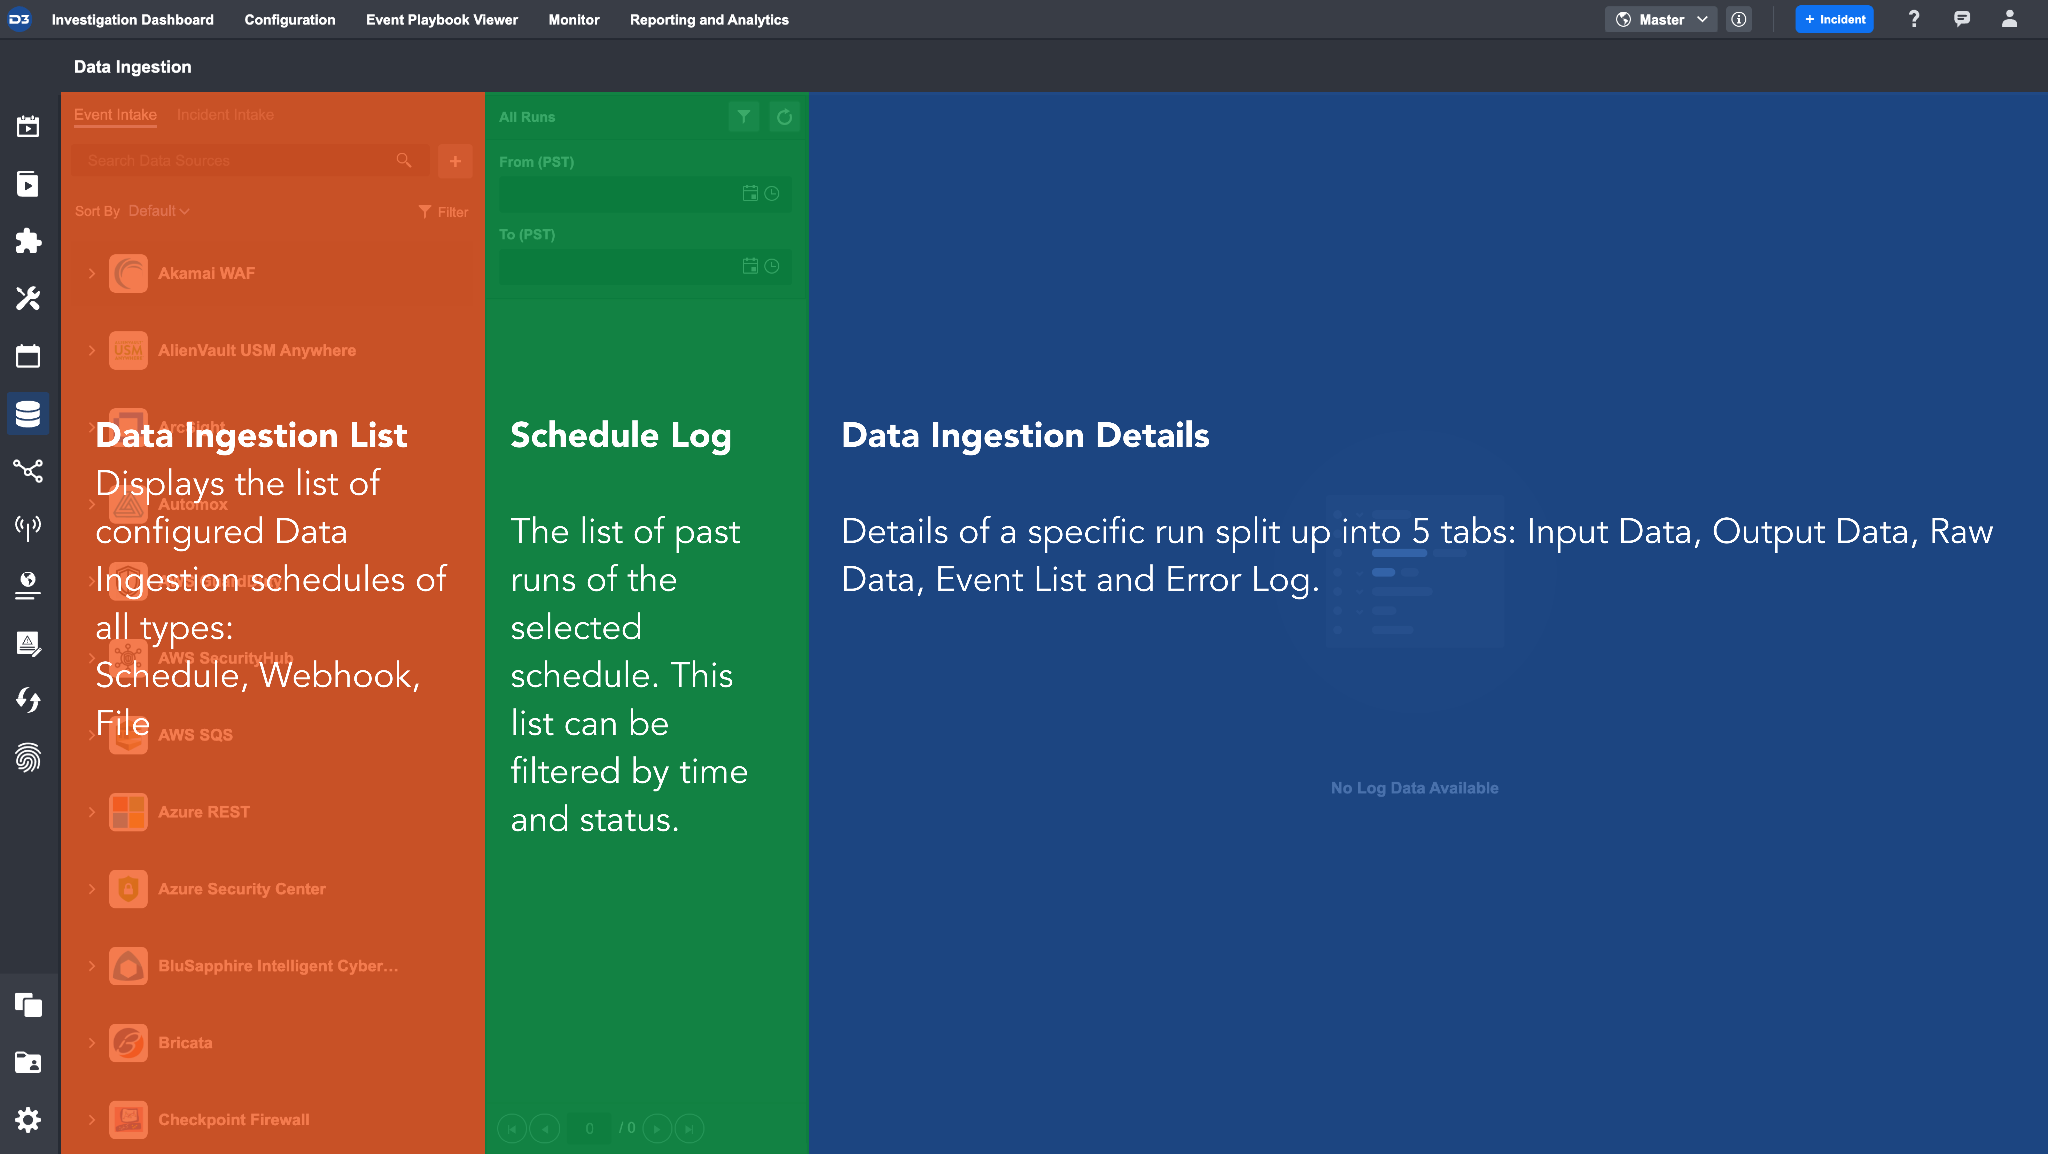
The Data Ingestion module’s UI contains the following components:
Data Ingestion List | This section displays the list of configured Data Ingestion schedules. You can find two different types of Data Ingestion methods here: Schedule and Webhook. At the top of the section, there is a search bar to help you search for the schedule you need. Data ingestion schedules are sorted by integration by default, but you can also sort by sites. Sorting by sites will nest all integrations and data ingestion schedules under that particular site. |
|---|---|
Schedule Log | This section displays the list of logs of past runs of the selected schedule. Here, you can see all past runs of this schedule and filter them by time and status. |
Data Ingestion Details | This section shows all the log details of a specific run. The information is categorized into five tabs: Input Data, Output Data, Raw Data, Event List, Incident List (only in Incident Intake), and Error Log. |
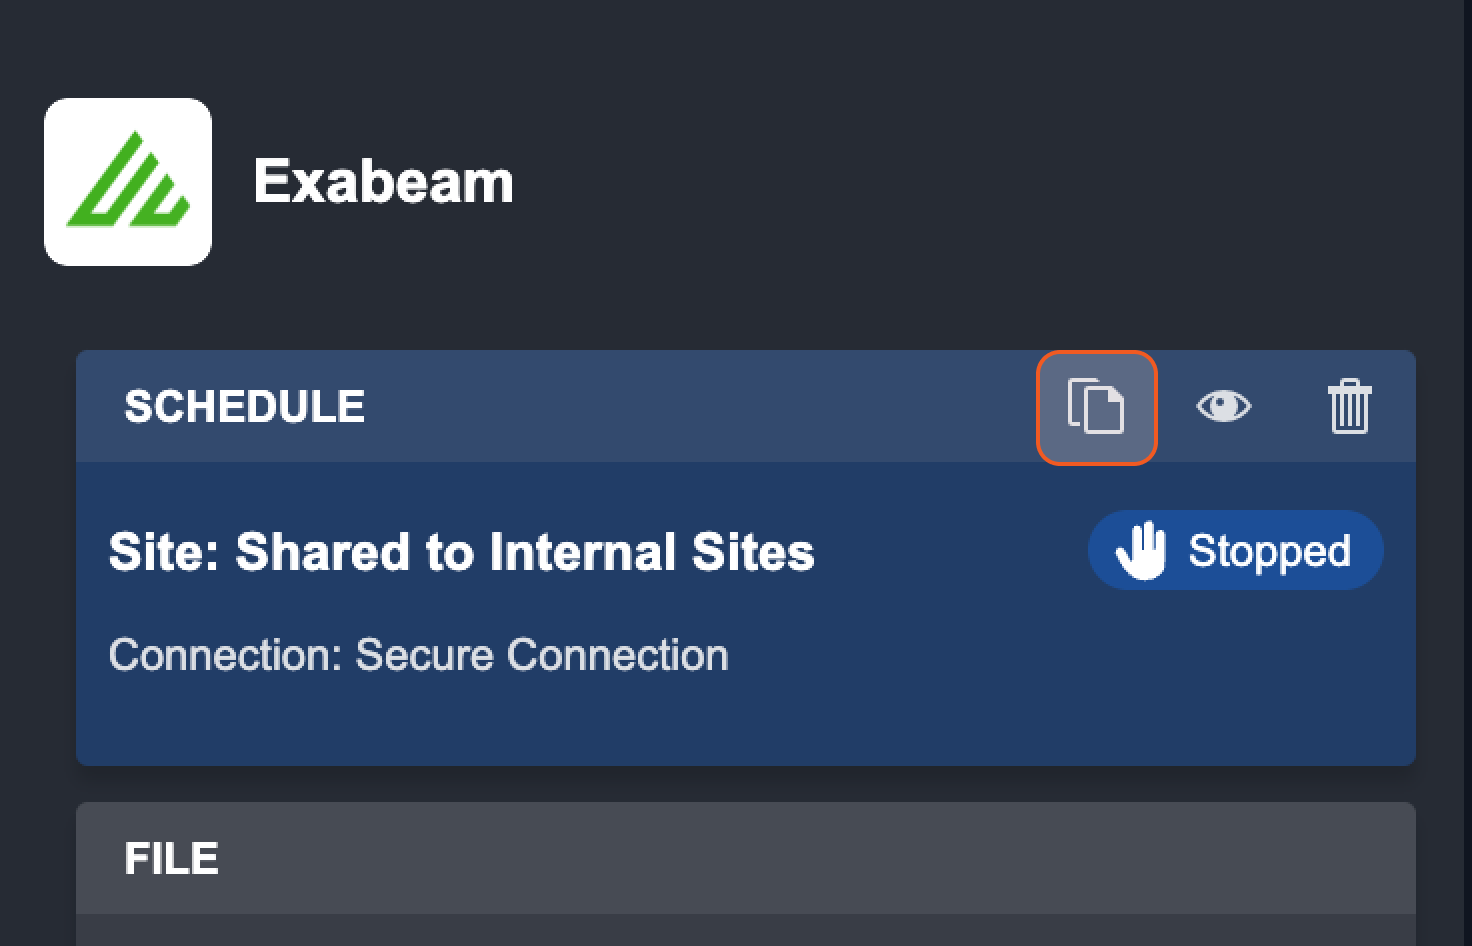
Data Ingestion Card
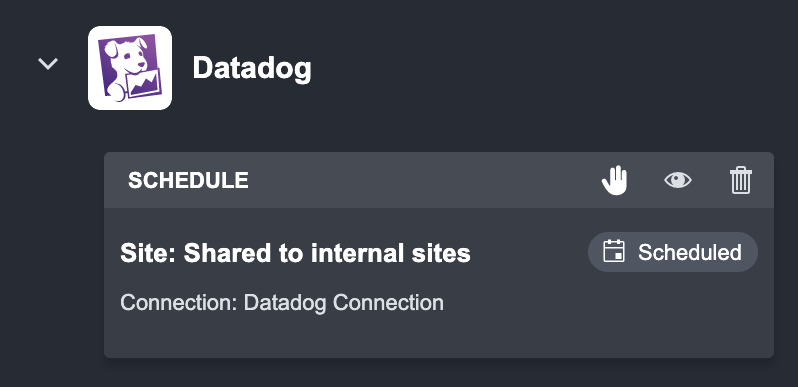
A data ingestion card displays the schedule’s Site information and Connection information. There are a few actions you can take on a Schedule:
Action | Description |
|---|---|
 Stop | This action stops this schedule. |
 Clone | Clone this schedule’s configuration. |
 View | View the current configuration for this fetched schedule. |
 Delete | Delete this schedule and its associated logs. |
Reader Note
You cannot restart a stopped schedule, but you can clone a stopped schedule to run it again.
In addition, the status tag on the right displays the current state of the fetch Schedule:
Status | Description |
|---|---|
 | This indicates that the fetch schedule is currently active and running. |
 | This indicates that the Fetch schedule has been manually stopped. |
Reader Note
Creating a new Ingestion Method for an Incident Intake is similar to the Event Intake instructions above. The only difference is that you will need to select the Incident Intake tab instead of the Event Intake.
Configuring Fetch Event Data Ingestion
Below are instructions on how to configure Schedule and Webhook as Intake Methods. Data ingestion by files can be done in the Investigation Dashboard.
Schedule
To configure a new Fetch Event schedule:
Click on the Event Intake tab.
Click on the + icon and select Schedule.
Select the desired Integration.
(Optional) Setup Event Field Mapping.
Select a Connection.
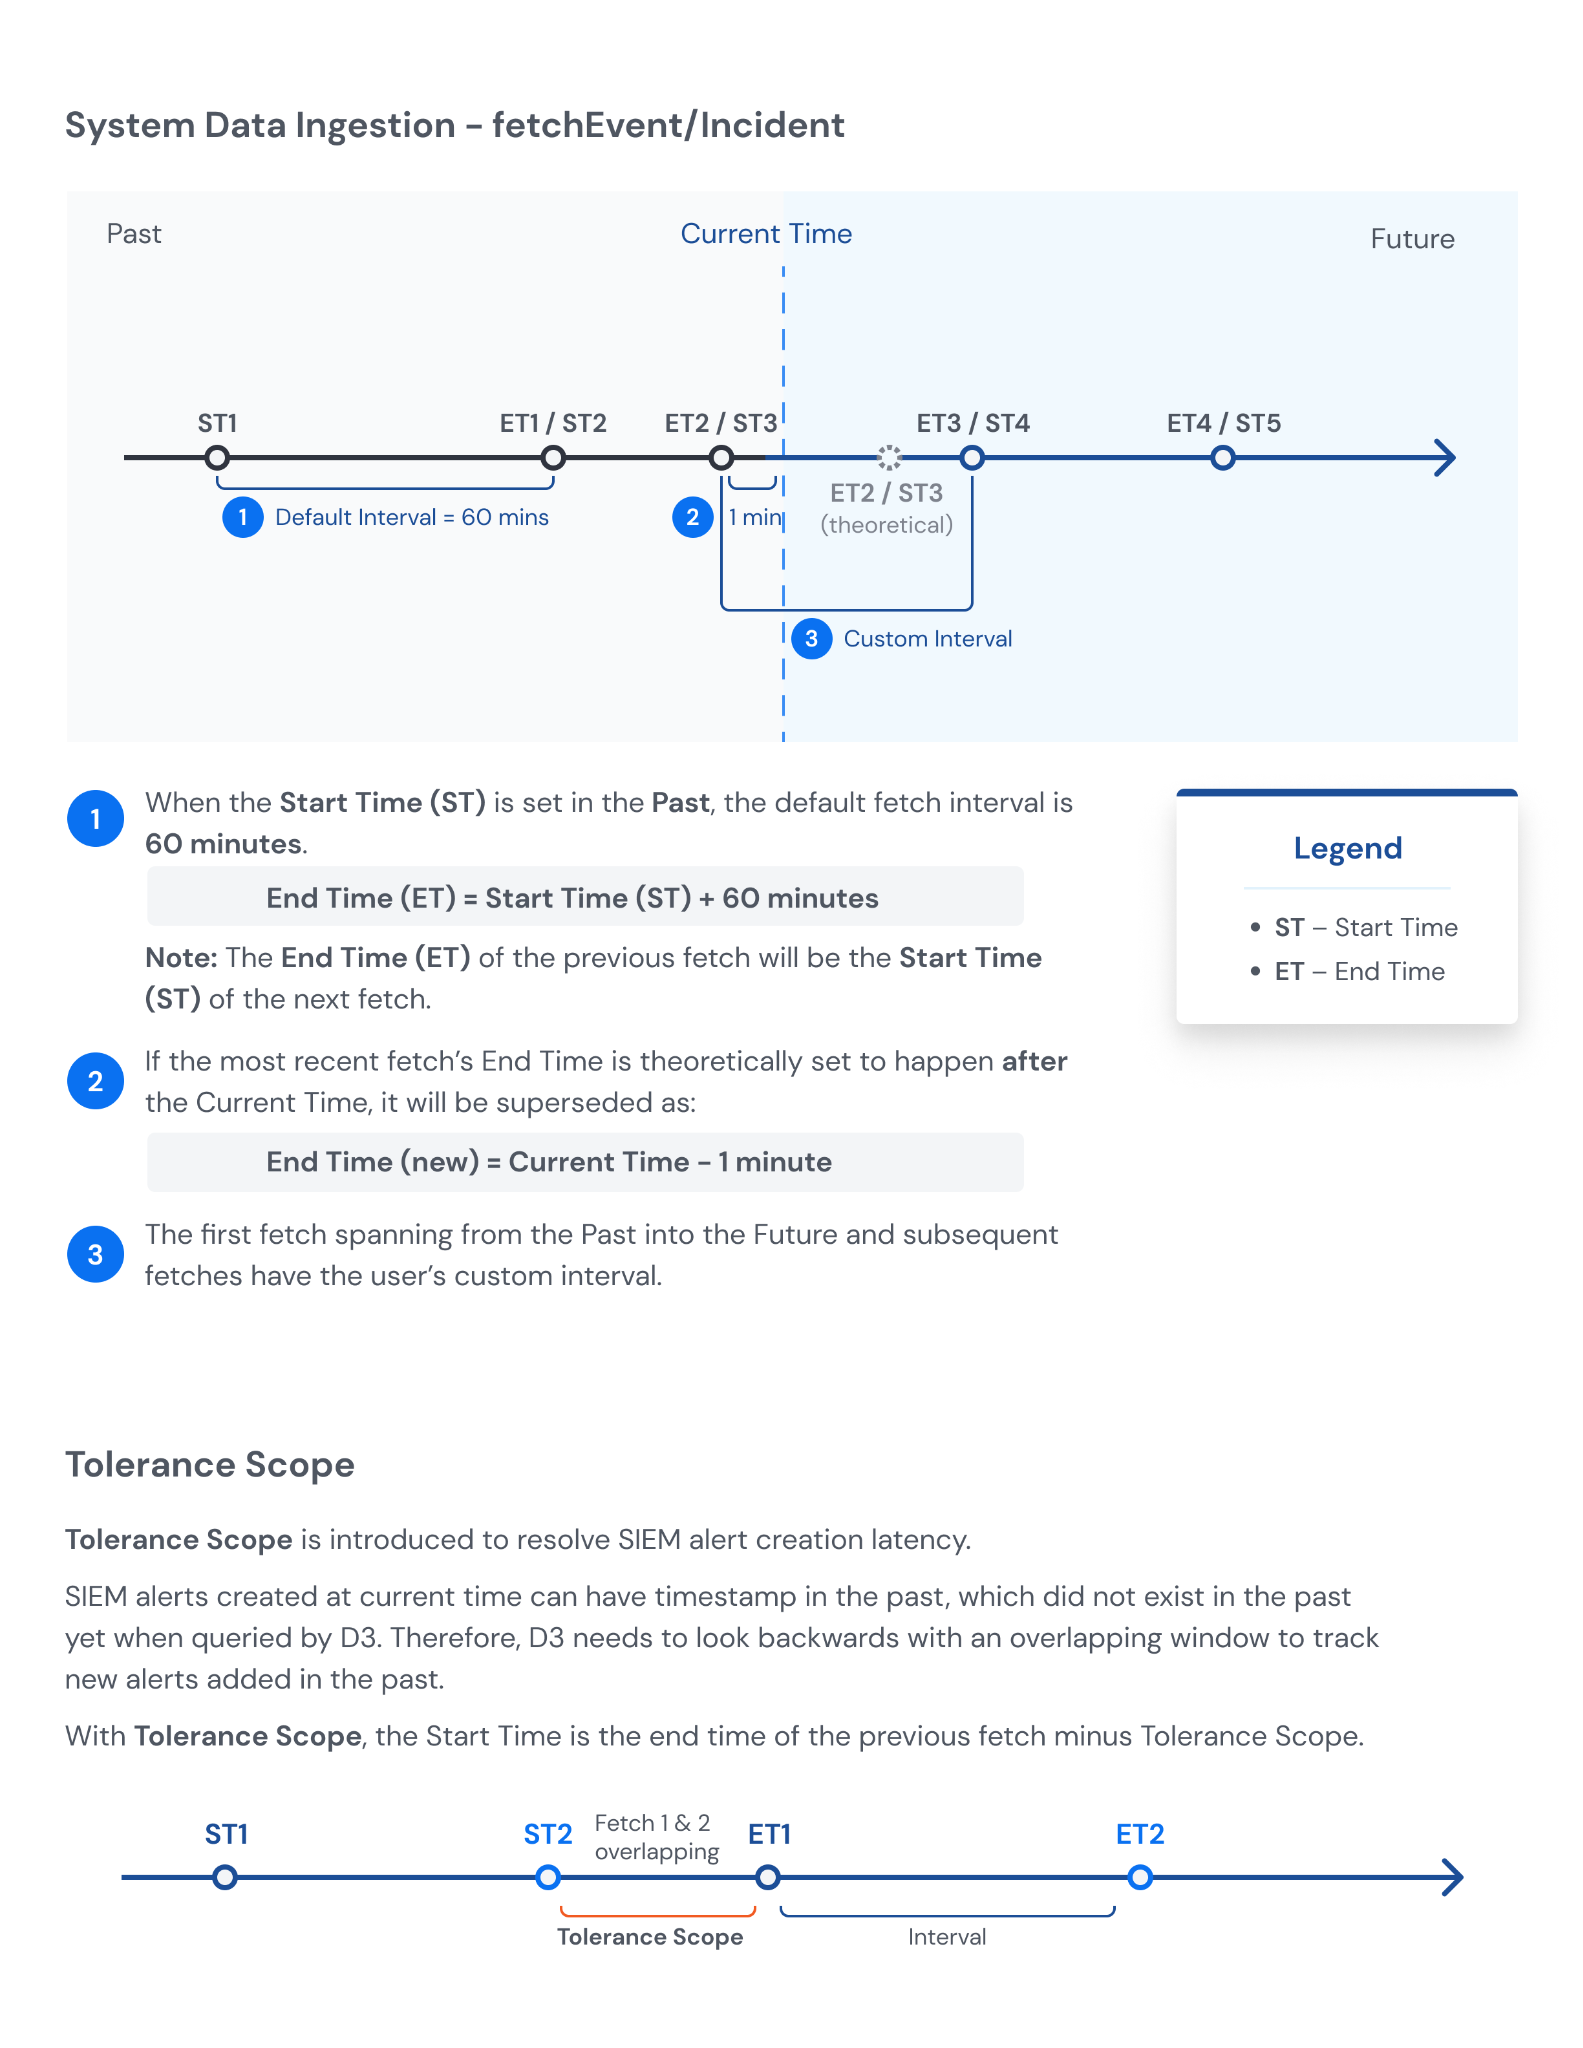
Set the Interval. This determines how often the schedule executes.
Set the Schedule Job Tolerance Scope. This determines the tolerance scope, in minutes, for data ingestion between the start and end time to prevent data loss. The data will be ingested starting from {Start Time - Tolerance Scope}. Note: This tolerance scope is calculated separately and does not affect the "Tolerance Scope" command parameters.
Select a Data Formatter custom utility command to transform the ingested event data.
Select an Event Playbook that you wish to run on this scheduled data ingestion.
Check the box to enable the automatic mapping of ingested events from the data source to MITRE tactics and techniques.
Check the box to allow event automation rules to be applied for dismissing or escalating the ingested events from the data source.
Fill in the inputs for the Fetch Event command in Command Details. (Command details may vary depending on the integration)
Click on Save & Run.
Result
The new Data Source will be displayed as a card on the left hand side and the schedule will start running.
Webhook
The Webhook ingestion method allows the Integration to send event or incident data (in JSON format) to be investigated in the D3 vSOC platform. This allows real-time, controlled event or incident data ingestion for SOC teams, and offers greater flexibility.
The following is a general how-to for setting an Event Ingestion webhook.
Reader Note
Incident ingestion in webhook will look and function similarly. We recommend referring to this how-to for setting up an incident intake command as well.
Click on the Event Intake tab.
Click on the + icon and select Webhook.
Select the desired Integration.
Select the applicable Site(s).
Select the Authentication Method.
(Optional) Set up Event Field Mapping.
Authentication Method: API Key
For the selected site, you can select an existing key or generate a new one for authentication. To select existing keys, click on a key under "Existing Keys". To generate a new key, click on the + button adjacent to the site name.
If you are generating a new key, enter an alias for your key, then click Generate.
For detailed information about configuring the API key, refer to the Authentication Method: API Keys subsection under Event/Incident Intake in the Webhook Configuration Guide document.
Authentication Method: JSON Web Token (JWT)
For the selected site, you can select an existing key or generate a new one for authentication. To select existing keys, click on a key under "Existing Keys". To generate a new key, click on the + button adjacent to the site name.
If you are generating a new key, enter an alias for your key. You have the option to allow all users to view the key. Click Generate.
For detailed information about configuring the JSON web token, refer to the Authentication Method: JSON Web Token (JWT)subsection under Event/Incident Intake in the Webhook Configuration Guide document.
Cloning an Existing Fetch Schedule
Click on the copy button of the schedule you want to clone.
Reader Note
The copy button is only available when a schedule is in the Stopped state.
In the Clone Data Source window, update the input parameters you would like to change, if any. Integration and Intake Method cannot be changed for a clone.
Click on Clone and Start.
Result
The new fetch schedule will be created and appear above the previous fetch schedule card.
View Fetch Schedule Logs
Clicking on any of the Data Sources will display a time log and the imported data on the right-hand side.

You can narrow down this log by date range and/or by status using the filters provided at the top of the list. At a glance, you can view if a run was successful by looking at the icon on the right side of the date and time.
Status | Description |
|---|---|
 Done | This indicates that the run was successful and Event data has been received. |
 Done (No Data) | This indicates that the run was successful but no Event data was received. |
 Error | This indicates that the run was unsuccessful. |
 Running | This indicates that the run is initiated but there are tasks that haven't run yet. |
The data of each run is displayed on the right-most panel, split into tabs:
Input Data: Input parameters of the fetch Event/Incident command
Output Data: Event/Incident data from this scheduled fetch run
Raw Data: Original data pass into the system
Event List: List of Events ingested into the system
Error Log (Only shows if there is error): All error data when the run is unsuccessful
Playbook (Only Playbook Implementation): Runtime Playbook configured for this schedule