.png)
Reporting and Analytics
The Reporting and Analytics Reporting module provides customizable dashboards for your SOC team managers and executives to review the operational KPIs. Key metrics are provided out-of-the-box to help track the organization’s security posture and your SOC team's performance. Highlighted features include the ability to:
View key built-in metrics such as Time to Respond, Time to Contain, Time to Remediate, Time to Resolve, and Time to Complete for Incidents and Cases.
Build new charts and slice & dice reports on demand.
Conduct complex analysis using multiple dimensions to reveal patterns and trends.
Schedule reports to be sent to key stakeholders.
Overview of Reporting and Analytics Functionality
You can use Reporting and Analytics Reporting to combine reports from multiple modules to fulfill their unique, user-defined criteria. This guide will cover the configuration for both components of the Reporting and Analytics Reporting module: Dashboard and Individual Reports.
The Reporting and Analytics Reporting tool offers the ability to:
Modify column widths by clicking and dragging
Move columns by clicking and dragging
View a single record directly from the dashboard
Send email notifications with reports directly to user
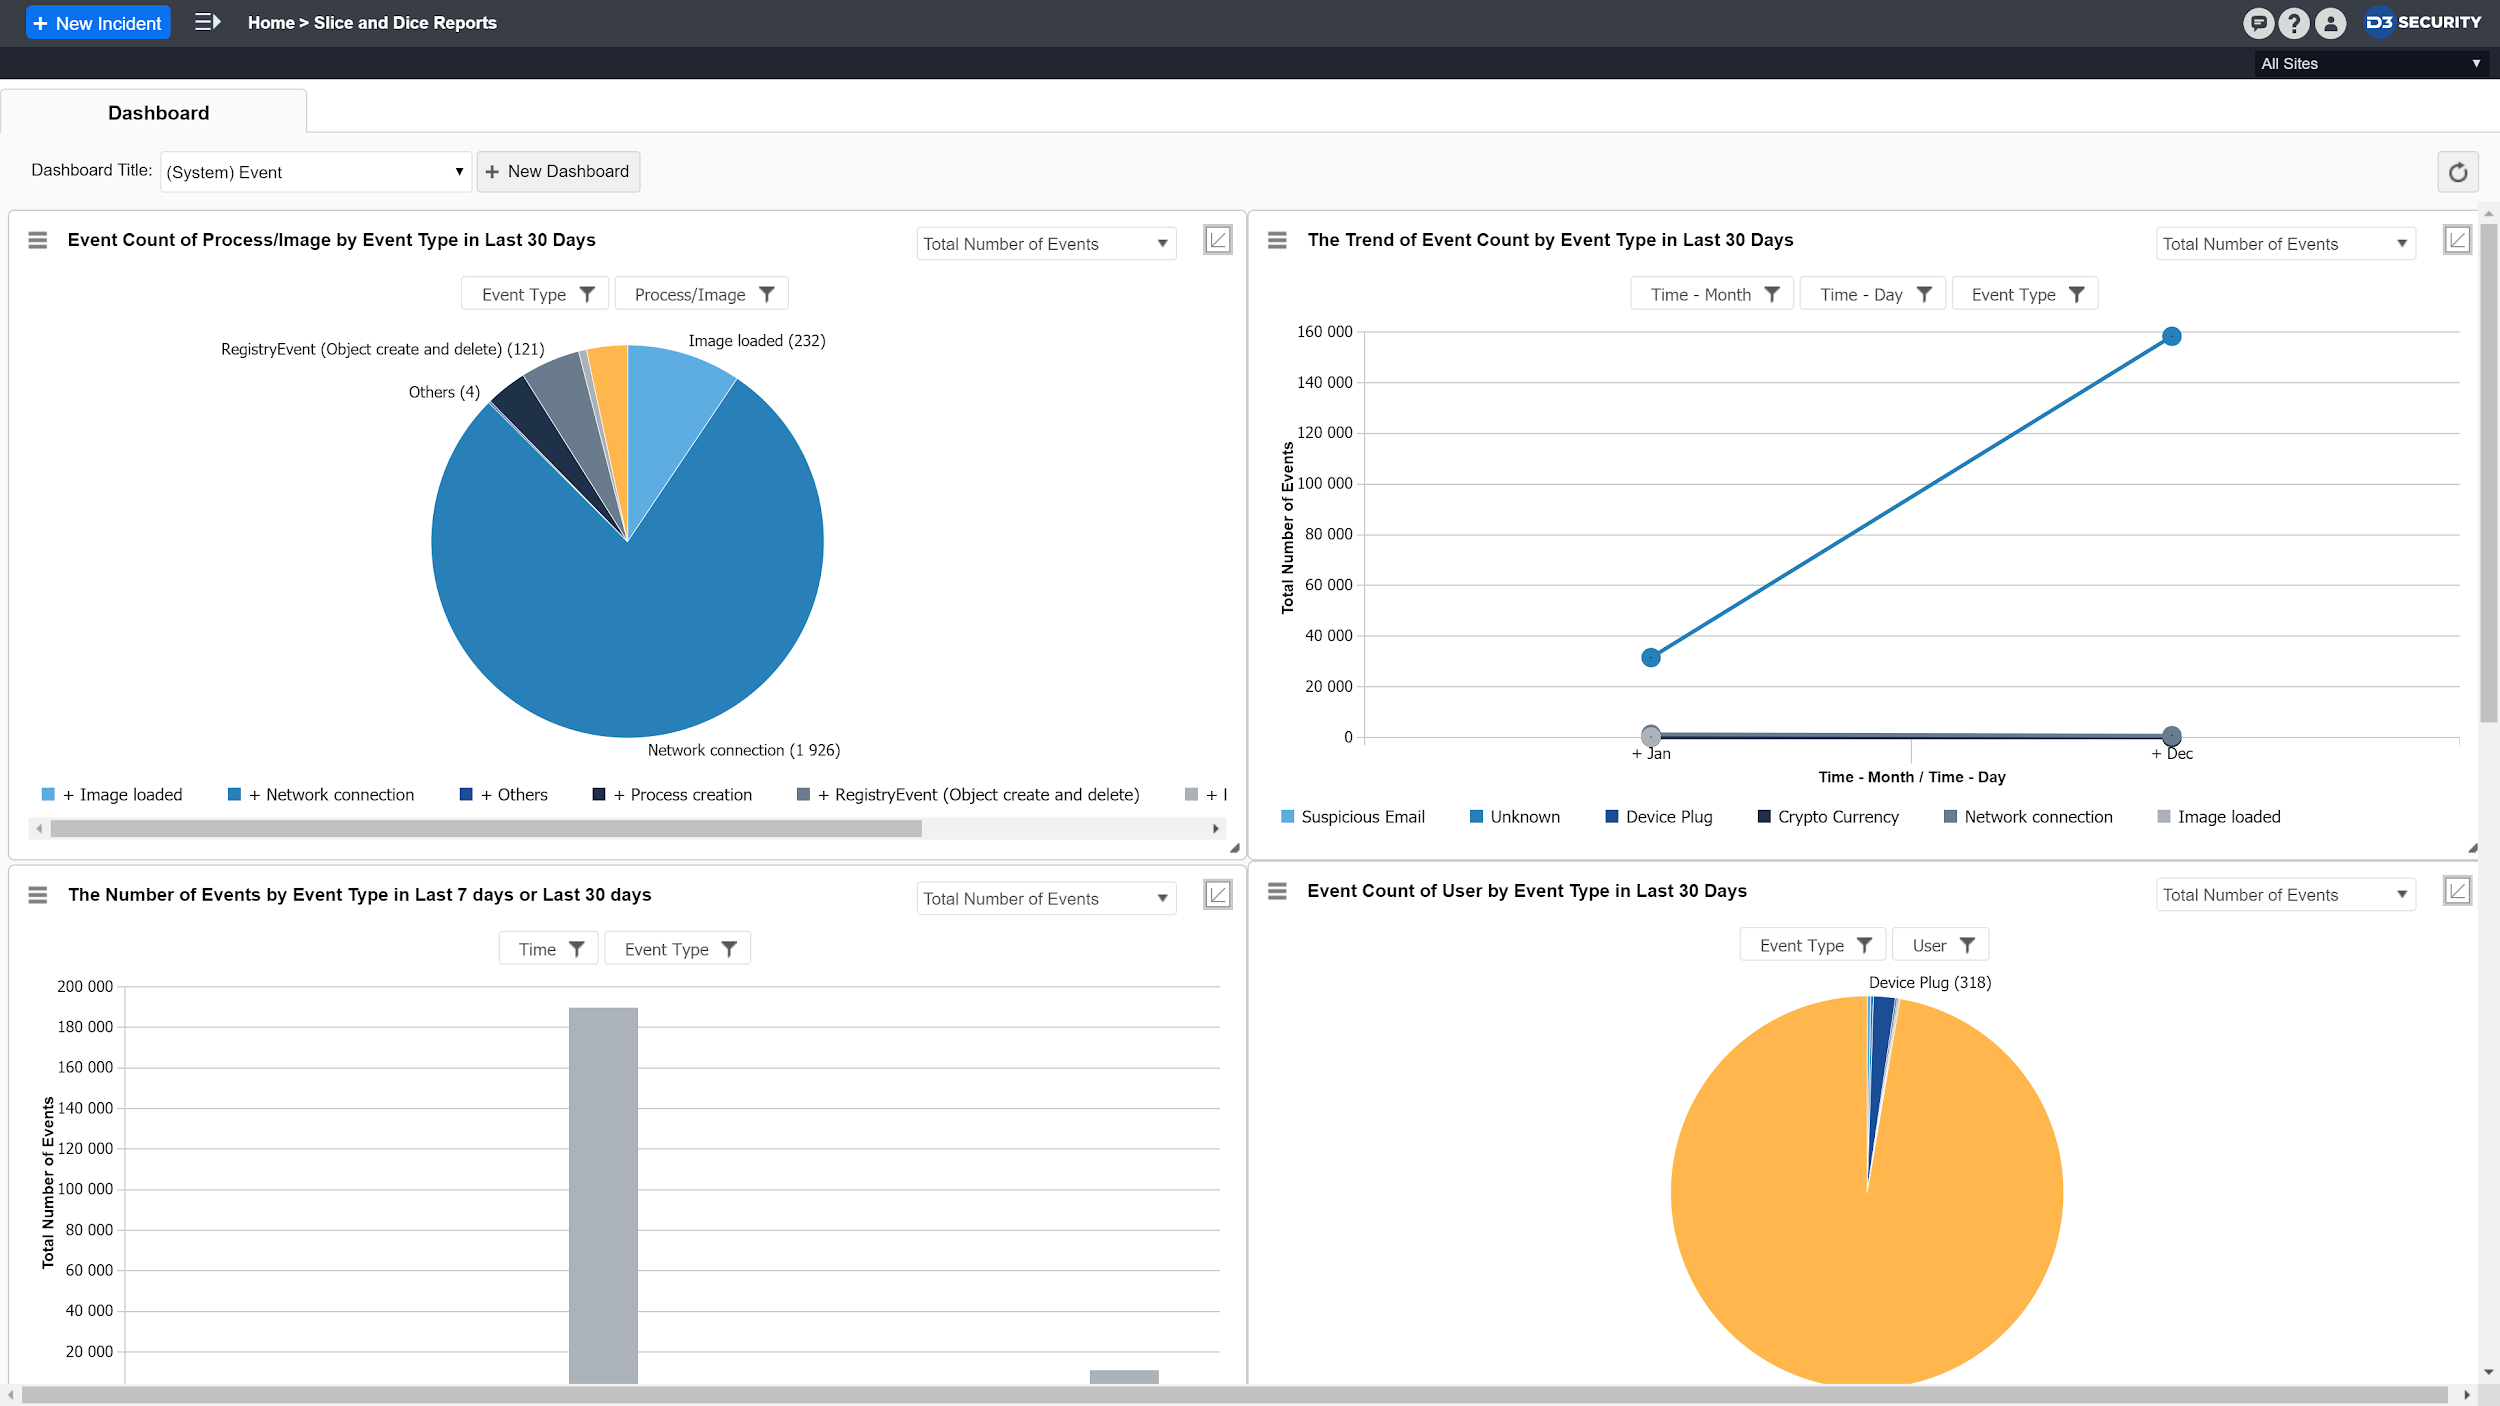
An example of a customized Reporting and Analytics Dashboard
Reporting and Analytics Dashboard
You can create new Reporting and Analytics Dashboards to combine reports from multiple data sources into a single comprehensive display.
Creating a new Reporting and Analytics Dashboard
Click the + New Dashboard button.
Within the Add New Dashboard window, enter a title for the dashboard.
Reader Note
The entered title can be changed at a later stage by clicking the Edit icon on the toolbar at the top of the module’s main page.
Select the Roles and/or Sites that can access the dashboard.
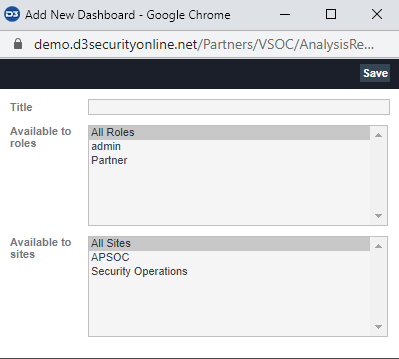
Click Save to confirm.
Result: A blank dashboard will be created on the Reporting and Analytics main window. You can begin adding reports to this dashboard.
Viewing an Existing Dashboard
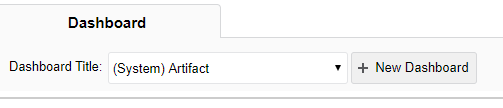
Once multiple dashboards have been created, you can select a specific dashboard to display from the Dashboard Title dropdown list.

Example of the Dashboard Title dropdown list after multiple dashboards are created.
Reader Note
As an admin user, you can apply role-based access privileges in the Settings page to restrict certain roles from viewing cyber system reports. Refer to the Reporting and Analytics role tokens in the Roles module.
Navigating the Dashboard
From the Dashboard view, you can perform the following actions:
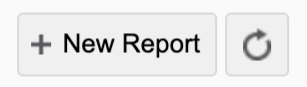
Add Report and Refresh
Add Report: you can click + New Report to configure individual reports on the dashboard.
Refresh: you can refresh the current dashboard for recently edited fields.
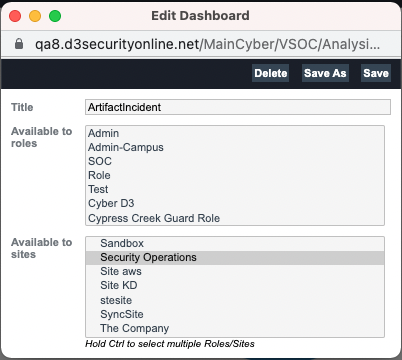
Then click on Edit Dashboard button
Within the Edit window, you can modify the title of the selected dashboard. You can also Delete and Save another copy of the dashboard.Delete: From the Edit window, you can remove an entire saved dashboard. However, doing so will delete all individual reports on the dashboard.
Save As: From the Edit window, you can save a copy of the current dashboard view under a separate title.

Reports
The Reporting and Analytics Dashboard comprises multiple custom dashboard reports that you can select.
To Add a New Report
Click the + New Report button in your Dashboard. (Create one if needed)
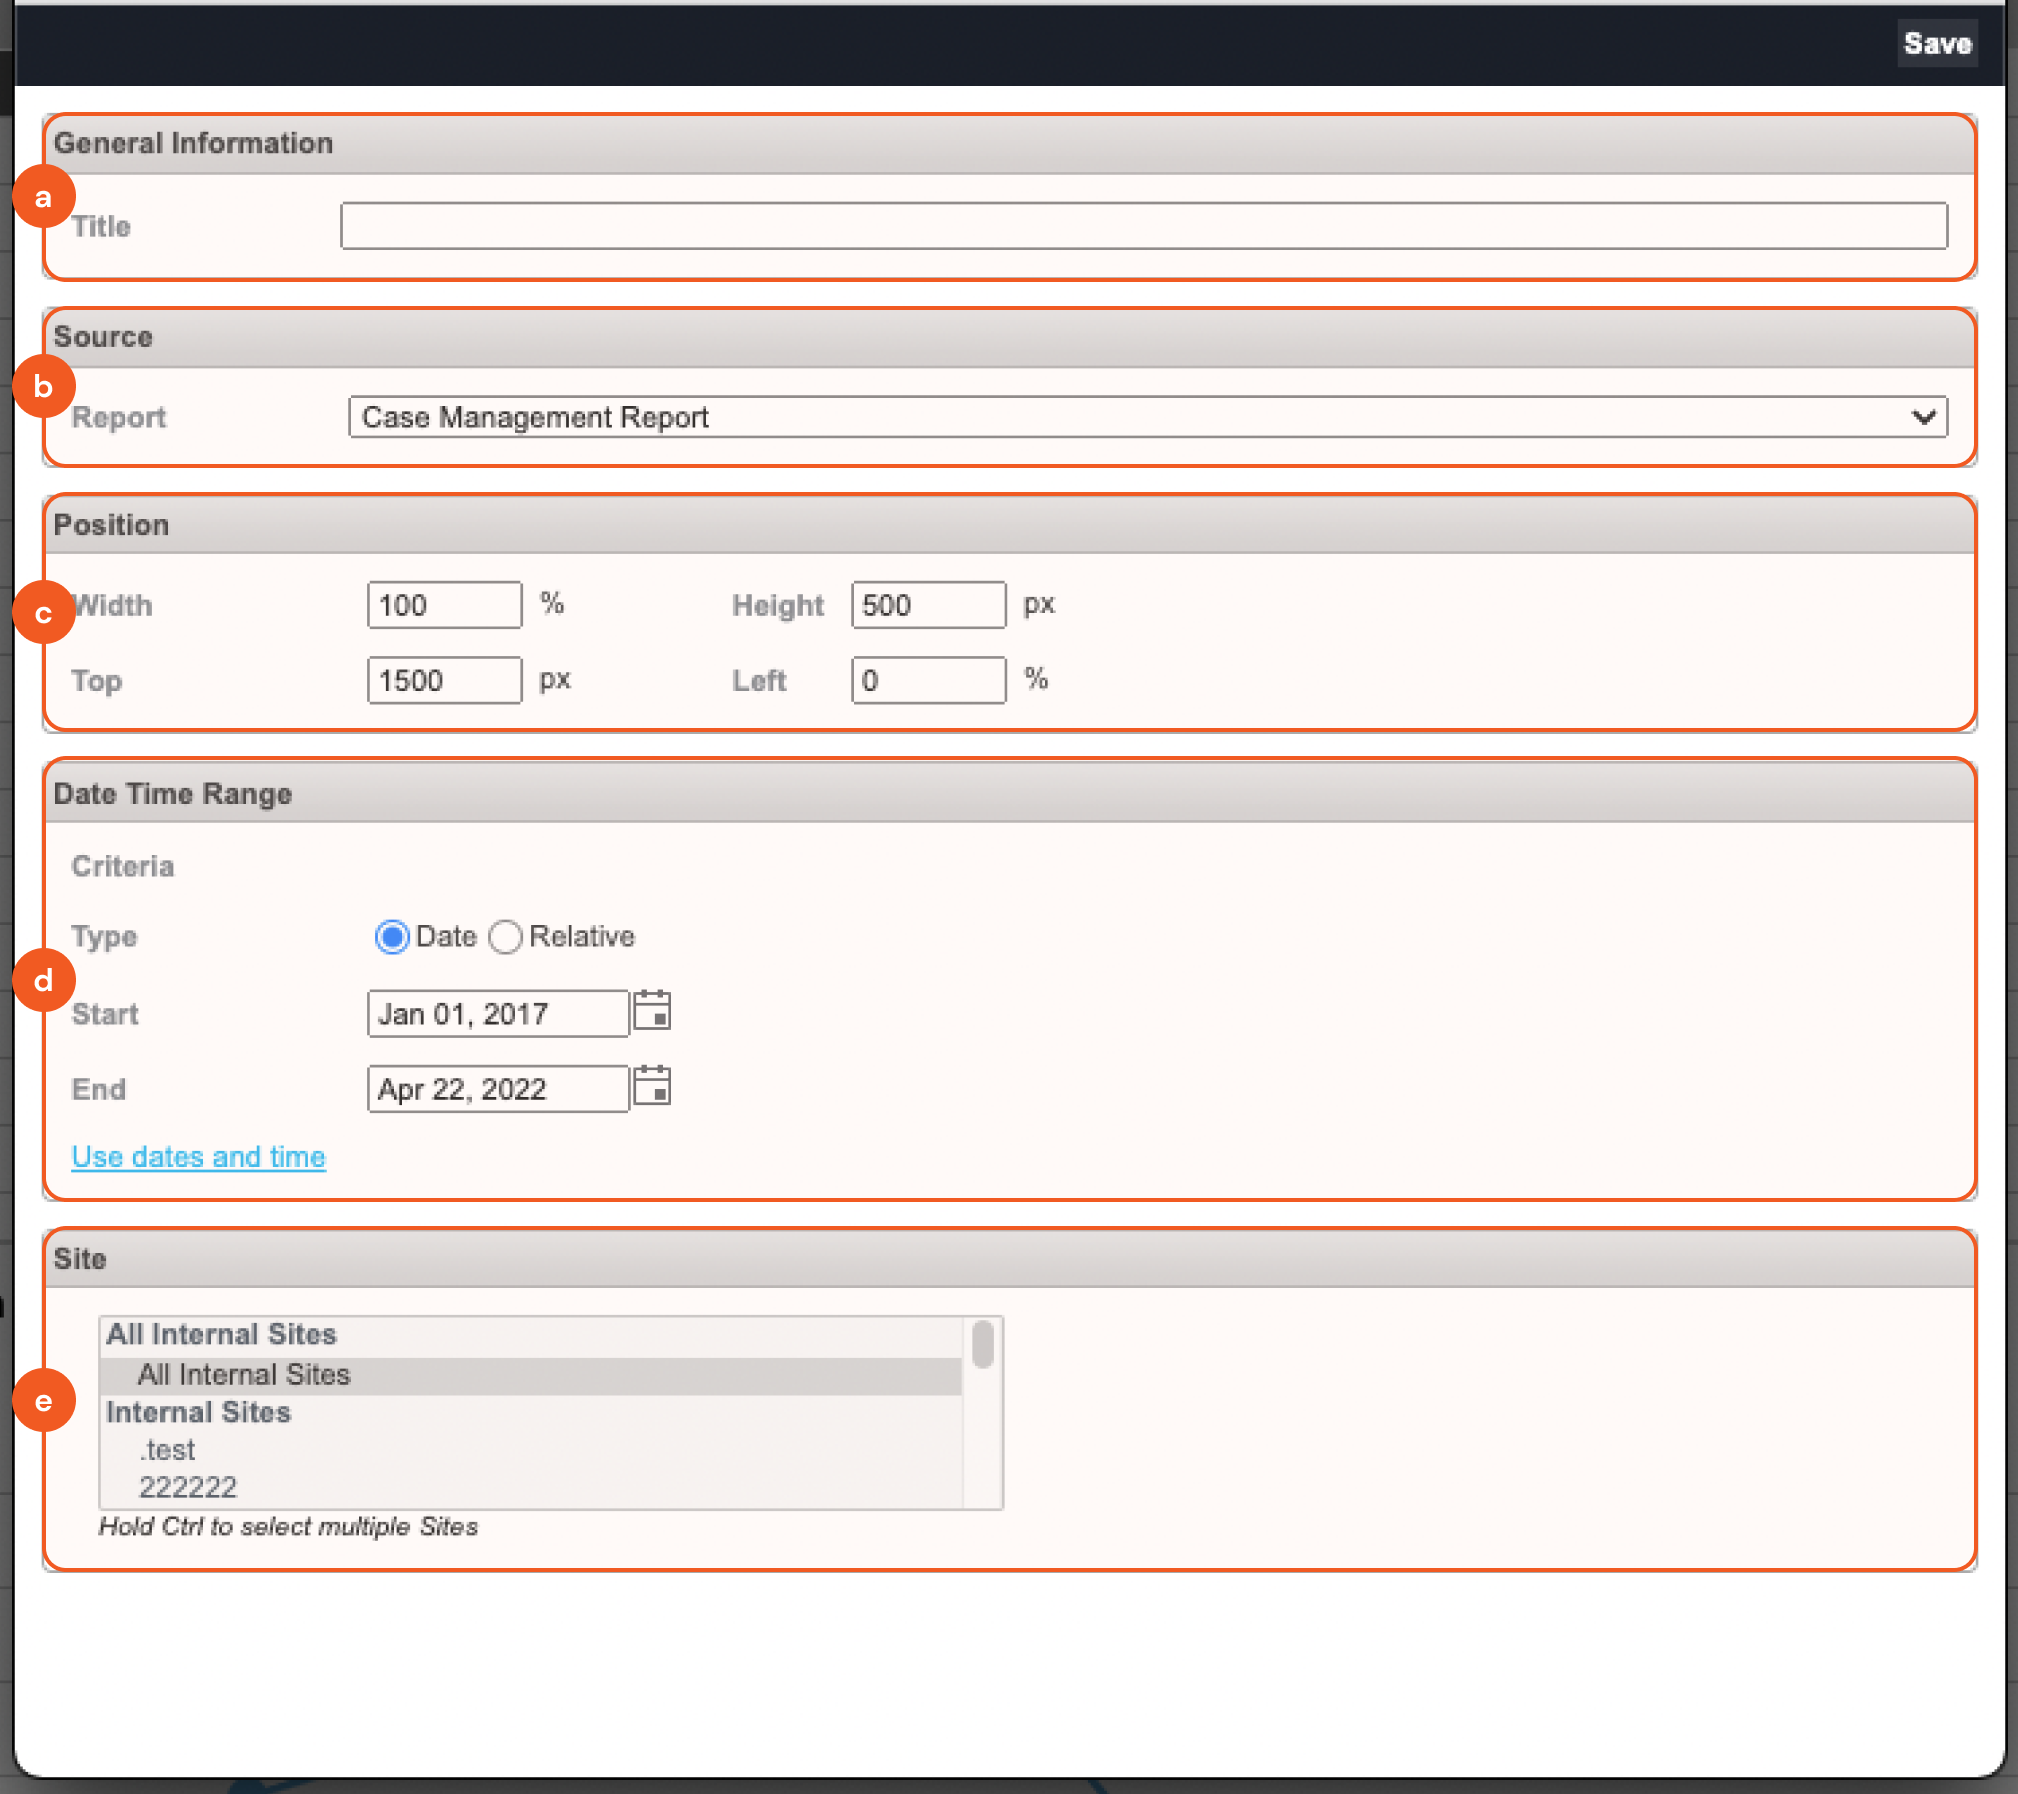
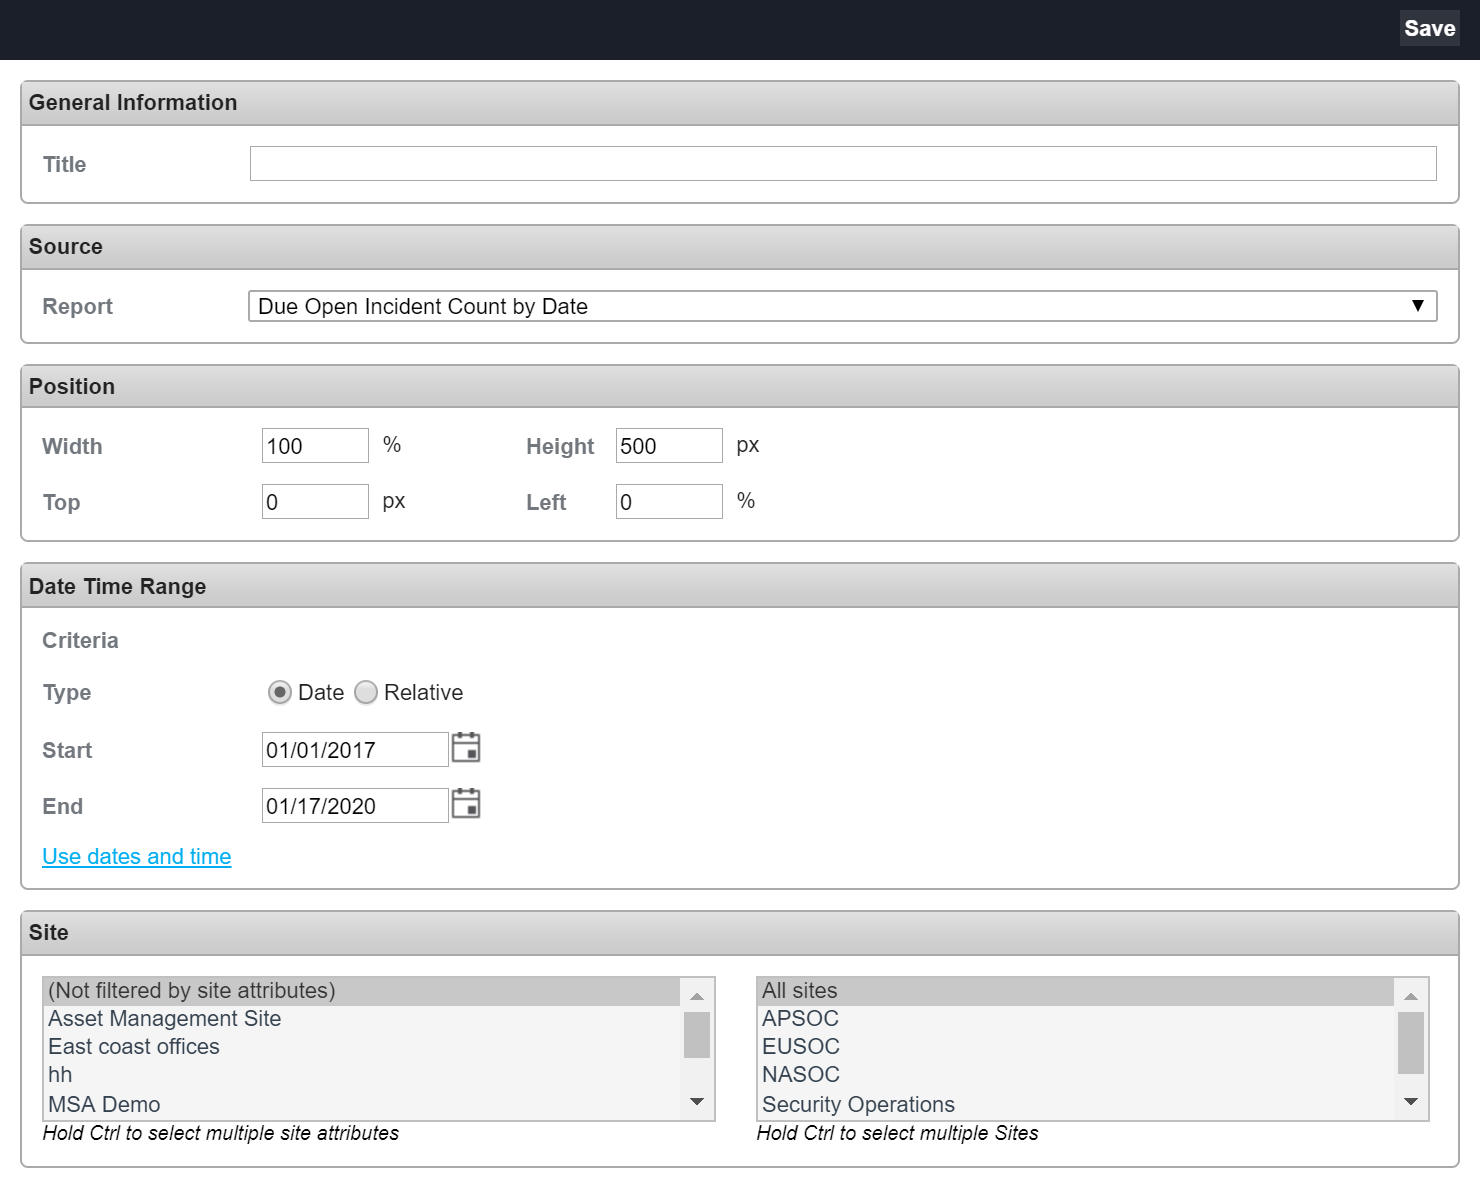
Within the Add Report window, enter the following information:
General Information: Enter a title for the report. The entered title will display in the Dashboard drop-down.
Source: Select the data source, module and type of report. Reports can be imported from saved or published instant reports or analytics reports.
Position: Set the height, width and position of the report in the dashboard. You can subsequently reposition and resize reports by clicking and dragging on the report in the dashboard.
Date Time Range: Set the criteria around date and time range filters to limit reported data. You can also filter by a static or relative time range and/or site.
Site: Set site filters to limit reported data to specific sites and attributes.
Click on Save at the top right corner.
A new report will appear on the dashboard.
Editing Reports
Editing Functions
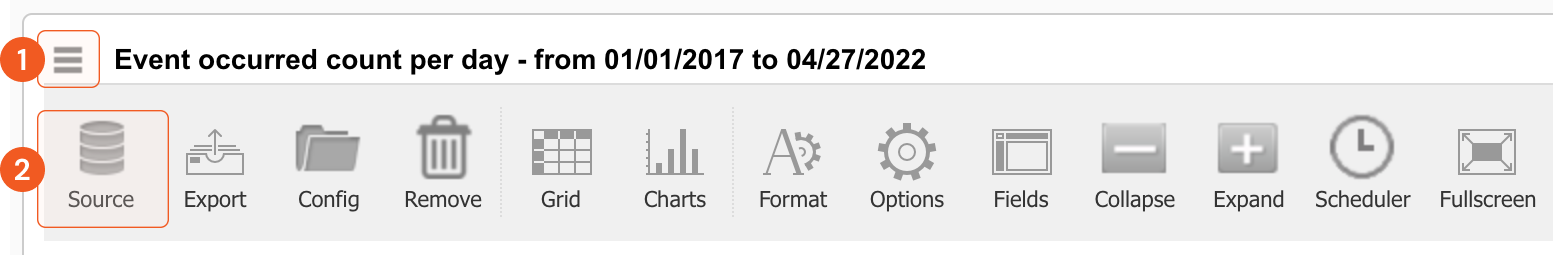
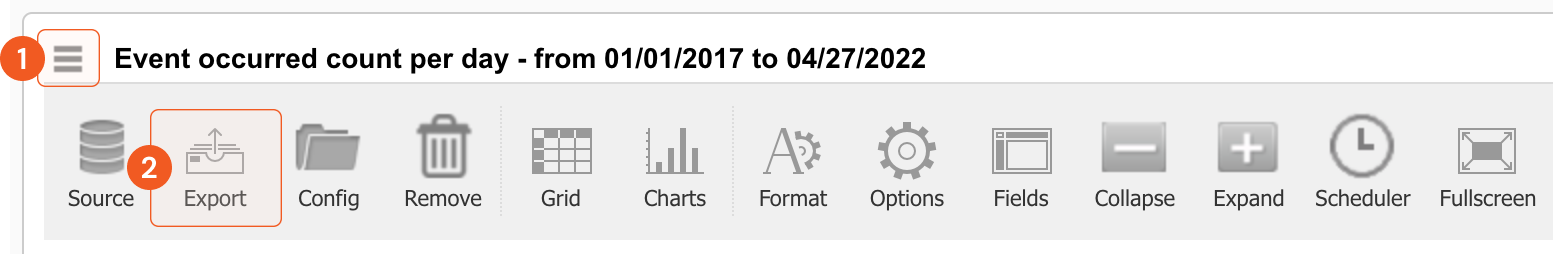
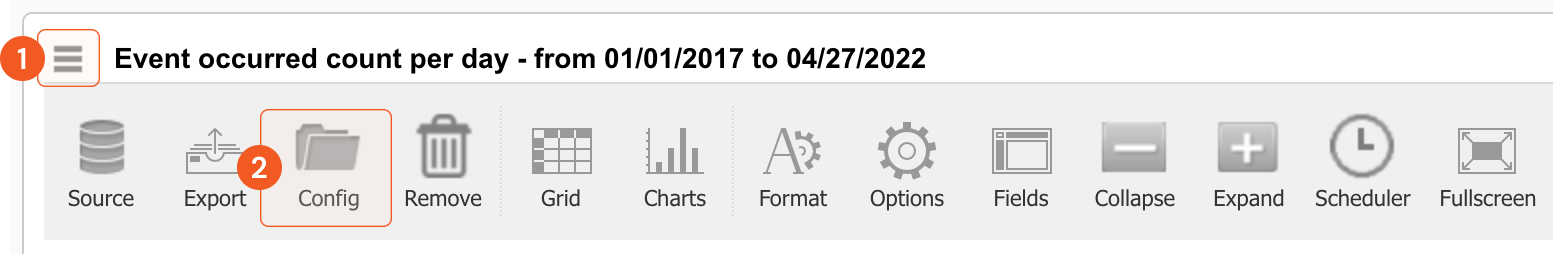
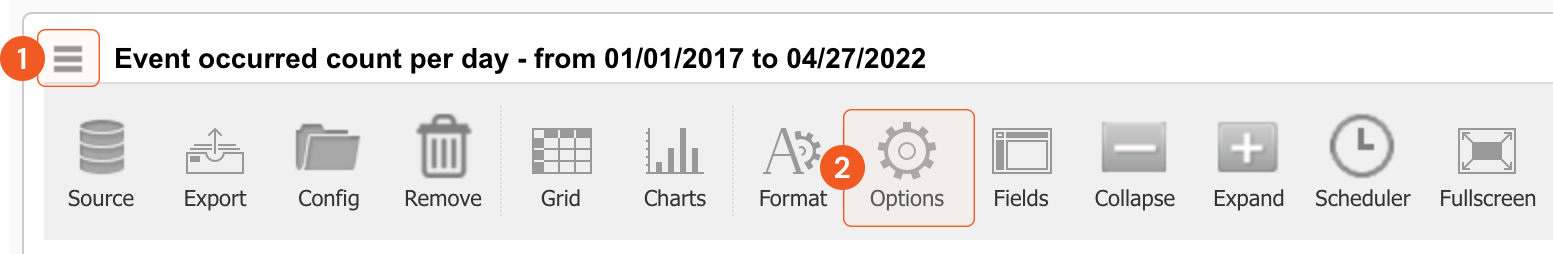
You can configure individual reports on the dashboard by clicking on the menu icon on the top-left corner of the report. You may also resize and/or reposition reports on the dashboard by dragging the corners of the report.

Menu  | Collapsible/expandable menu that contains all editing functions. |
Source  | Change the report data source. When selected, the change source form will appear on the screen. |
Export  | Print or export individual reports from a dashboard to a selected file format. |
Config  | Modify the Parameters of the selected report. Report Parameters include settings such as the Title, Position, Date/Time Range, and Site. |
Remove  | Delete the report from the dashboard. |
Grid  | Show report data in a grid format. |
Pivot / Charts   | Switch the report between pivot data or selected chart format. Chart formats include Bar, Line, Scatter, Pie, Bar Stack and Bar Line. Click on the menu to select another type of chart. |
Flat  | Show report data in a flat table format. |
Format  | Format cells or apply conditional formatting to report fields. |
Options  | Set layout options such as totals and subtotals. |
Fields  | Select and arrange the fields used in the report. |
Collapse / Expand  | Collapse / expand report data. |
Scheduler  | Set email scheduled notifications for the selected report. Recipients will receive an updated version of the report. |
Fullscreen  | Open the selected report in full screen view. When in full screen view, press ESC to return to the regular view. |
Modifying Report Sources
To modify the data source used for the selected Reporting and Analytics Report:
Click on Menu to reveal the Editing Functions.
Click the Source icon. The Change Source form appears.
Update the form as required.
Click on Save.
Printing and Exporting Reports
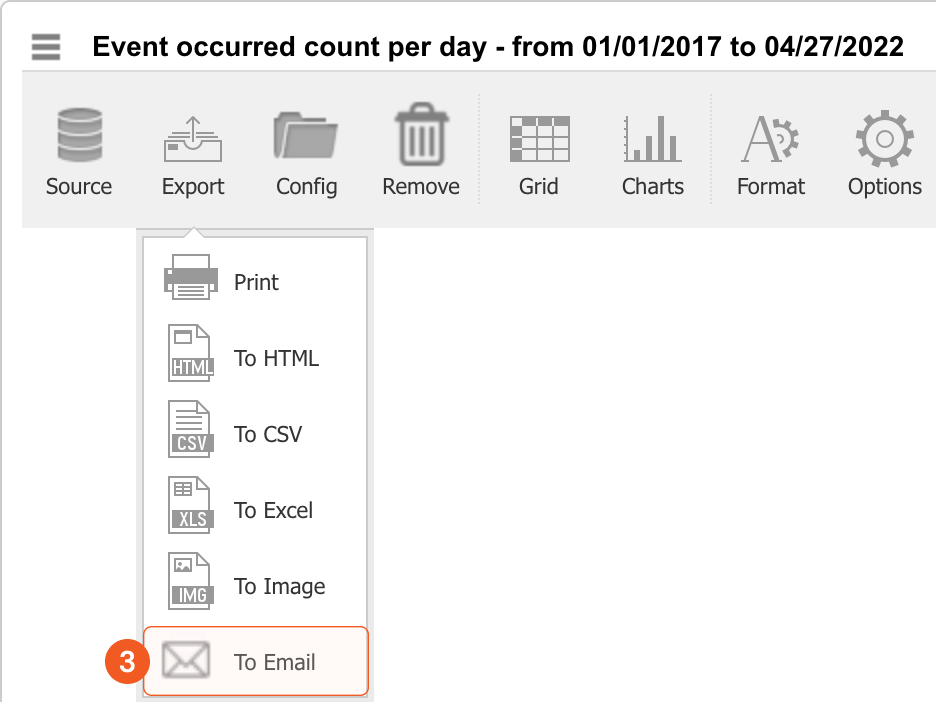
You can print or export individual reports from a dashboard to a selected file format. Export options include:
Print: Send to printer.
To HTML: Export as an HTML file.
To CSV: Export as a CSV file. Not available for charts.
To Excel: Export as an Excel file. Not available for charts.
To Image: Export as a .PNG file
To Email: Export as a selected file format and send to the recipient as an email attachment.
To Export a Report
Click on the menu icon on the top left corner of the report and click Export.
Select an export option from the Export drop-down menu.
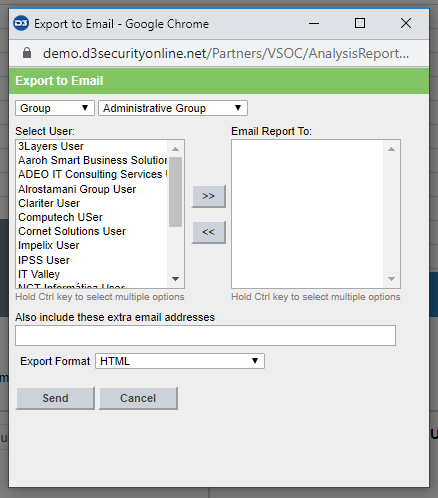
The To Email option will prompt the user to select the email recipients and report format.
Click Send to send the report as an email attachment in the selected format.
Configuring, Moving, and Resizing Reports
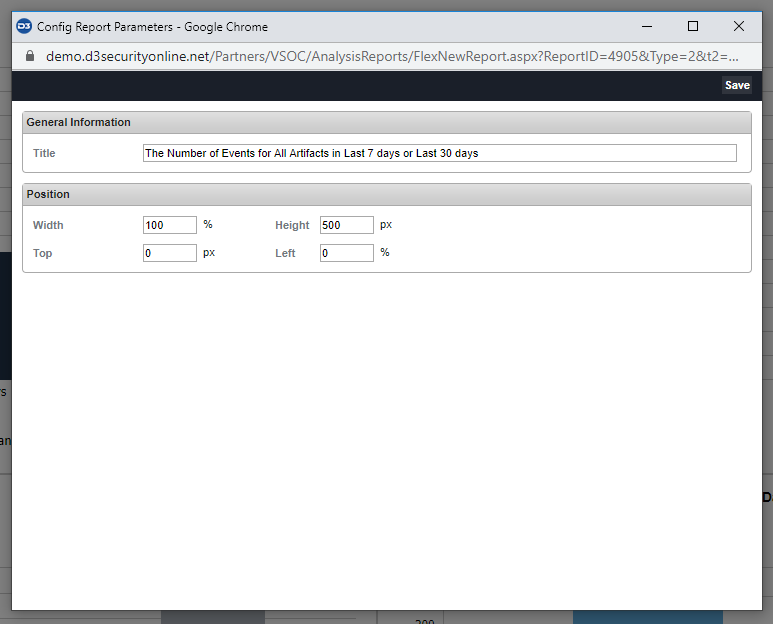
You can modify the Parameters of the selected report. Parameters include settings such as: Title, Position, Date/Time Range, and Site. To configure a report's Parameters:
Click on the Menu icon on the top left corner of the report to modify.
From the More Options menu, click on Config. Result: The Config Report Parameters window appears.
Update the report's Parameters such as setting report position, width and height and changing data/time and site filters.
Note: Alternatively, to resize a report simply click the bottom right corner and drag the red frame to the desired size.Click Save. The updated version of the report is generated on the Reporting and Analytics Dashboard.
Formatting, Layout and Field Options for Reports
Formatting options include setting table cell formats or conditional formatting, setting layout options and editing field data.
To format table cells or apply conditional formatting to specific data values:
Click the Menu icon on the top-left corner of the report.
Click on Format.
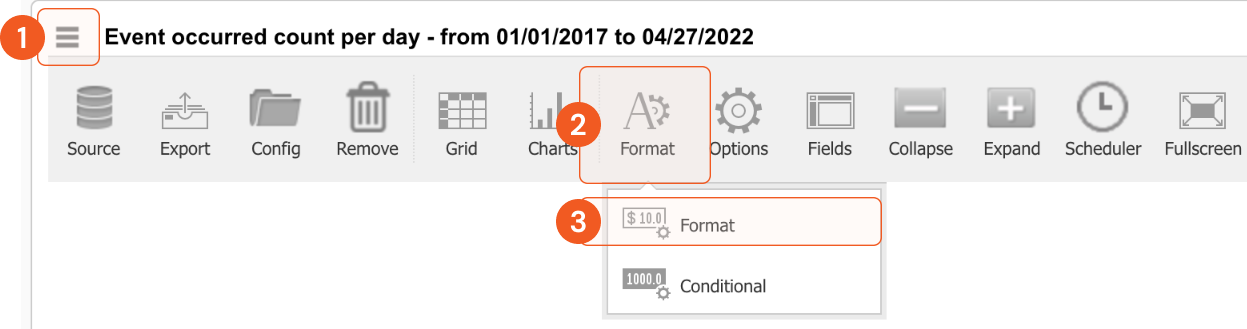
When Formatting Cells, select the cell value to format and set alignment, decimals and separators and currency for that value.
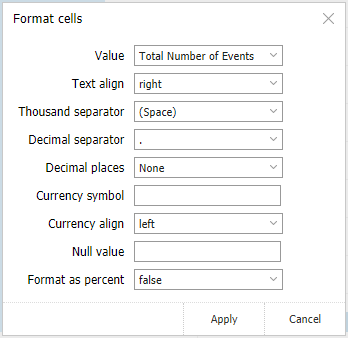
Use Conditional Formatting to set the text size and text/highlighting colors for information meeting specific conditions.
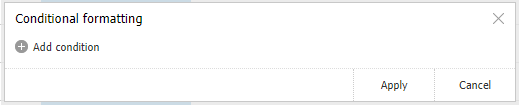
Click Apply.
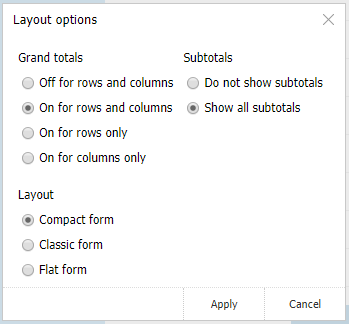
Changing the layout of a report
Click on the Menu icon on the top-left corner of the report.
Click Options.
Select the options for displaying totals and subtotals in the report.
Click Apply.
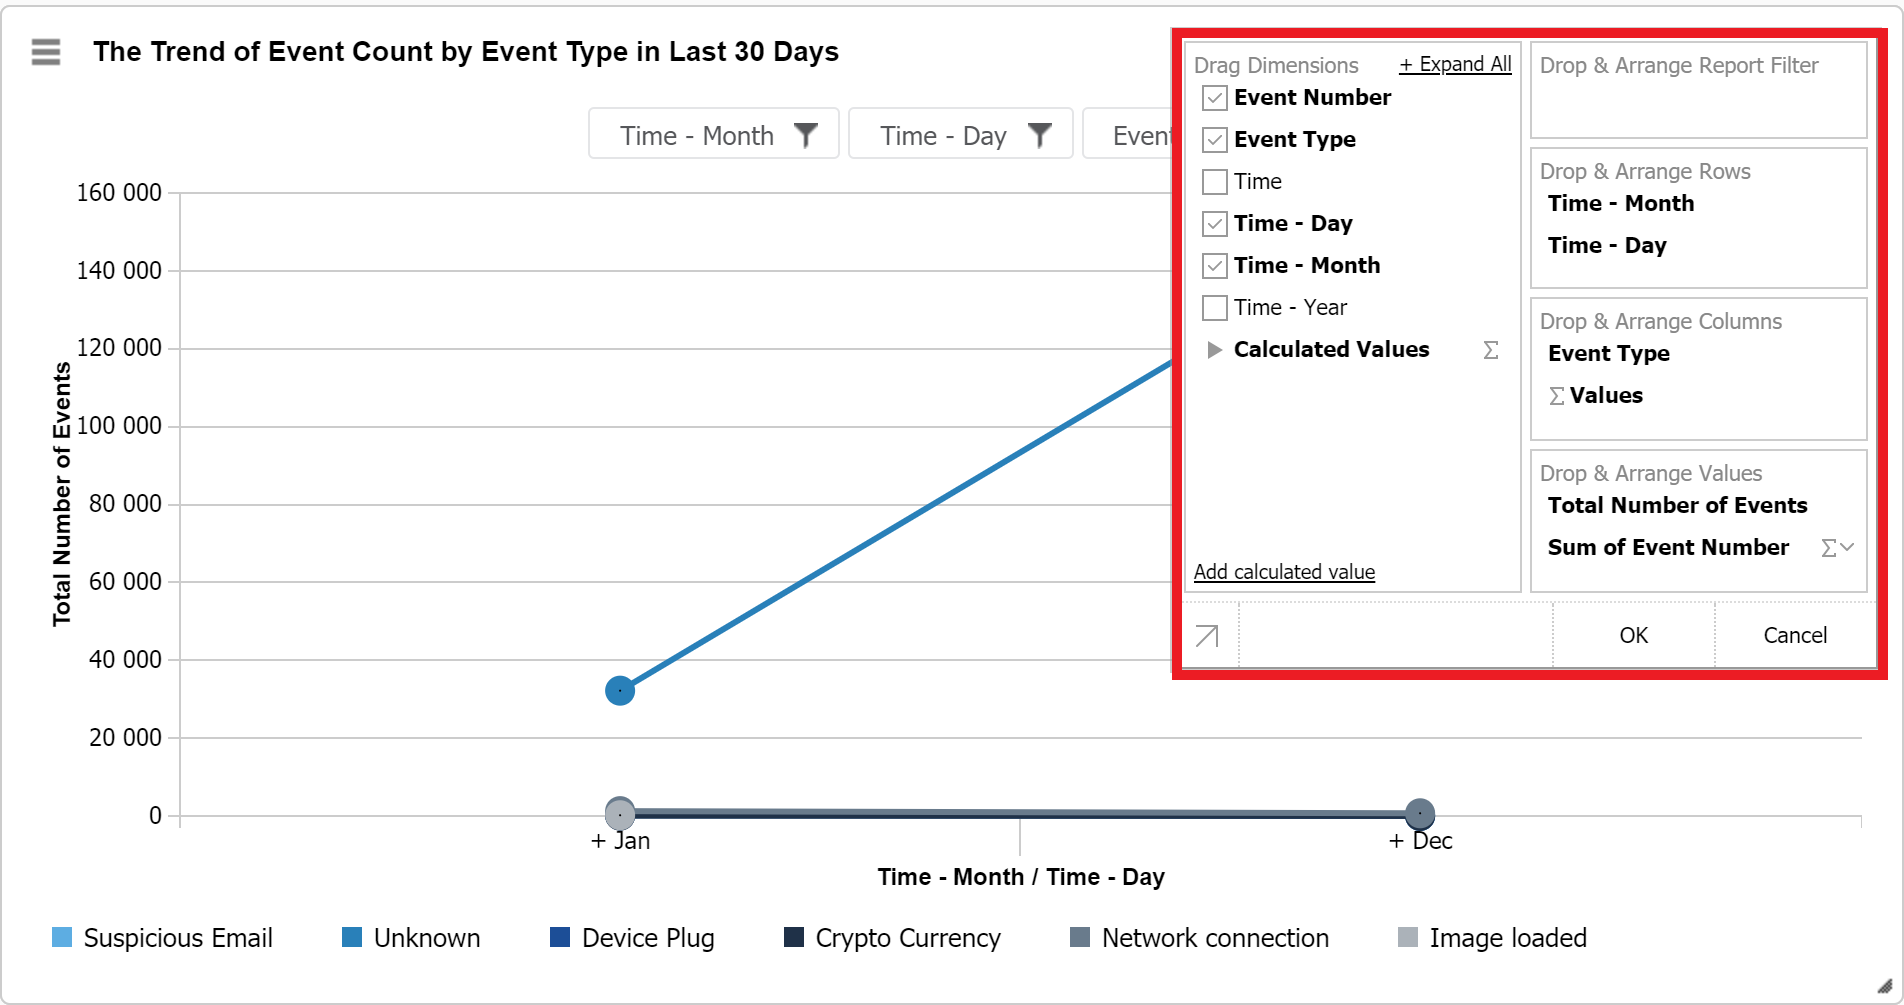
Configuring Report Fields
To configure report columns
Click on the arrow at the top-right corner of the report. The Select & Arrange Columns window expands.
Reader Note
This window can also be accessed by selecting the Fields option after clicking on the Report’s menu icon.
Click to select the columns to display on the dashboard.
For Pivot View Charts: In the right-hand pane of the Select & Arrange Columns window, drag and drop column names to specify filters and arrangements.
Once you’re finished with selecting and arranging columns, click OK.
Result
The Select & Arrange Columns window collapses, and the report displays according to the configured settings.
Reader Note
When an Incident report source is selected, you have the option to select dynamic form elements as the fields in the report. You must first configure these IR items in the Admin Settings Web Config Keys. Refer to the Application Settings for further information.
Report Notifications
With Report Notifications, you can automatically send individual reports from a dashboard to specified recipients by email. Notifications may be sent immediately or scheduled on a recurring basis.
Send or schedule a report notification
Select a dashboard you want to view.
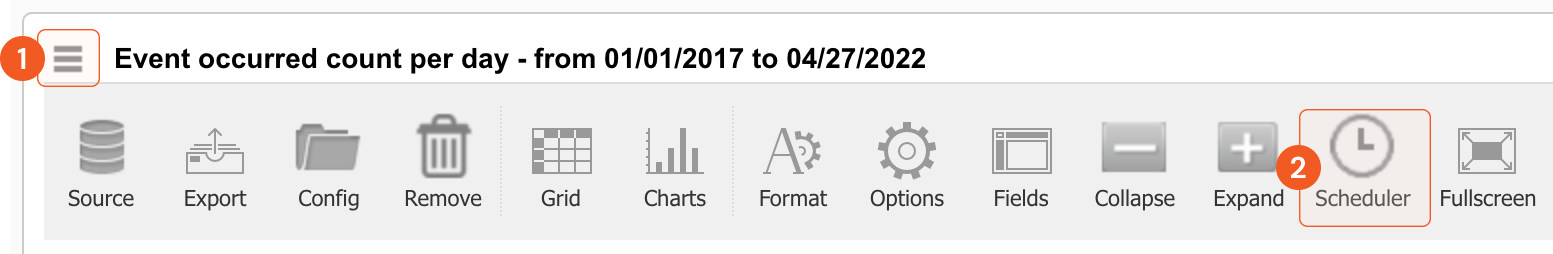
Click the Menu icon in the top-left corner of the report and click Scheduler.
Reader Note
From the Notification Schedules window, you may add or remove notifications.
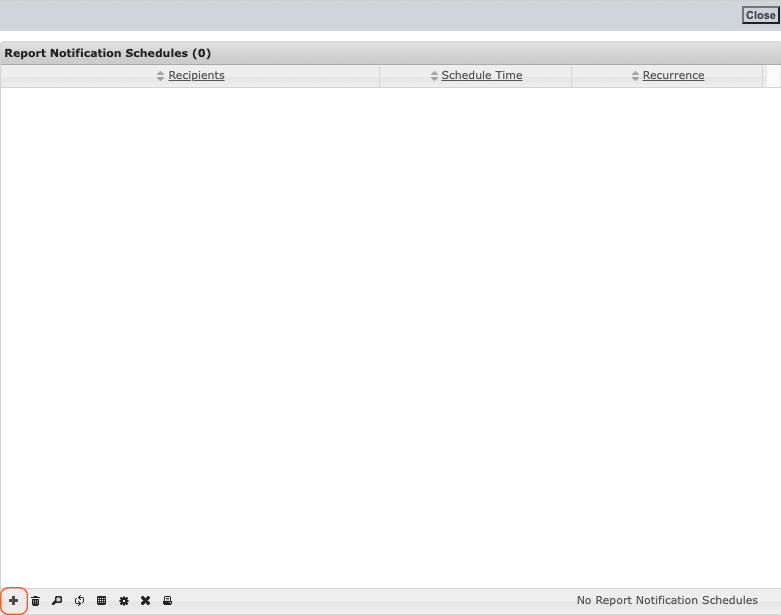
To add a new notification, click the + icon in the bottom-left corner of the screen.
To send the notification immediately, click Send.

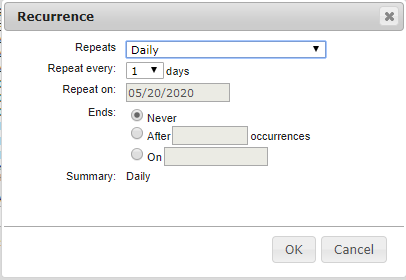
To add scheduled recurring notifications, check the Recurrence box and enter recurrence details.
Click OK to return to the main notifications window.
Click Send to activate the scheduled notifications.
Remove an existing report notification:
From the Notification Schedules window, select a notification to remove.
Click the trashcan icon in the bottom-left corner.
Click OK when prompted to confirm the removal.