Integrations
The Integration module within D3’s SOAR connects the Playbook Engine to various external systems in order to exchange data or take Command actions. D3 SOAR offers hundreds of out-of-the-box Integrations that covers the most commonly used tools in domains such as Security, IT, DevOps, Support, and more.
You can also configure custom Integrations with the Codeless Playbook Editor, REST API Request Method, and Code Editor (For Python and SQL). Each Integration defines how to connect to and how to take various Commands on external systems.
Integration Types
D3 SOAR offers two types of Integrations which are:
System Integrations: These are the 300+ built-in Integrations available on D3 SOAR that covers the most commonly used tools in domains such as Security, IT, DevOps, Support, and more.
Custom Integrations: You can create your own custom Integrations to fit your needs using the Codeless Playbook, REST API Request Method, or Python implementation methods.
Anatomy of an Integration
Connection Parameters
A Connection is the relationship between the D3 SOAR system and a third-party application. In this section, you can select and configure the types of Connection Parameters you would like to save. You can configure what parameters are required for an Integration Connection, and predefine parameter sets to speed up the creation of parameters.
You can click on the New Connection Parameter button in the Integration details page to add a parameter from one of these three groups:
Custom Connection Parameters
These are singular parameters that you can define for each Integration. You can set your own field name, display name, display order, and field type for each parameter.
The Command parameters required to be created would be parameters such as Server URL, Username, Password, API Key, Version, and proxy.Database Specific Connection Parameter Sets
MS SQL, Oracle, MySQL, and ODBC parameters have been predefined to simplify connection configuration for the most popular databases.
REST API Connection Parameter Set – The key parameters to establish a REST API connection are pre-defined as a parameter set to speed up the creation of the parameters.
Screenshot of the Connection Parameters area
Reader Note
Connection Parameters are predefined by D3 SOAR for System Integrations. You can skip this step for System Integrations unless there are additional parameters you wish to add.
Adding Connection Parameters
In order for your Integration to work, you have to set up a Connection. You can create one in the Integrations module, or in the Connections module.
The first step of setting up a custom Integration is to configure the Connection Parameters required for the Integration connection. You have to add one of: Custom Parameter or a predefined Parameter Set.
Adding a Custom parameter
Click on the + New Connection Parameter → Add Custom Connection Parameter
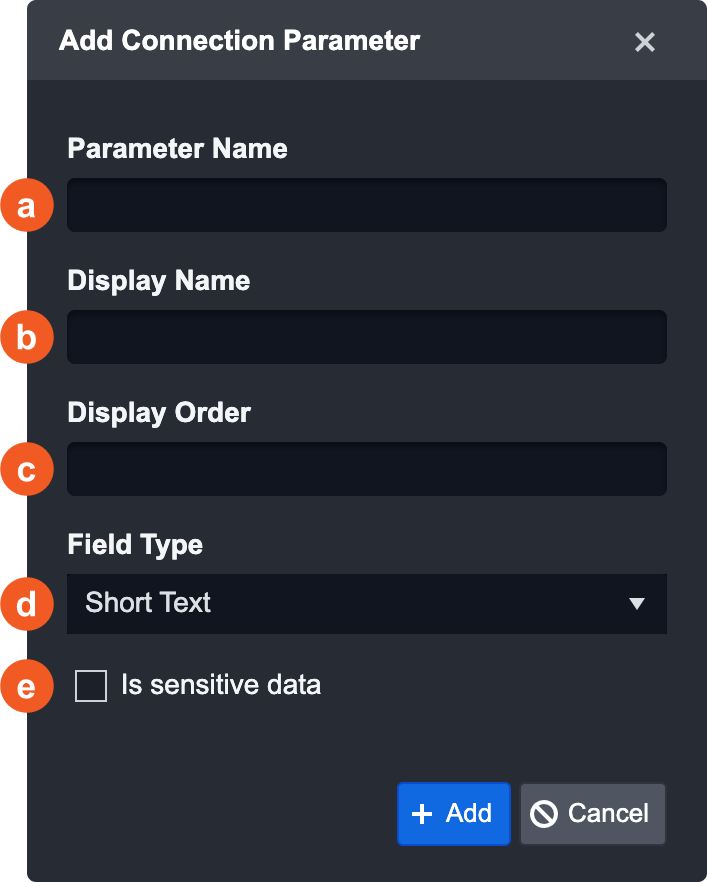
The Add Connection Parameter pop-up will appear with the following fields:
Parameter Name: Provide the name to be used for the parameter. This is the system name.
Display Name: Provide a reader-friendly name that’ll appear in the front end. If this field is left empty, the Parameter Name will be used.
Display Order: Set the order in which this field should show up in the Connection Parameters table.
Field Type: Define what type of data this parameter will be.
Is sensitive data: By default, inputs are shown in plain text. If the field contains sensitive data, check this checkbox for the input to be obscured as ******.
Click on the + Add button.
Result: The Connection Parameter will appear as shown in the screenshot below:

Adding a Predefined Connection Parameter Set
D3 SOAR offers 5 predefined parameter sets to speed up the creation of parameters. These consist of: REST API, MS SQL, Oracle, MySQL, and ODBC parameters sets.
Click on the + New Connection Parameter and select the REST API Connection Parameter Set.
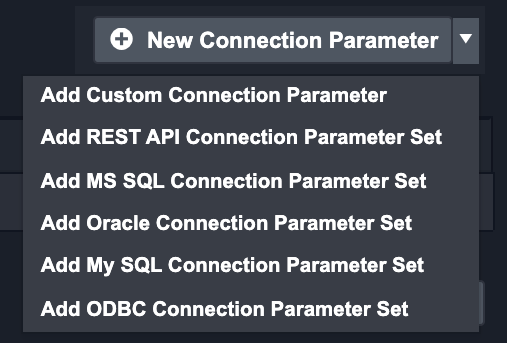
Result: The REST API Connection Parameter Set will appear in the table below.
Reader Note
The REST API Connection Parameter Set automatically fills the two parameters. If the fields Proxy Security Token and Proxy Allowed IPs are required, add a parameter named proxy.
Connections
Once the Connections Parameters are properly configured, Integration Connections can be added. D3 SOAR allows multiple Connections to be edited in or added to an Integration. This ensures greater flexibility and control over any customization and updates required in the future. The architecture is simplistic and scalable for ease of deployment.
Adding a Connection
You will only have to add the Connection Details to begin using a system Integration. The following example shows the default configuration for a Splunk connection:
Search and select the desired Integration in the Integration list.
Click on the + New Connection button.
The New Connection pop-up window will appear the following fields:
Connection Name
Sites: Set which Site can use this Connection.
Agent Name (Optional): select the Proxy Agent that you have set up previously
Description (Optional): add a description of how this Connection should be used
Tenant: enable to share this connection with tenant sites
Active: ensure this checkbox is selected so that the Connection is available for use
System: this section contains the parameters that have been predefined by D3 Security specifically for this Integration. These are the credentials you must fill in order to establish the connection.
Connection Health Check: check this box to configure a recurring health check on this Connection
Enable Password Vault: select the password vault connection you have set up
Test Connection: click this to verify the account credentials and network connection. Sometimes a Connection failure may indicate that there’s no network connection between D3 SOAR and the third-party tool. Check your credentials to make sure they are correct and try again.
Note: The latest Test Connection results will display within this window for referenceClone Connection to Site: Select which Sites this Connection should be cloned to
User Permission: configure who has access to this Connection
Reader Note
Integration Connections can either be shared with all sites or be site-specific. If a specific site is selected, that connection will only be used for the selected site. If Shared to all sites is selected, then it will be shared with all sites that do not have the connection.
Agent Name
The Agent Name contains the information of the Proxy Security Token and Proxy Allowed IPs fields. This field will dynamically appear if there is a parameter named proxy configured or if the REST API Connection Parameter Set is added.
Please refer to the Agent Management document to learn about the structure and configuration of an Agent.
User Permissions
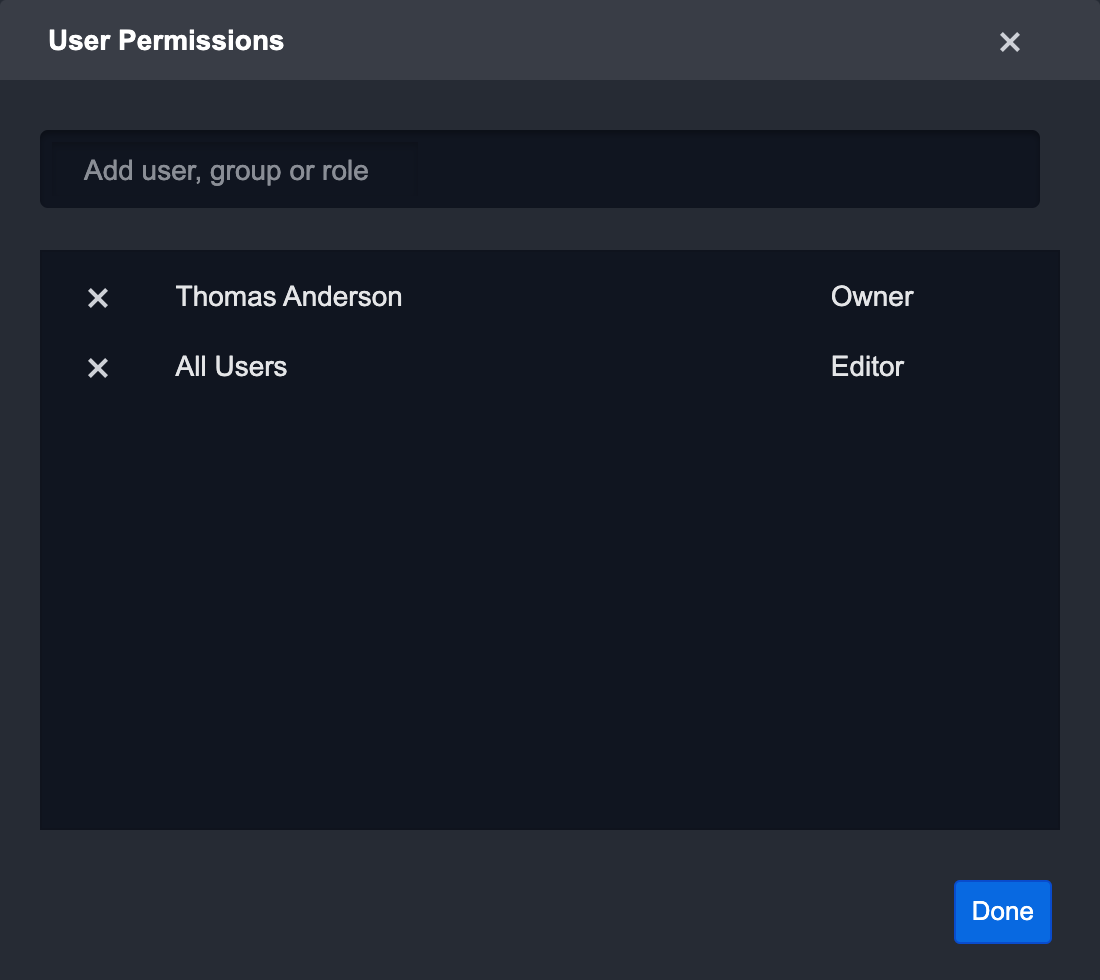
You can define who can edit or have access to a connection. By default, you (the creator of the connection) will be marked as the owner. You can give permissions to other Users/Group/Roles to be a Viewer, Editor, or Owner role. This can be done by using the dropdown or searching for a user, group or role. Below are the permissions granted for each role:
Permission | Viewer | Editor | Owner |
|---|---|---|---|
View connection details |  |  |  |
Use connection in Incident Response modules |  |  |  |
Set as a connection as the default for an Command |  |  |  |
Edit connection details |  |  | |
Change the user permissions |  | ||
Clone connection |  |
Reader Note
There must be at least one owner for each connection. The last owner cannot be deleted or reassigned to viewer/editor.
Commands
Commands refer to the functions that can be performed for a particular Integration. For system integrations, most of the common commands are predefined by D3 Security. These Commands are read-only; the implementation is not user editable. However, you can create additional commands for your system integration where you can access and edit the command code.
For Custom Integrations, there are no predefined commands — this means you will have to create your own commands. When adding a command, the user has two options: System Commands or Custom Commands, these are templates for creating a command.
System Commands
System Commands provide a basic template with special attributes (e.g. Field Mapping for Event Intake) that are pre-configured by D3 Security to ensure the selected Command can work as intended. The table below summarizes the seven predefined system Commands available and their usages:
System Commands | Usage |
|---|---|
Event Intake | Ingests event data from external data sources into the system. |
Incident Intake | Ingests incident data from external data sources into the D3 system. |
checkIPReputation | Enriches the IP artifact with reputation details. |
checkUrlReputation | Enriches the URL artifact with reputation details. |
checkFileReputation | Enriches the File artifact with reputation details. |
OnDismissEvent | The Command will be triggered and run when an event has been dismissed. |
OnEscalateEvent | The Command will be triggered and run when an event has been escalated. |
TestConnection | Check the health status of an Integration connection. |
System Commands - Specific Configurations
For all System Commands (except for Event Intake and Incident Intake), the configuration process is the same as creating a Custom Command. Some key differences to note however, include:
The Commands have no manual input. This means you can only select the following options under the features section - Command Task, Ad-Hoc Command, and Allow command to be run on agent.
Reader Note
Allow command to be run on agent is only available for Commands with Python implementation
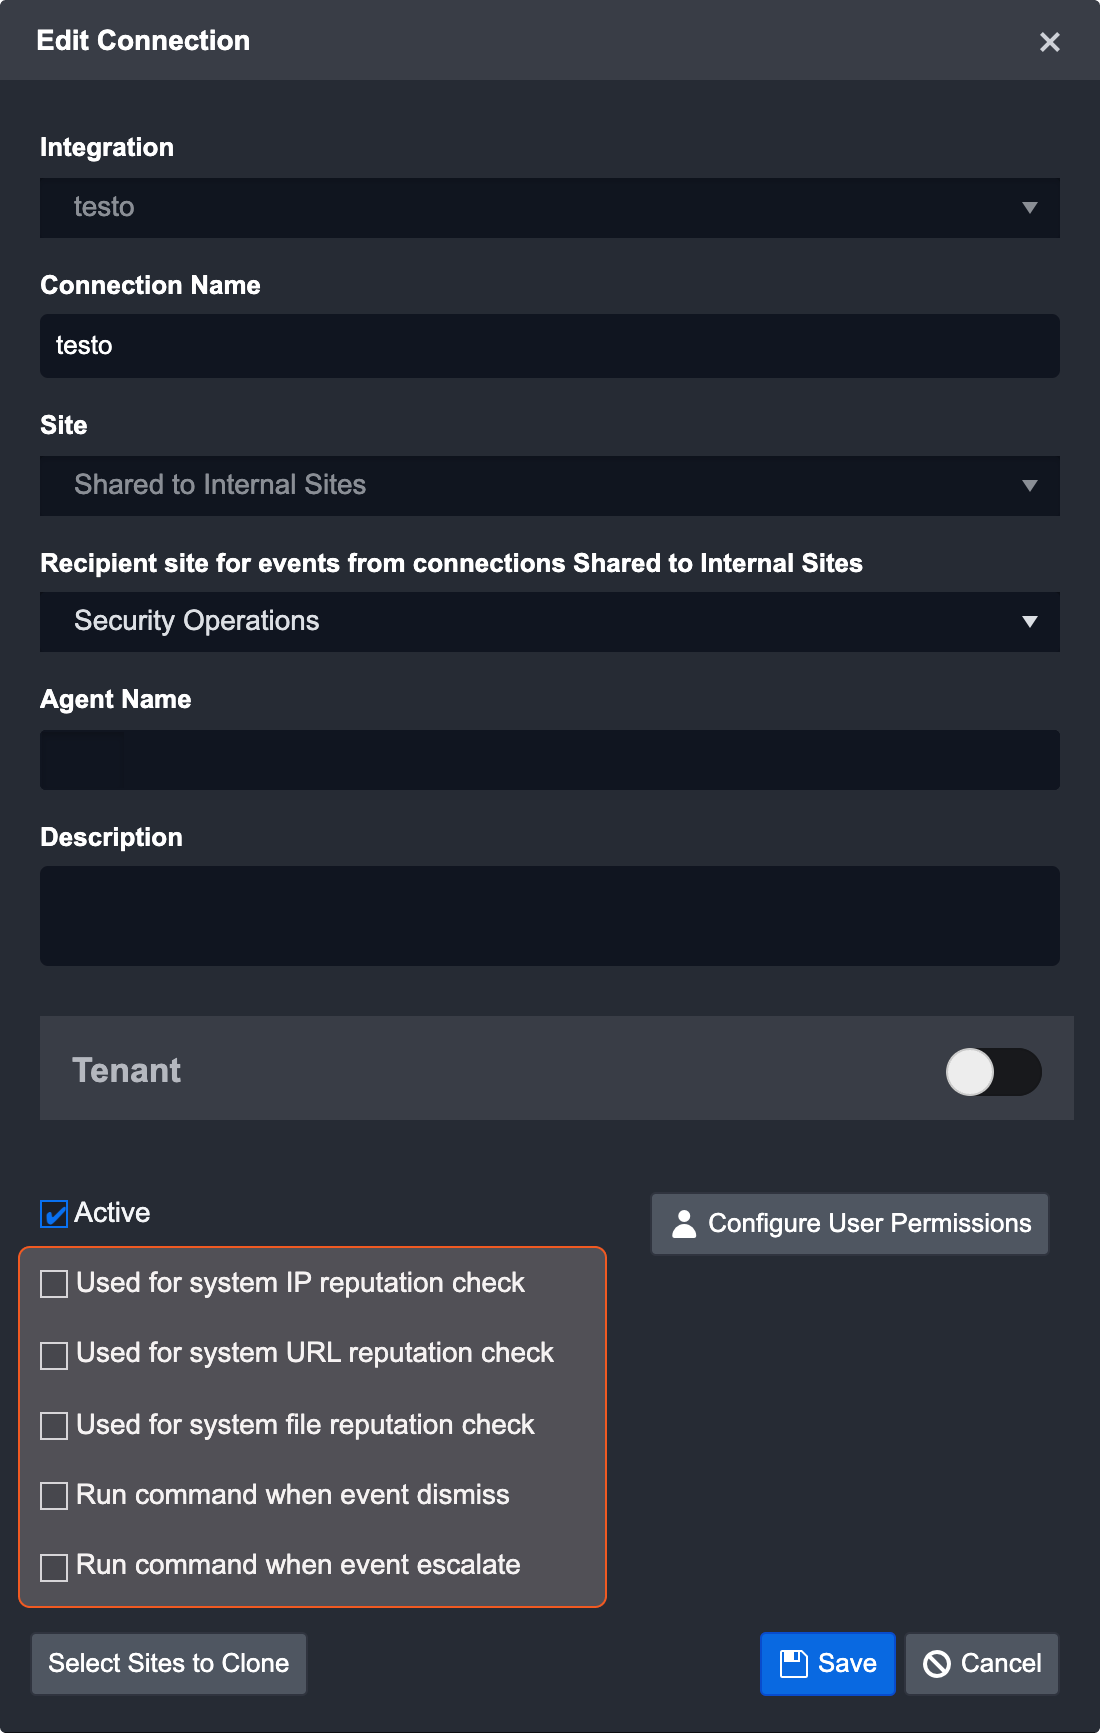
For all system commands added (except for Event Intake and Incident Intake), you will have to explicitly enable the functionality for each connection. The relevant checkbox will be added dynamically based on the System Commands that have been added for that particular Integration when creating or editing its Connection.
Custom Commands
To build a Custom Command, you will need to configure the entire Command from scratch (ie, you will not be provided with any special attributes contained in System Command options). You have unlimited flexibility on implementing this Command with the Codeless Playbook, Python, REST API, or Database specific implementation options.
Components of a Command
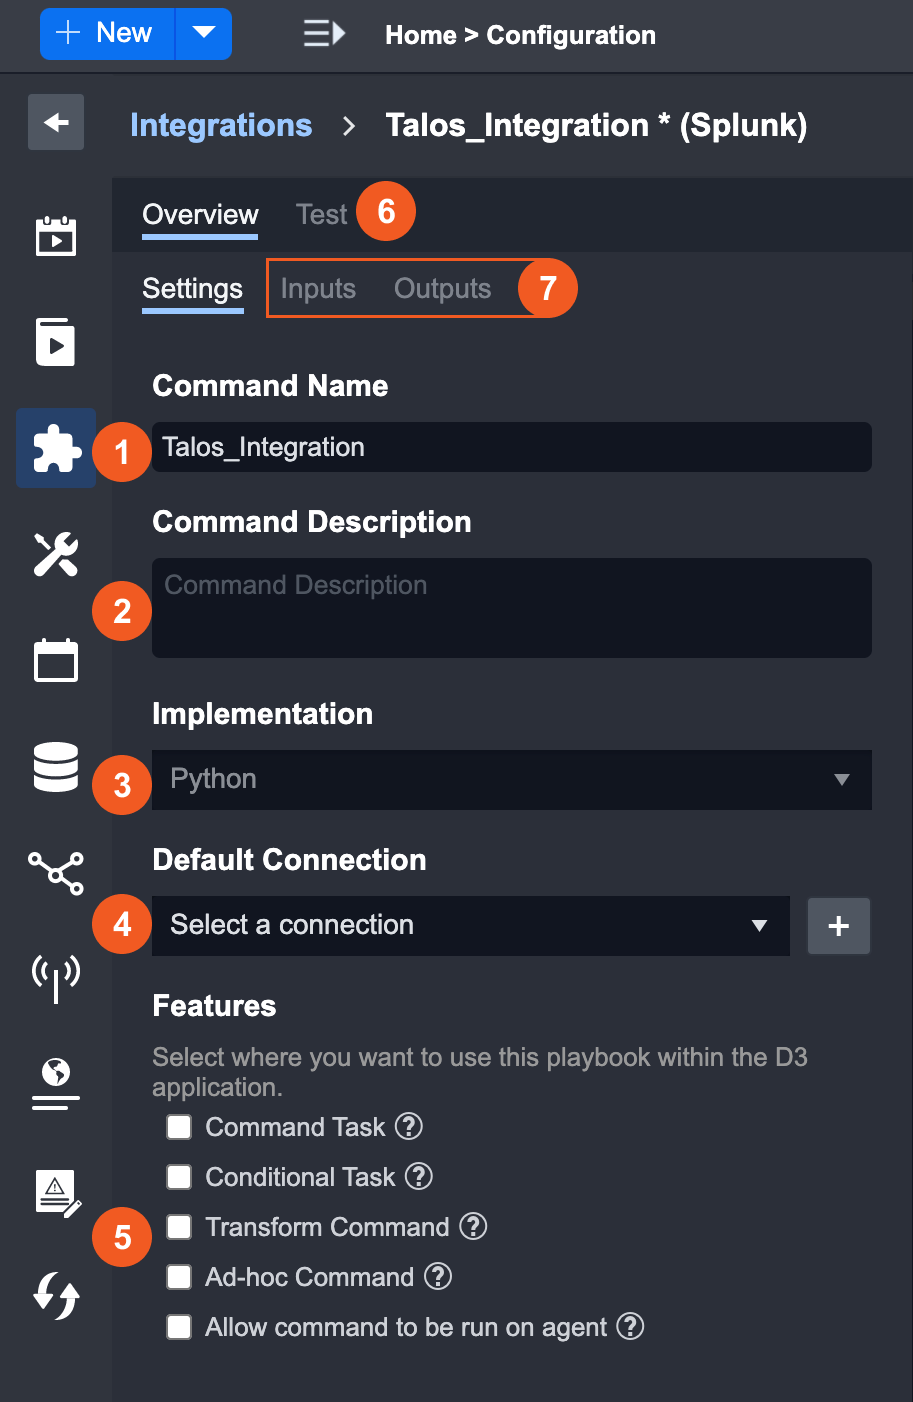
A Custom Integration Command settings contains the following sections:
Command Name - Edit the Command name
Command Description - Edit the Command description
Implementation - The implementation method you chose for this Command. You cannot change the implementation method once you have created the Command.
Default Connection - Specify the connection information that you would like to use for this command. By selecting a default, you will not need to repeatedly select a connection during Playbook configurations and when running the Commands. You can also create a new connection with the + button if needed.
Features - Choose where the Command will be available for use within the D3 application.
Test - Enter Input Parameters to see what the Outputs will be for a specific Command.
Reader Note
For Commands with Codeless Playbook implementation method, this tab will be named “New Task”.
Input/Output - Configure the Input and Output parameters of the Command
Adding a Custom Command
A Custom Command is created with the following steps:
Implementation
Test
Configure
Schedule (Optional)
Step 1: Implementation
On the Integration page, click the + New Command button. Type in a Command name and choose the implementation method.
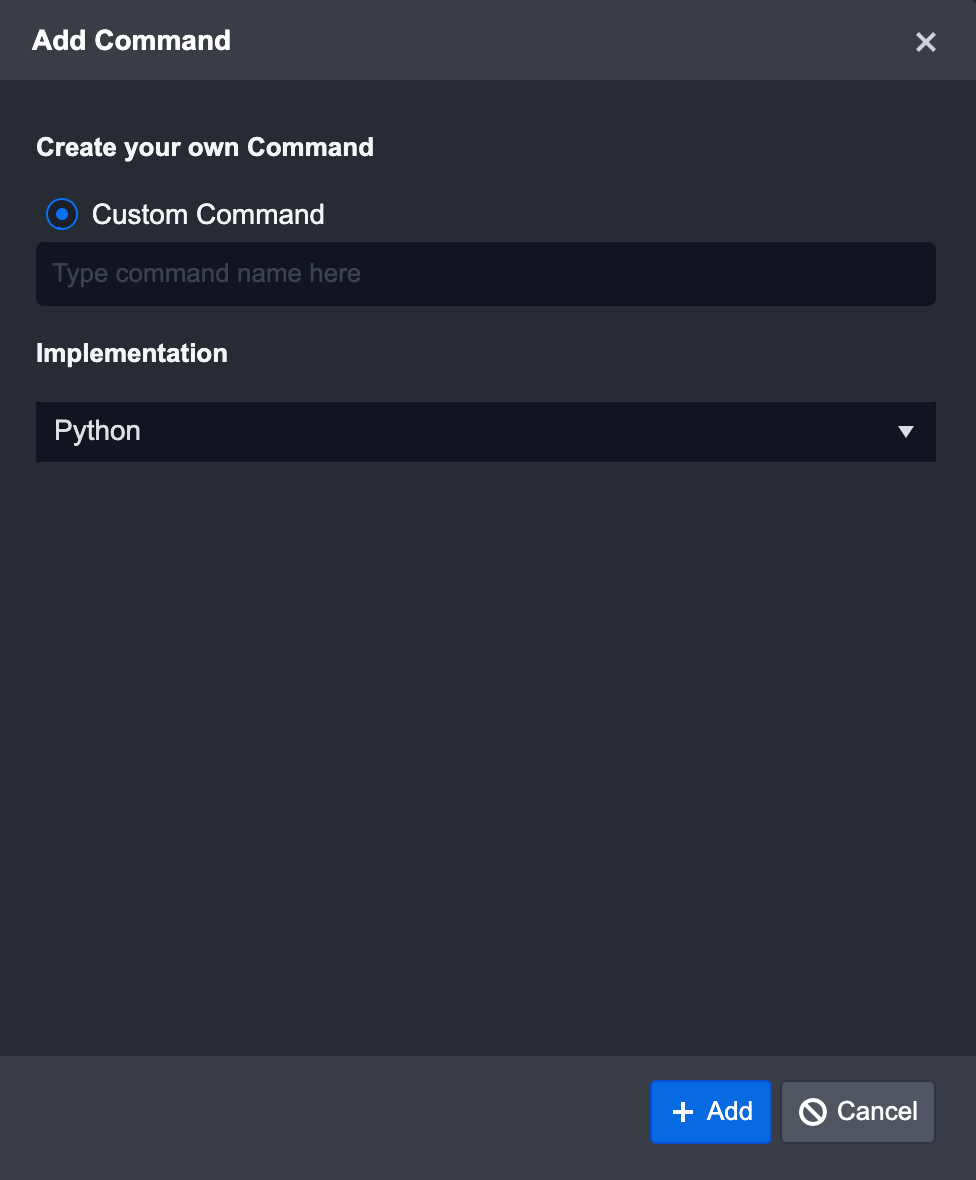
D3 SOAR offers various implementation methods for all Integration Commands. This consists of the following options: Codeless Playbook, Python by default, or REST API, MS SQL, Oracle, My SQL, ODBC based on connection parameters. Refer to the following section for a detailed description of each method.
Click on the + Add button to create the custom Command.
Reader Note
D3 Security recommends providing a clear description of the Command in order for the end user to better understand what the Command is used for.
Codeless Playbook
D3’s Codeless Playbook implementation method allows SOC Engineers to set up custom Integrations Commands without writing any code. The Codeless Playbook Editor that appears on the screen is composed of four key sections:
The Action Bar contains breadcrumbs and Playbook features like Submit, Publish, and More Actions
Command Details sidebar displays all the configurable information about this Command. It also contains the New Task and Input/Output tabs. In their respective tabs, you can add new Tasks to the Playbook or define the values that are required for the Input/Output of this Command.
The Main Editor allows you to create and test a Playbook workflow for this Command. Please refer to the Playbook documentation for more information.
The Task Editor panel houses all the information based on which Task you have selected in the Playbook. You can configure details of a Task such as Task Name, Input, Assigned To, etc
Python/SQL
D3 SOAR supports SOC Engineers who wish to build more advanced Integrations with customized database scripts. The Code Editor will be shown if the Python implementation method is selected. This editor is composed of four key sections:
The Action Bar contains breadcrumbs and Playbook features like Submit, Publish, and More Actions
The Main Editor provides an integrated development environment (IDE) for the SOC Engineer to write the code necessary for the Command to work. Please refer to the Python Coding Conventions to learn more about D3’s specific coding conventions.
Command Details sidebar displays all the configurable information about this Command. It also contains the Test and Input/Output tabs. In their respective tabs, you can test the Python script or define the values that are required for the Input/Output of this Command.
Database Implementation Methods
Database specific implementation methods (MS SQL, Oracle, MySQL and ODBC) are also available based on the connection parameter set added. The Code Editor (as seen in the image above) will be available so the user can write SQL Script for the method selected.
REST API
The REST API implementation method is available when the REST API parameter set is added.
Step 2: Test
You can click on the Test tab and use the Test Command feature to test out the design of the Command. For instance, you will be able to see the Input Parameters and Output Parameter mapped out thus far. Here, you can test and find possible bugs, identify possible connection issues and revise the input or output parameters when necessary.
Screenshot of a VirusTotal domain report scan
Step 3: Configure
There are two parts to configuring a Command. The first is the checkbox options under Features. This determines where the Command will be available for use within the system. For maximum accessibility, D3 recommends checking all options whenever possible to increase the number of places the Commands will be available. Please select at least one feature in order to use the Command (unless it’s only used based on a schedule).
Features | Usage |
|---|---|
Command Task | This Command can be used in the Playbook Command Task. |
Conditional Task | This Command can be used in the Playbook Conditional Task. |
Transform Command | This Command can be used for data transformations when configuring a codeless Playbook. This feature is only available for Commands that do not require any manual user. |
Ad-Hoc Command | This Command will be available in the Command line toolbar within the Incident Workspace. |
Allow command to be run on agent | When checked and agent(s) are specified in the connection, the command will be run on an agent. Please refer the Agent Configuration Scenarios section of the Agent Management document for detailed information. |
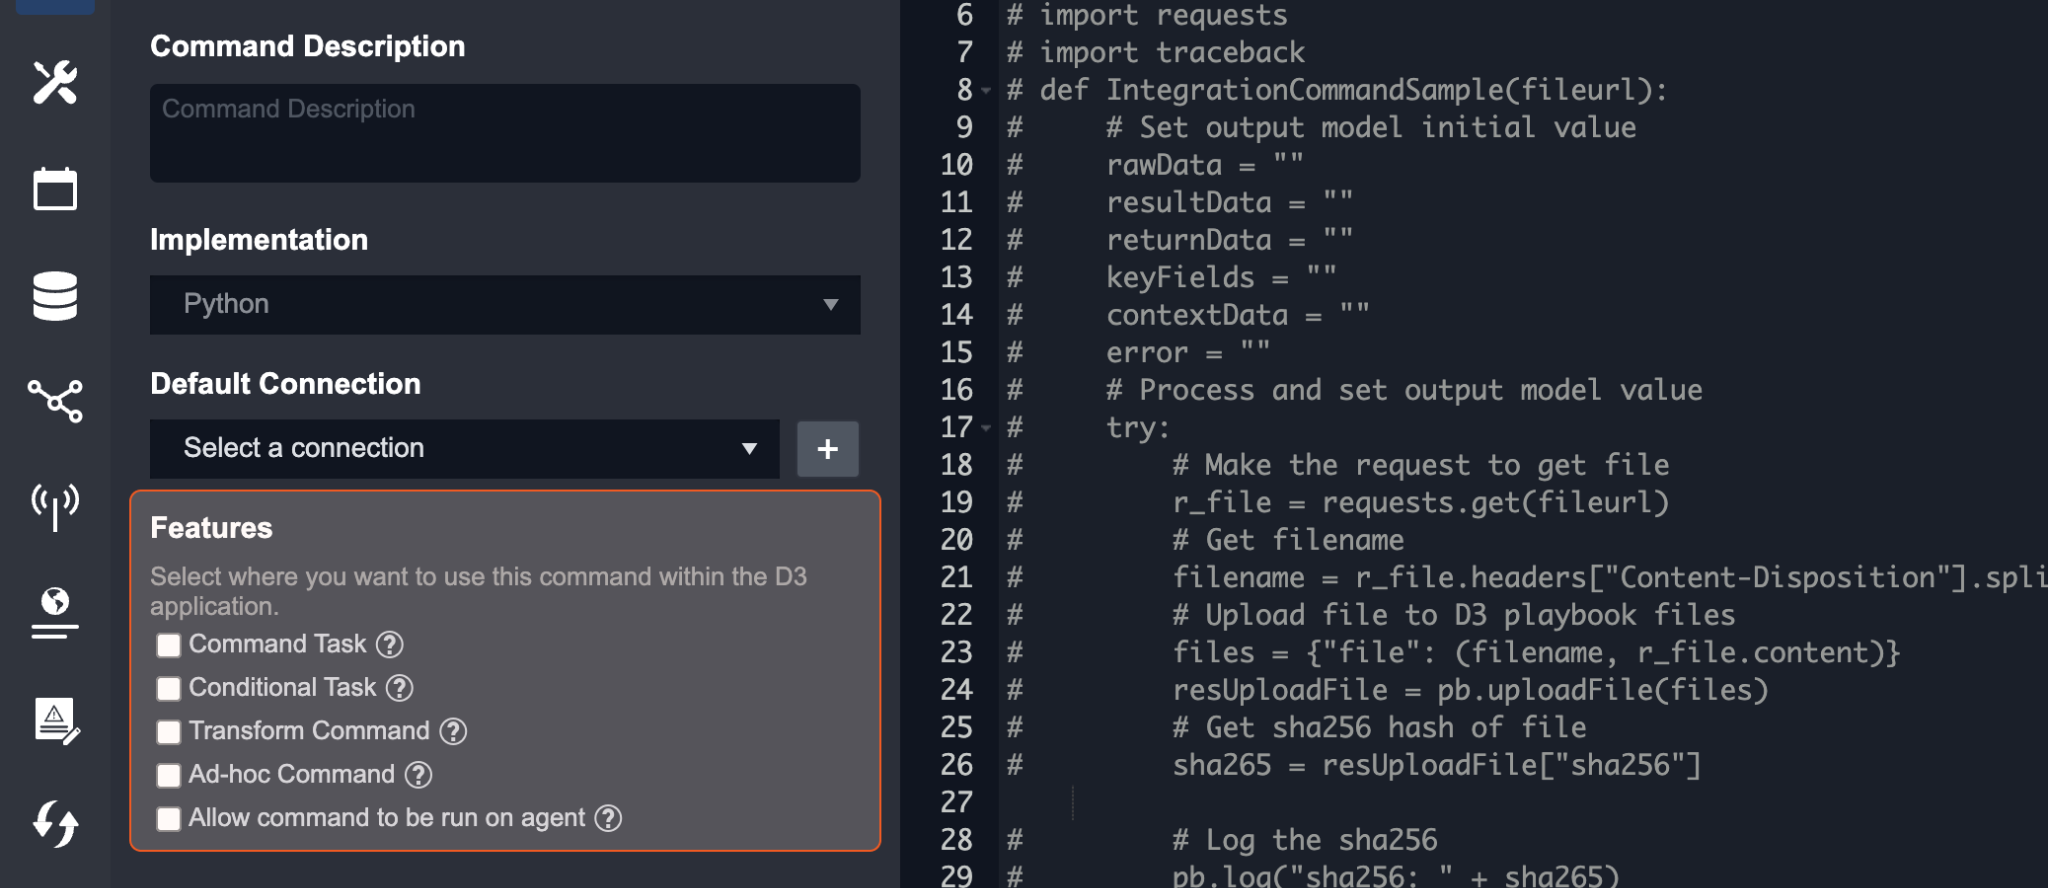
Note: For a visual example of the feature options, refer to Commands List and Common Usages.
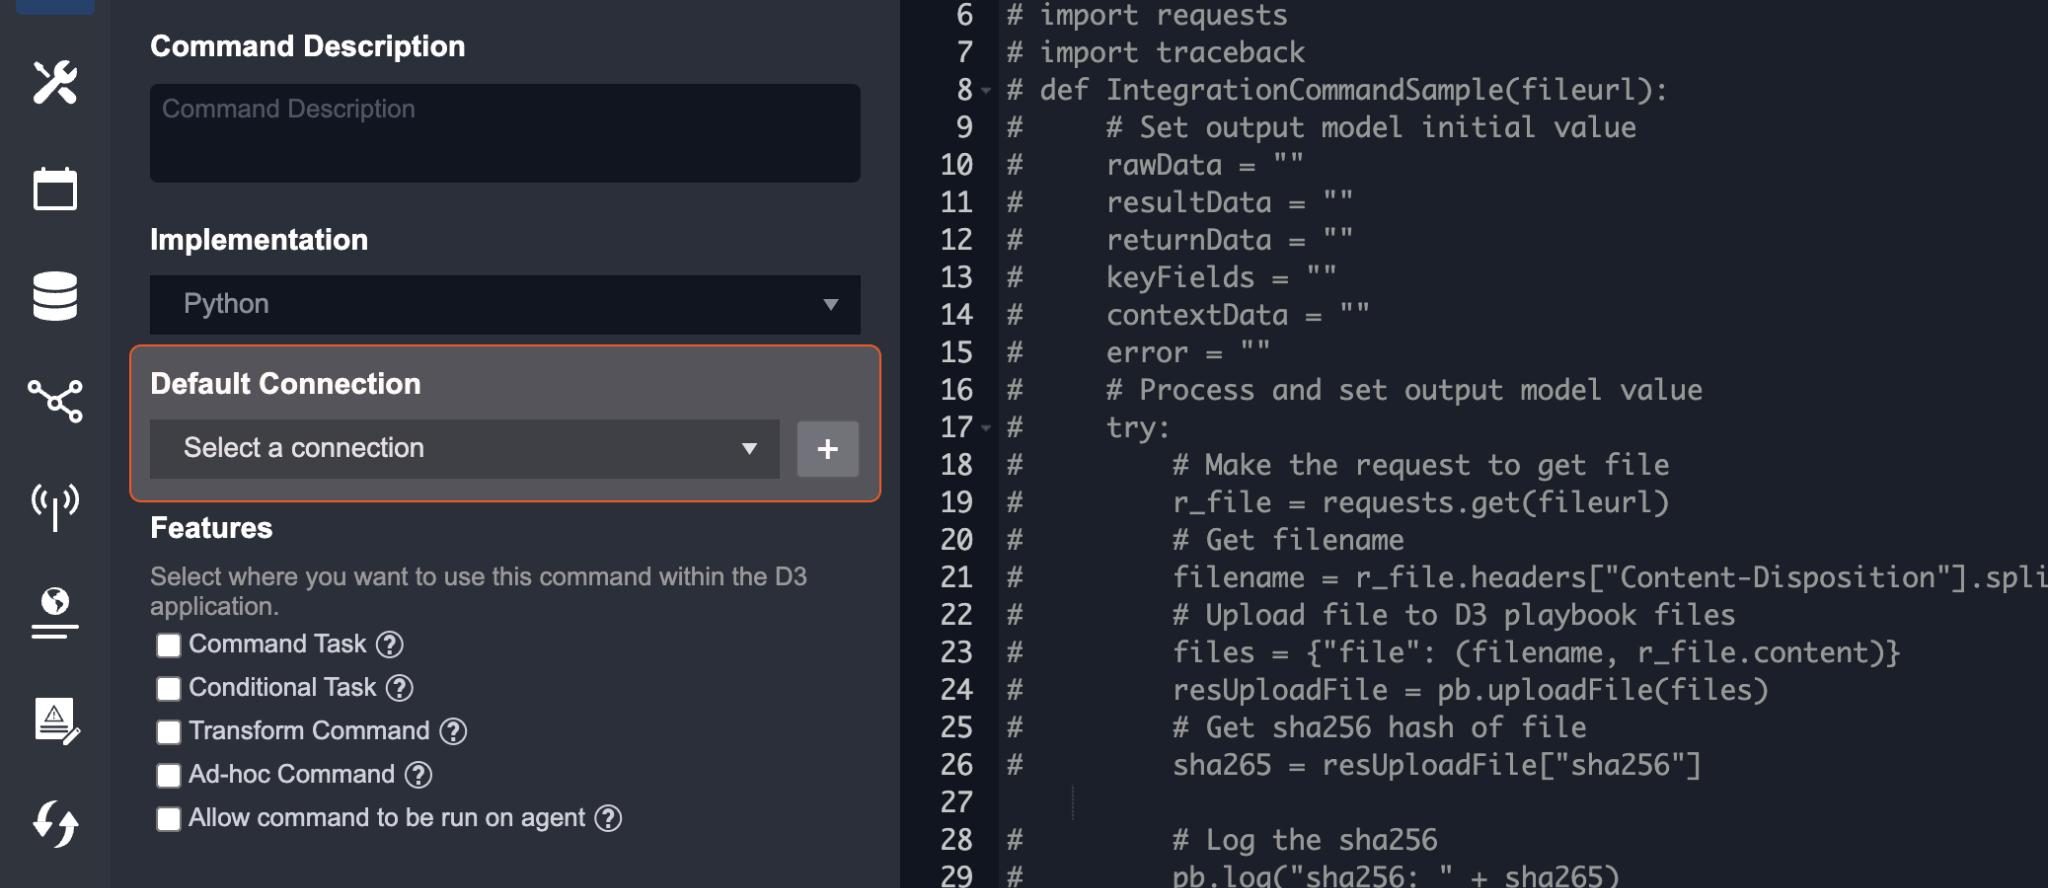
The third configuration is the Default Connection section. You can define what connection will be pre-selected when using this particular Command. By selecting a default, you will no longer need to repeatedly select a connection during playbook configurations and when running the Commands. If no connections have been added, click + New Connection to easily add a connection.
Step 4: Schedule Job (Optional)
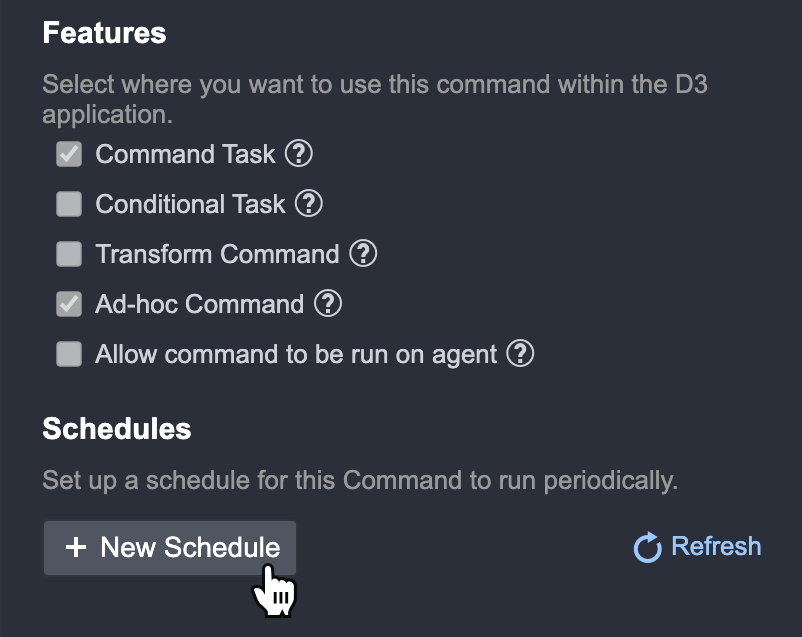
You can set specific time intervals and frequency for when to run the Command under the schedule job section. This is an optional field and its common usage is for events and incidents to be ingested periodically. You can only configure a schedule when the Command is Submitted (Live Mode). Follow the steps below to add a schedule:
Click + New Schedule
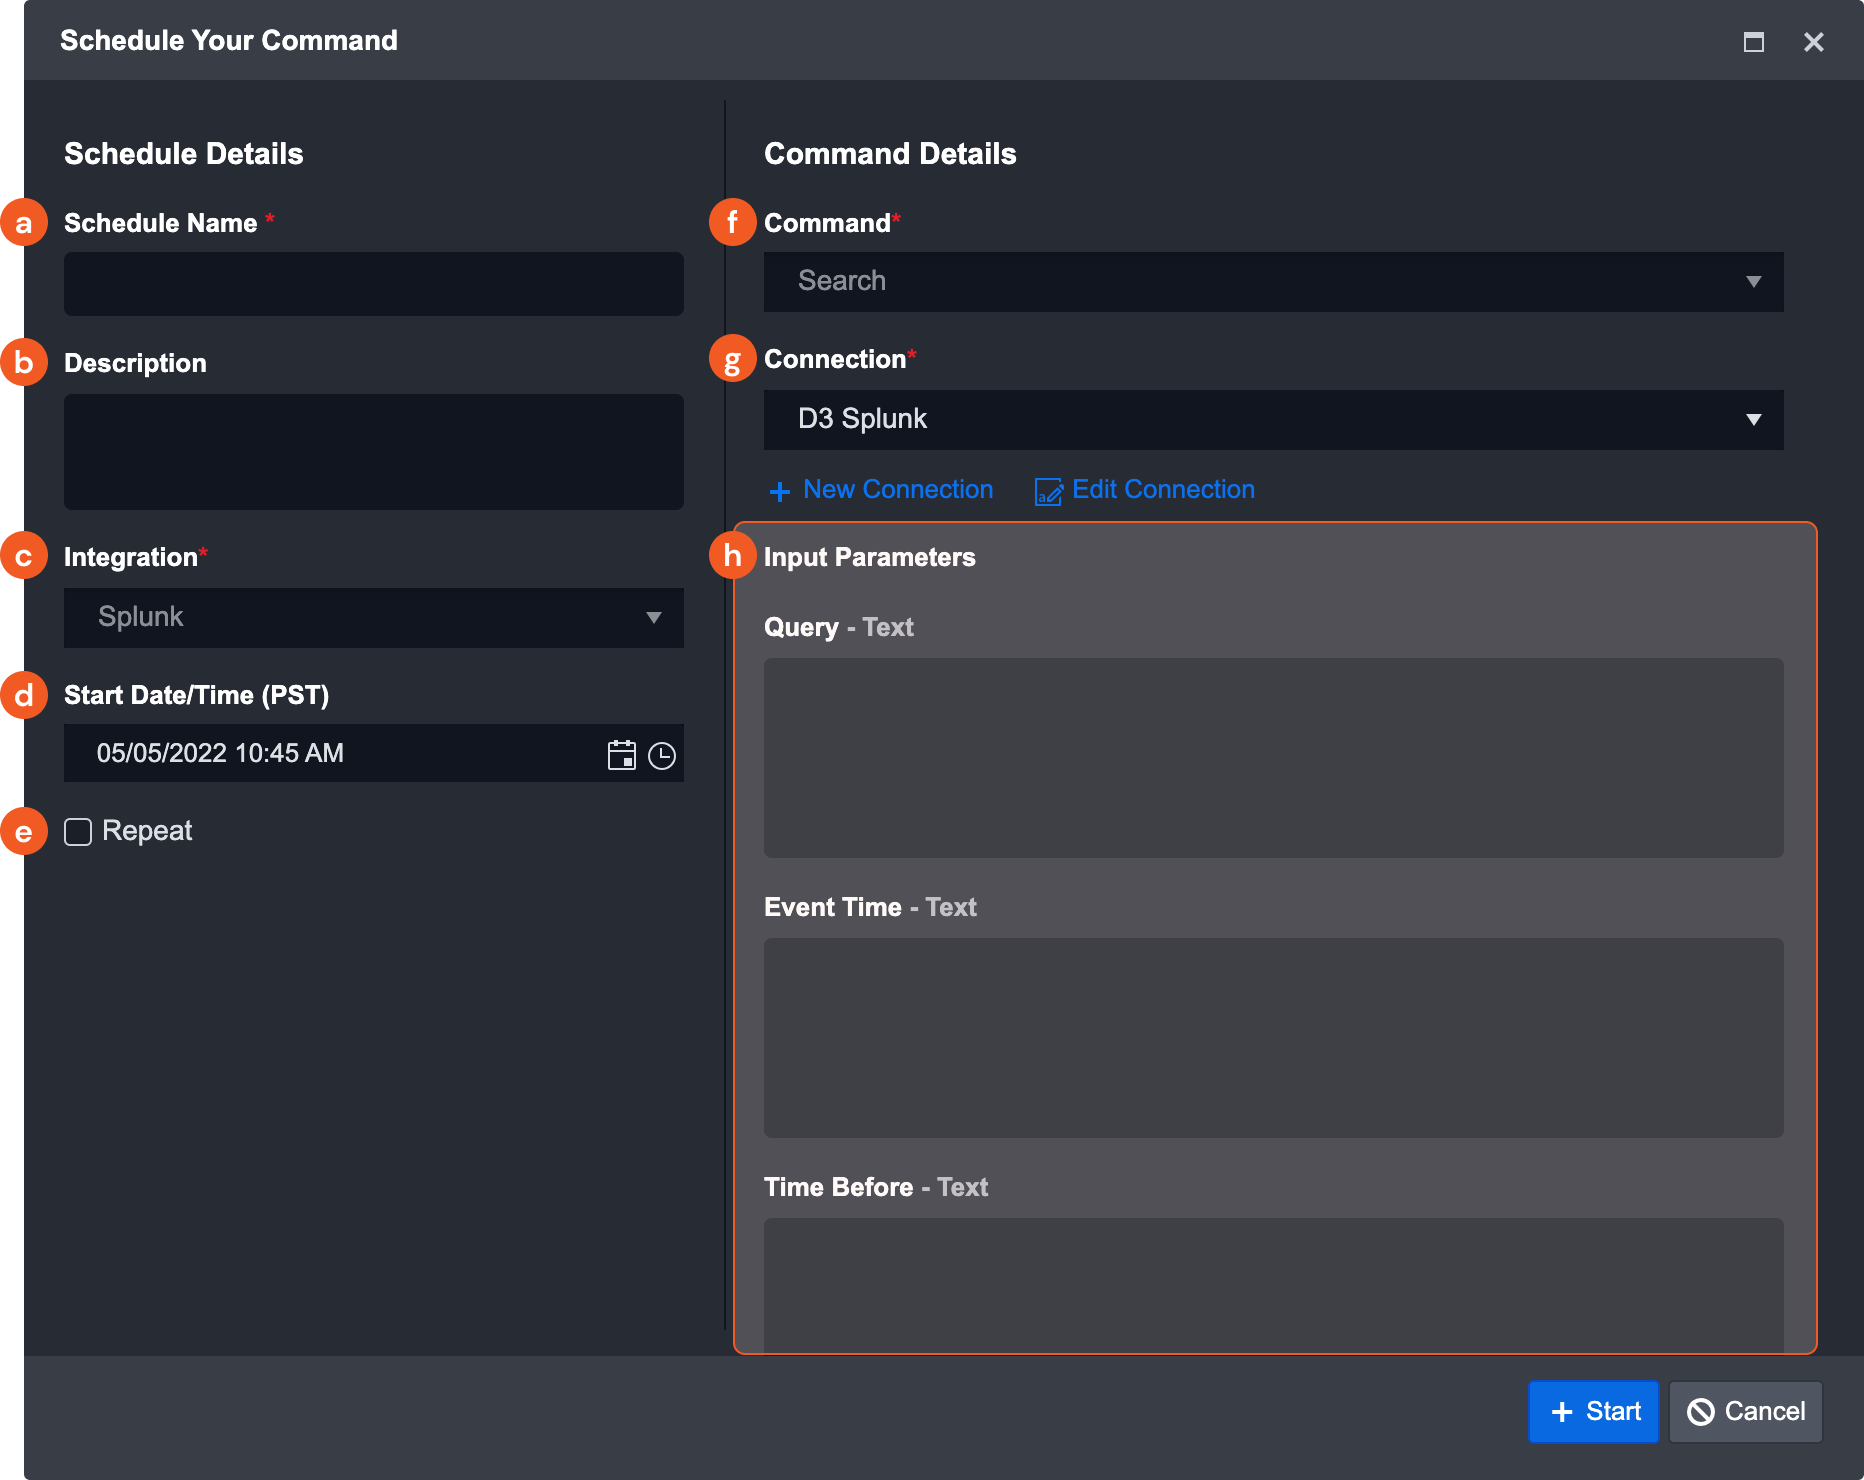
The Schedule Your Command pop-up window will appear. Enter the following details:
Schedule Name: Provide a clear name for this schedule
Description (Optional): Provide a clear summary of what the goal of this schedule is for.
Integration: Integration of the Command (read-only).
Start Date/Time (PST) Set the start date and time of the schedule.
Repeat: Select this checkbox to configure the recurring behavior of this schedule.
Command: The Command you are scheduling (read only).
Connection: Set what connection will be used for the job.
Input Parameters: The input parameter for this Command will be shown here. This will differ depending on the Command.
Click + Start
Configuring a System Command
For the purpose of this guide, we will illustrate the steps involved in configuring two common system Commands available: Event Intake and Incident Intake.
Ingestion Methods
The system can support three ingestion methods for event and incident intake Commands. This consists of: Fetch, Webhook, and File.
Fetch
The Fetch ingestion method allows the user to Pull in external events at predefined times intervals. The time and intervals are configurable and user-defined. Configuring a Fetch method is similar to configuring a Custom Command. The key difference are the following:
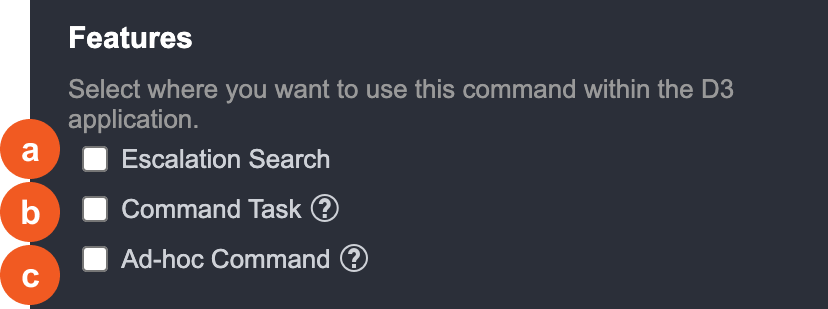
The Features section will only have the following options:
Escalation Search (Only available for Event Intake): This allows you to use this Integration’s fetch command within the Event and Incident Correlation tab.
Command Task: Allow this Command to be used in Playbook Command Task
Ad-Hoc Command: Allow this Command to be used as needed in the Incident workspace
Reader Note
The Schedule section and webhook will only be available if the Command is Live.
Webhooks
The Webhook ingestion method allows the Integration to send event or incident data (in JSON format) to be investigated in the system. This allows real-time, controlled event or incident data ingestion for SOC teams, and offers greater flexibility.
The following is a general how-to for setting an Event Ingestion webhook.
Reader Note
Incident ingestion in webhook will look and function similarly. We recommend referring to this how-to for setting up an incident intake command as well.
Find and select the desired integration command. Navigate to Configuration > Integration Commands > [Your Desired Fetch Event/Incident Integration Command]. If you are using a custom integration command, verify that it has been submitted.
Under Webhook Authentication, toggle on Remote Command. Select the desired authentication method.
Authentication Method: API Key
In the Setup API Keys window, you can select an existing key or generate a new one for authentication. Existing keys are listed based on the corresponding sites they are associated with. To generate a new key, click on the + button adjacent to ALL SITES, INTERNAL SITES, or CLIENT SITES depending on where you want the API key to be accessible.
If you are generating a new key, select a site and enter an alias for your key. The selectable sites are limited by which section you have clicked + in the previous step. Click Generate.
For detailed information about configuring the API key, refer to the Authentication Method: API Keys subsection under Event/Incident Intake in the Webhook Configuration Guide document.
Authentication Method: JSON Web Token (JWT)
In the Setup JWT window, you can select an existing key or generate a new one for authentication. Existing keys are listed based on the corresponding sites they are associated with. To generate a new key, click on the + button adjacent to ALL SITES, INTERNAL SITES, or CLIENT SITES depending on where you want the JWT to be accessible.
If you are generating a new key, select a site and enter an alias for your key. The selectable sites are limited by which section you have clicked + in the previous step. Click Generate.
For detailed information about configuring the JSON web token, refer to the Authentication Method: JWT subsection under Event/Incident Intake in the Webhook Configuration Guide document.
File
The File Ingestion method allows you to manually upload Event/Incident data into the system. The event/incident field mapping must be completed prior to the upload. For an incident file upload, you can optionally specify the event JSON path within the field mapping. If you do so, any events within the incident file will be created and linked to the incident after the upload.
The system currently supports files in JSON format only. Once the JSON file has been uploaded, you can select a Site and the created File Integration from the dropdown list.
When uploading an event or an incident with event(s), you have the option to assign an event playbook and/or data formatter to the ingested file. Additionally, you can configure to enable or disable the automatic mapping of ingested events from the data source to MITRE tactics and techniques and allow event automation rules to be applied for dismissing or escalating the events.
Scheduling an Event or Incident Intake Command
Event and Incident Intake has a specific schedule method for a command to run periodically.
Follow the steps below to add a schedule for an Event or Incident Intake:
Click on + New Schedule under the Schedules section.
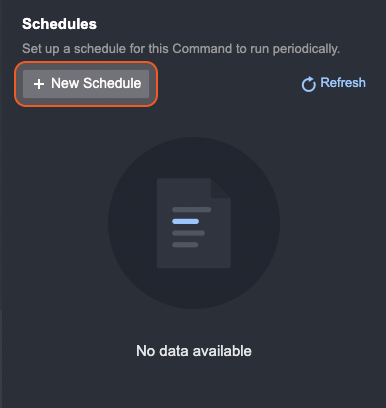
Select the Schedule radio button in the New Data Source pop-up window
Enter the following details:
Connection: Set which connection will be used for this job.
If the selected connection is shared with all clients, there will be an additional box for the JSON path of the client site that the scheduled event ingestion will appear in.
Interval: Set how often this job should run.
Start Time: Set the date and time for when this job will begin running.
Top Recent Event Number: Set the number of events you wish to fetch.
Search Condition: Define the search conditions for events to be ingested into the application.
There may be additional details such as End Time Artifacts that can be filled in for a schedule.
Click Save and Run. Clicking this will start the schedule.
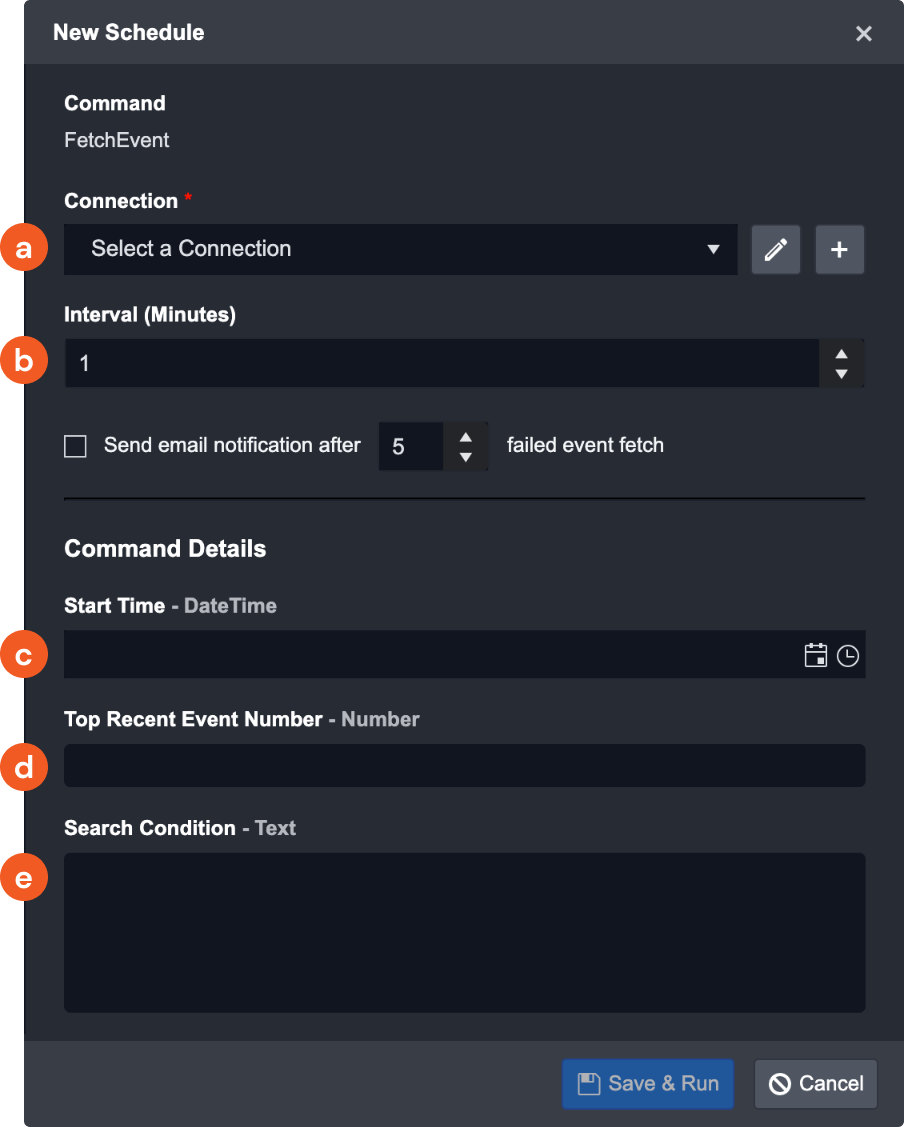
Event and Incident Intake Field Mapping
In addition to the sections listed above, Incident and Event Intake Commands will also require Event Field Mapping and Incident Field Mapping. Please note, D3 Security has added the essential event and incident field mapping for System Integrations.
Event Intake Specific Field Mapping
The Event Mapping will need to be configured via the Event Field Extraction Mapping located in the overview of an event intake command.
For an Event intake Integration, the fields extracted will need to be mapped to the fields using D3 Data Model or mapped to the custom fields defined by the user.
Below is an example of Field Extraction Mapping for the system Datadog Integration.
In the fetchEvent Command page, click on the Setup Field Extraction Mapping button.

Click on the Edit Event Source button to configure the default Event Source.
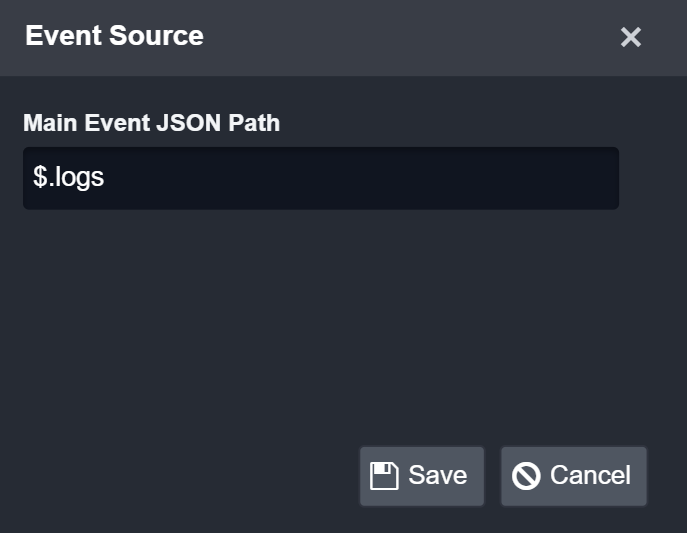
Edit Event Source to enter the Main JSON Path for the Datadog event data: $.logs
Click on the Save button.

Click on + Add Field to add a field to edit map fields from the event source to fields within the D3 Data Model.

Enter a name for Field Name: Event Type
Reader Note
The dropdown lists all the standardized field names within the D3 Data Model.
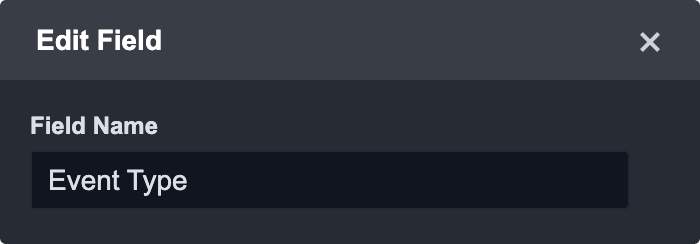
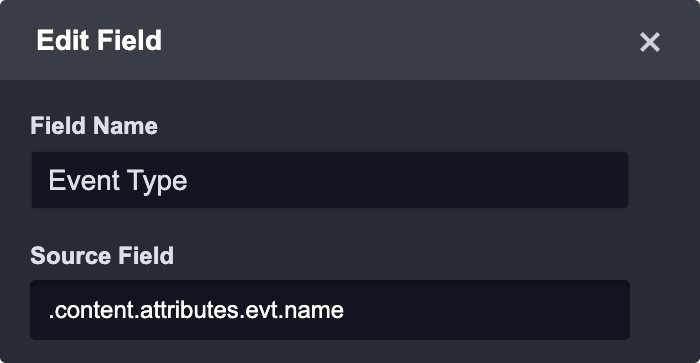
Select a Source Field:
.content.attributes.evt.name
Enter or select a Source Type from the dropdown: Text
(Optional): If you select the "Show in Incident" option, the corresponding field will appear in the "Key Information" section of the Event Summary in Incident Overvew. You can also specify the order in which the field should be displayed. If no order number is specified, the field will be displayed last. In case none of the field mappings have the "Show in Incident" option enabled, the "Events Summary" section will display a default set of field values.
Reader Note
Artifact Settings is used to configure source specific paths in artifact identities. For more details on how to configure artifacts, please refer to this document.
Click Save and then continue the other fields mapping following the steps from 2-8 until all desired field mappings are complete.
Reader Note
The Field Type column on this screen will display whether a field is user defined or a built-in field.
Reader Note
For more granular field mapping, you can add one or more custom Event Sources. This feature allows you to map specific third party data fields to the D3 Data Model or user-defined field when a search string is satisfied.
Configuring a New Event Source
Click the + Add Event Source button.

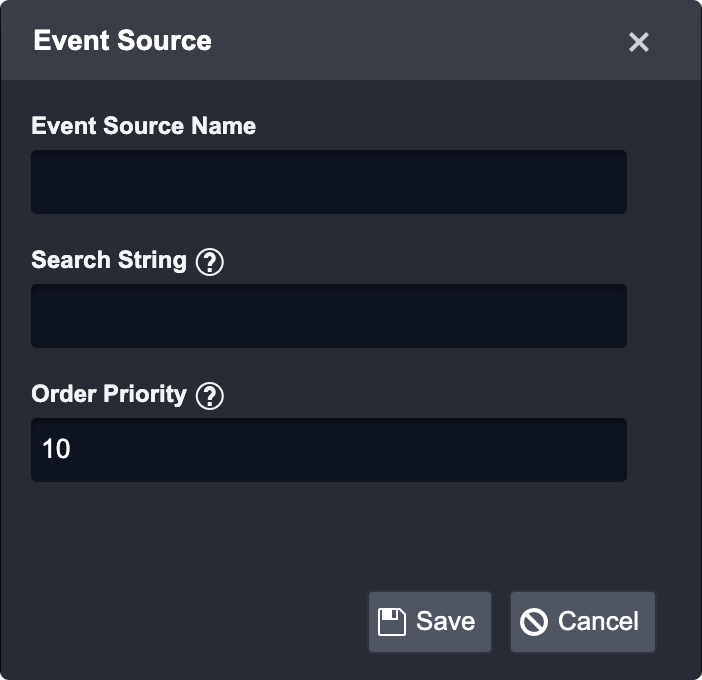
Complete the following fields on the Event Source form:
Event Source Name: Enter a custom event source name.
Search String: Enter a search string using the following format: {jsonpath}= value.
Order Priority: This field allows the SOC Engineer to determine which custom event source takes priority when field mappings apply to one or more event sources (the lowest number ranks the highest priority).
Click the Save button to confirm changes.
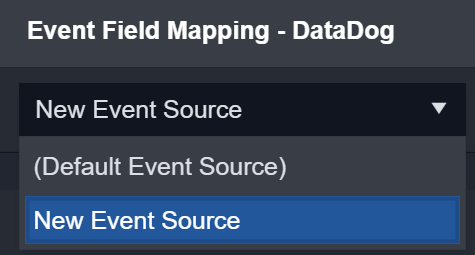
Result: The newly created Event Source will appear in the drop-down list on the Field Extraction window.
Source Field Types
D3 SOAR utilizes the Source Field Types to define how the mapped event data will be formatted within the application. The table below outlines the different source field types available and examples of how to use them.
Source Field Type | Description |
|---|---|
Text | Text: The source field will be formatted as text. Example: Event Type |
Datetime | Datetime: The source field will be formatted as a datetime. Default datetime format: Other datetime formats can be: UnixTimeSeconds, UnixTimeMilliseconds |
Regex | Regular Expression: The source field will be formatted as a regular expression with capture groups. Source Format: Get data from the capture groups. Example: $1 |
Conditions | Condition: Set conditions that must be met before the event field maps the data. Example: |
Placeholder | Placeholders: Combine previously mapped fields into a new String. Use the field name (not display name) of D3 data model fields or the user-defined field name. 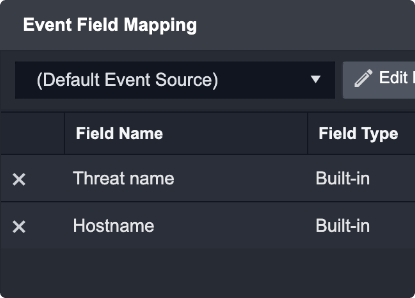 Put the field name in {} and construct a template in the Source Format. There are some system default placeholders that can also be used. These are found by clicking on system variables. |
Incident Intake Specific Field Mapping
Event Field Mapping
Event Field Mapping will also need to be completed for Incident Intake so that any child events that get ingested along with the Incident will be properly mapped.
Please note, the event field mappings are shared across both the Event Intake and Incident Intake Command. As such, you will only need to configure the event field mapping once.
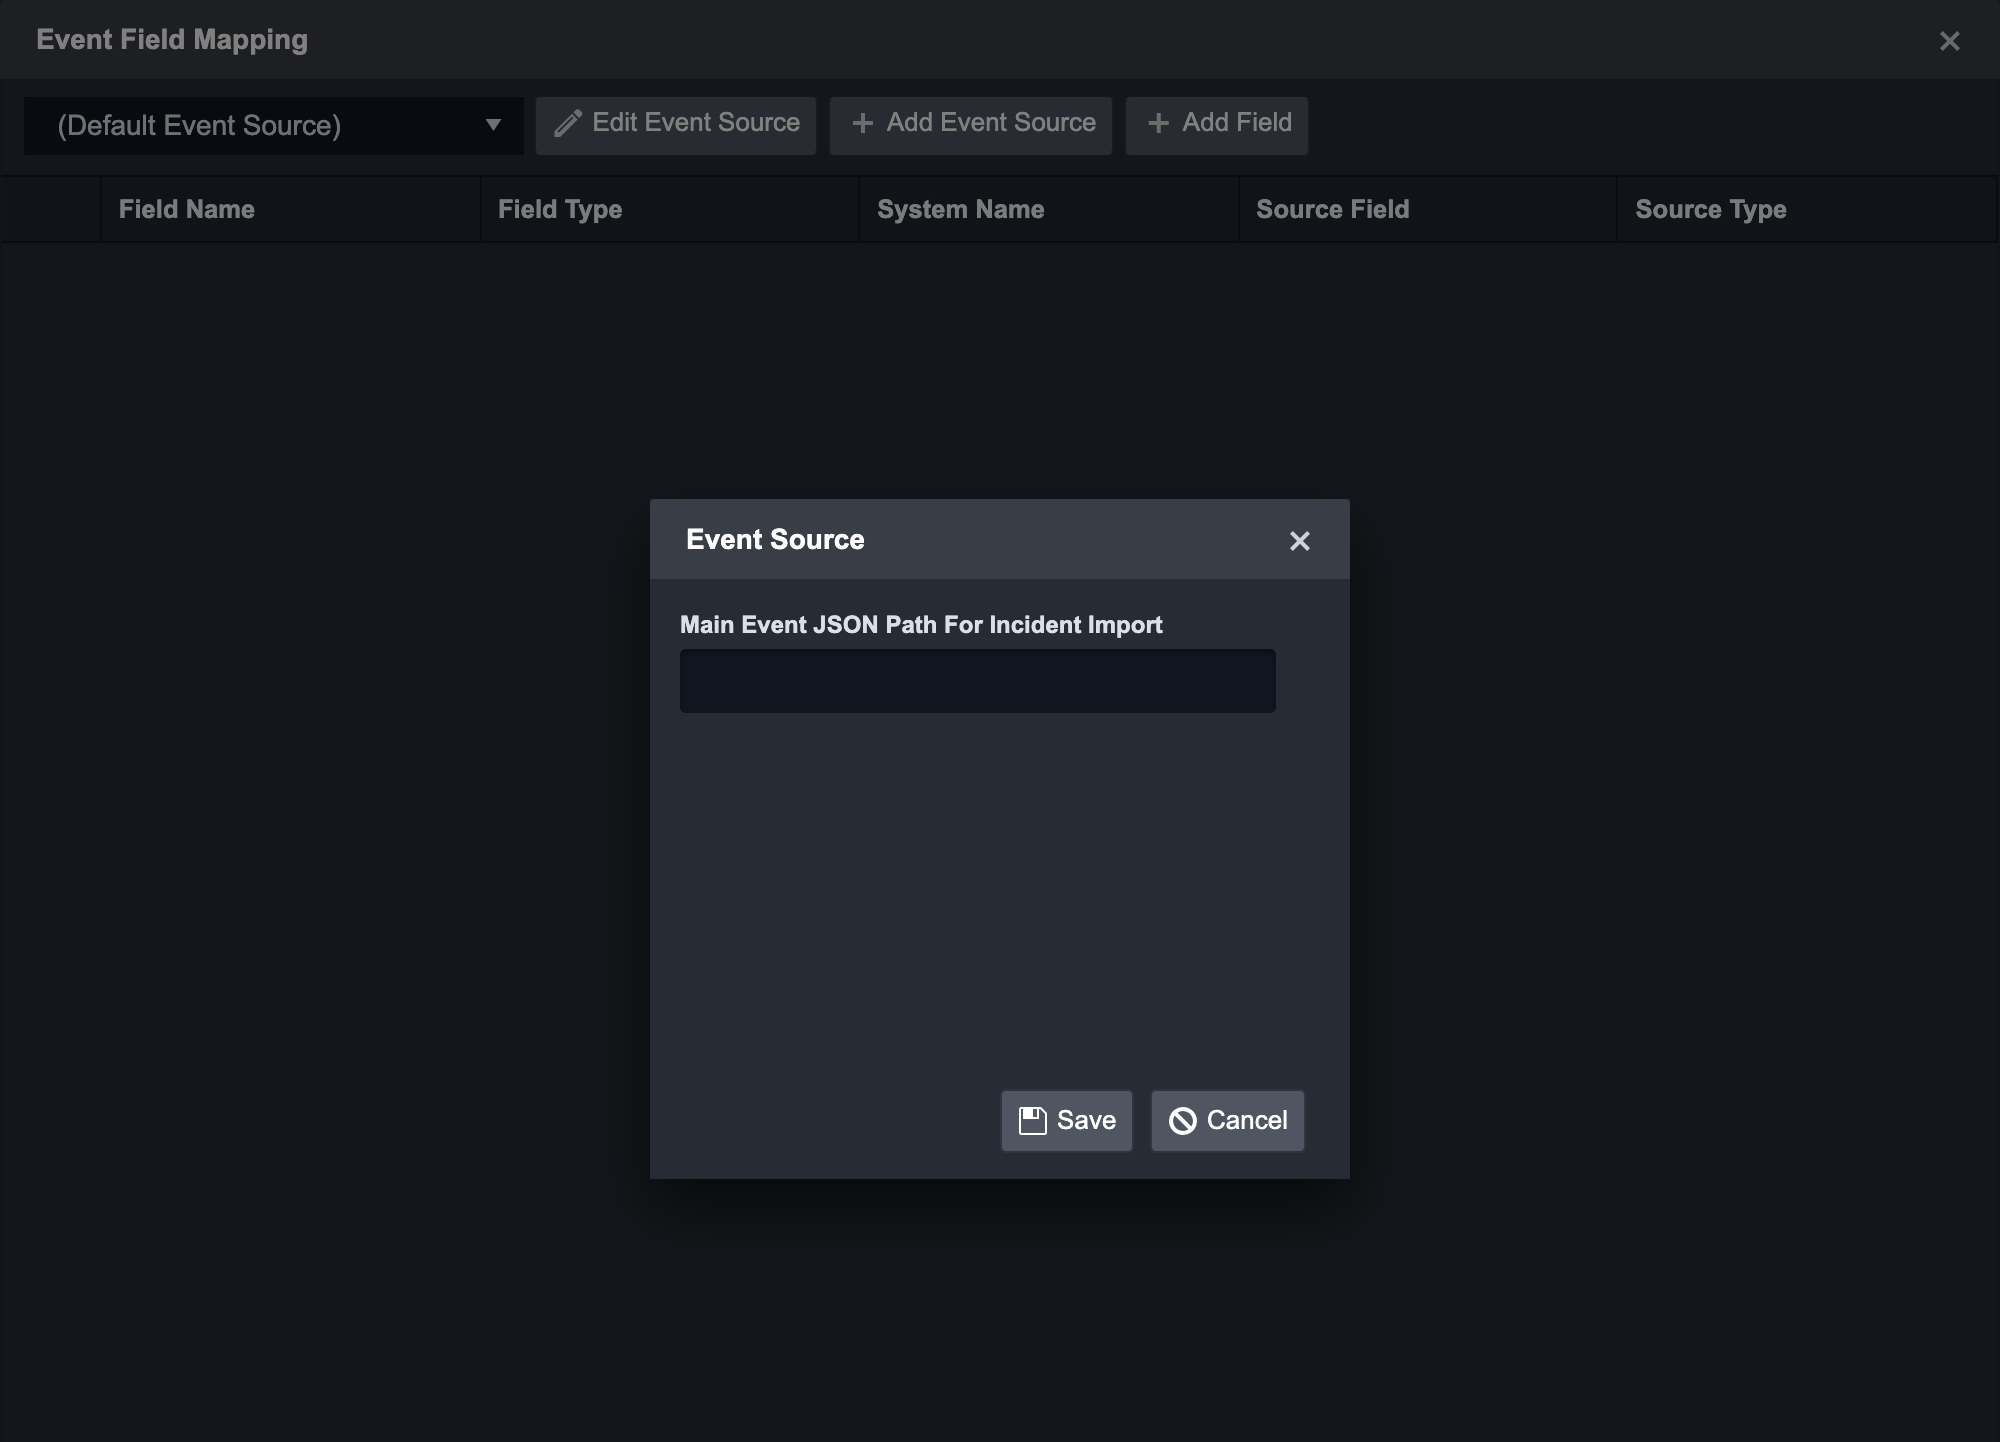
Please add the same JSON Path as the Event Intake required specifically to correctly link the Events to the Incident:
Incident Field Mapping
The Incident Field Mapping is only available for the Incident Intake Command.
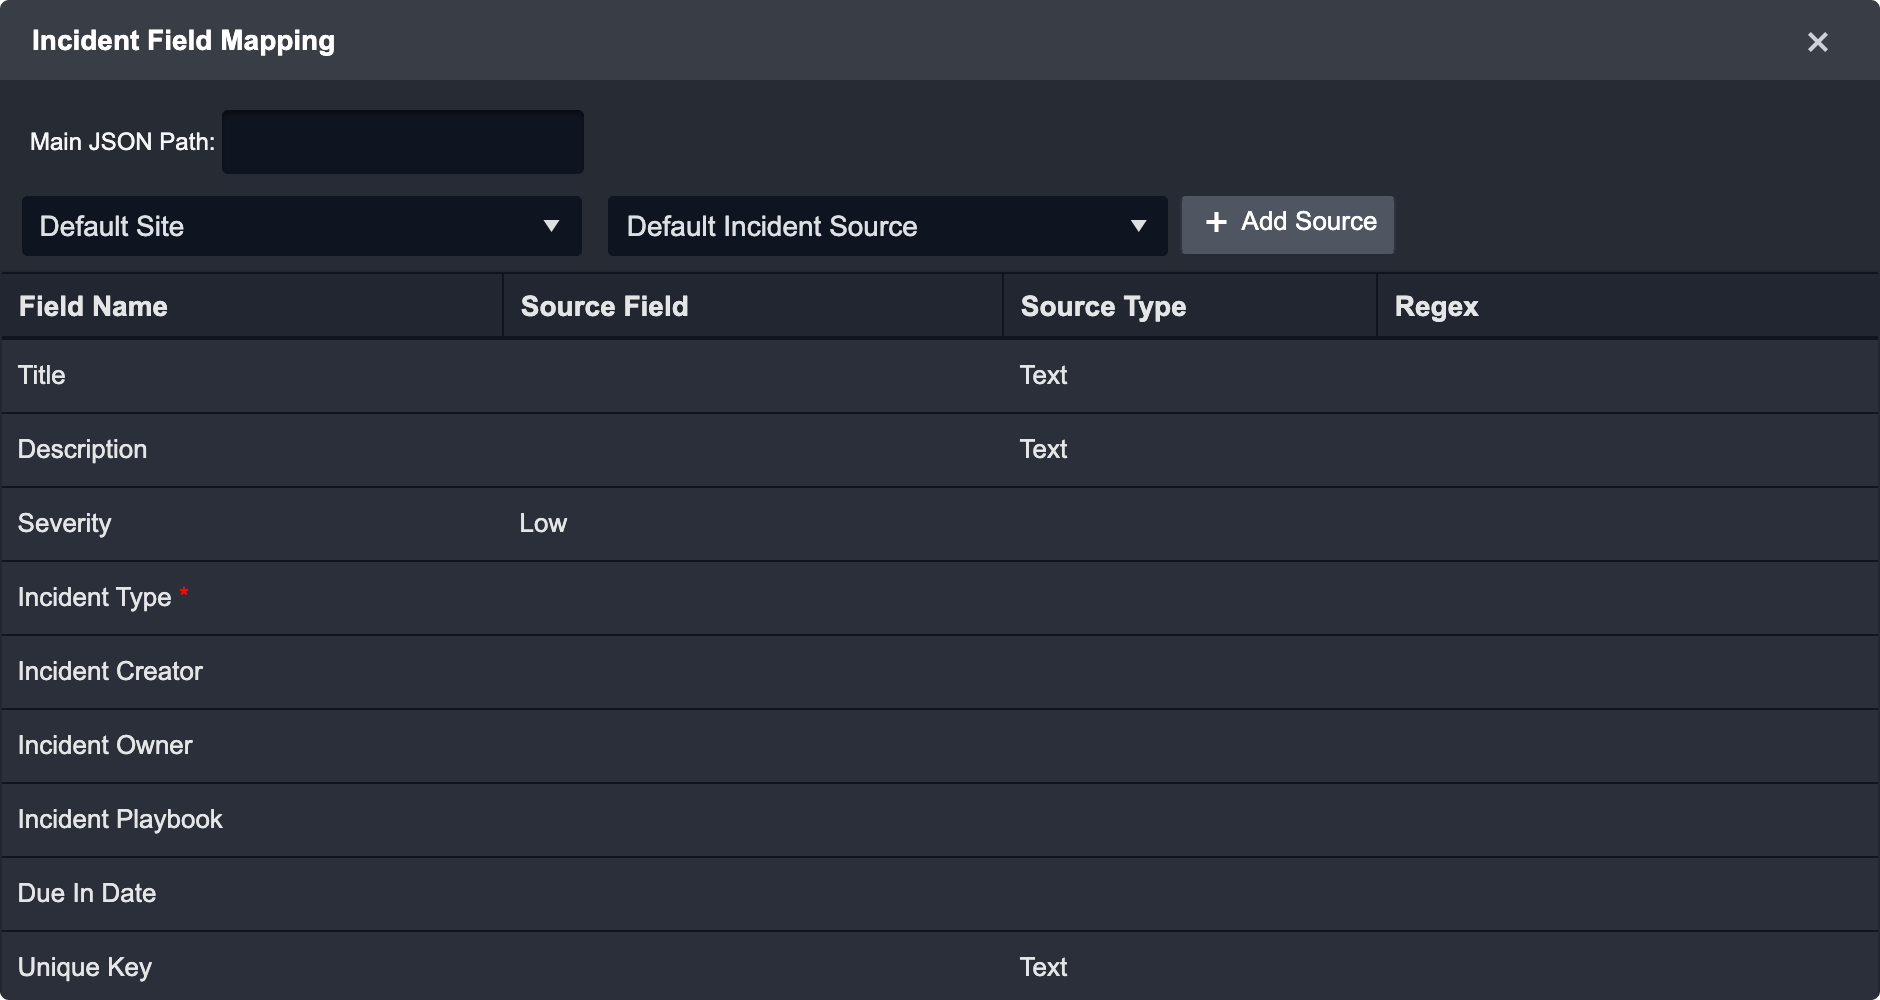
The Mapping allows the SOC Engineer to determine the following:
Title
Description
Severity
Incident Type
Incident Creator
Incident Owner
Incident Playbook
Due in Date
Unique Key
The SOC Engineer will need to input the Main JSON Path and define the Default Incident Source. For more flexibility, the SOC engineer can also define the mapping based on the site.
.png)