.png)
Event Playbook Viewer
Overview
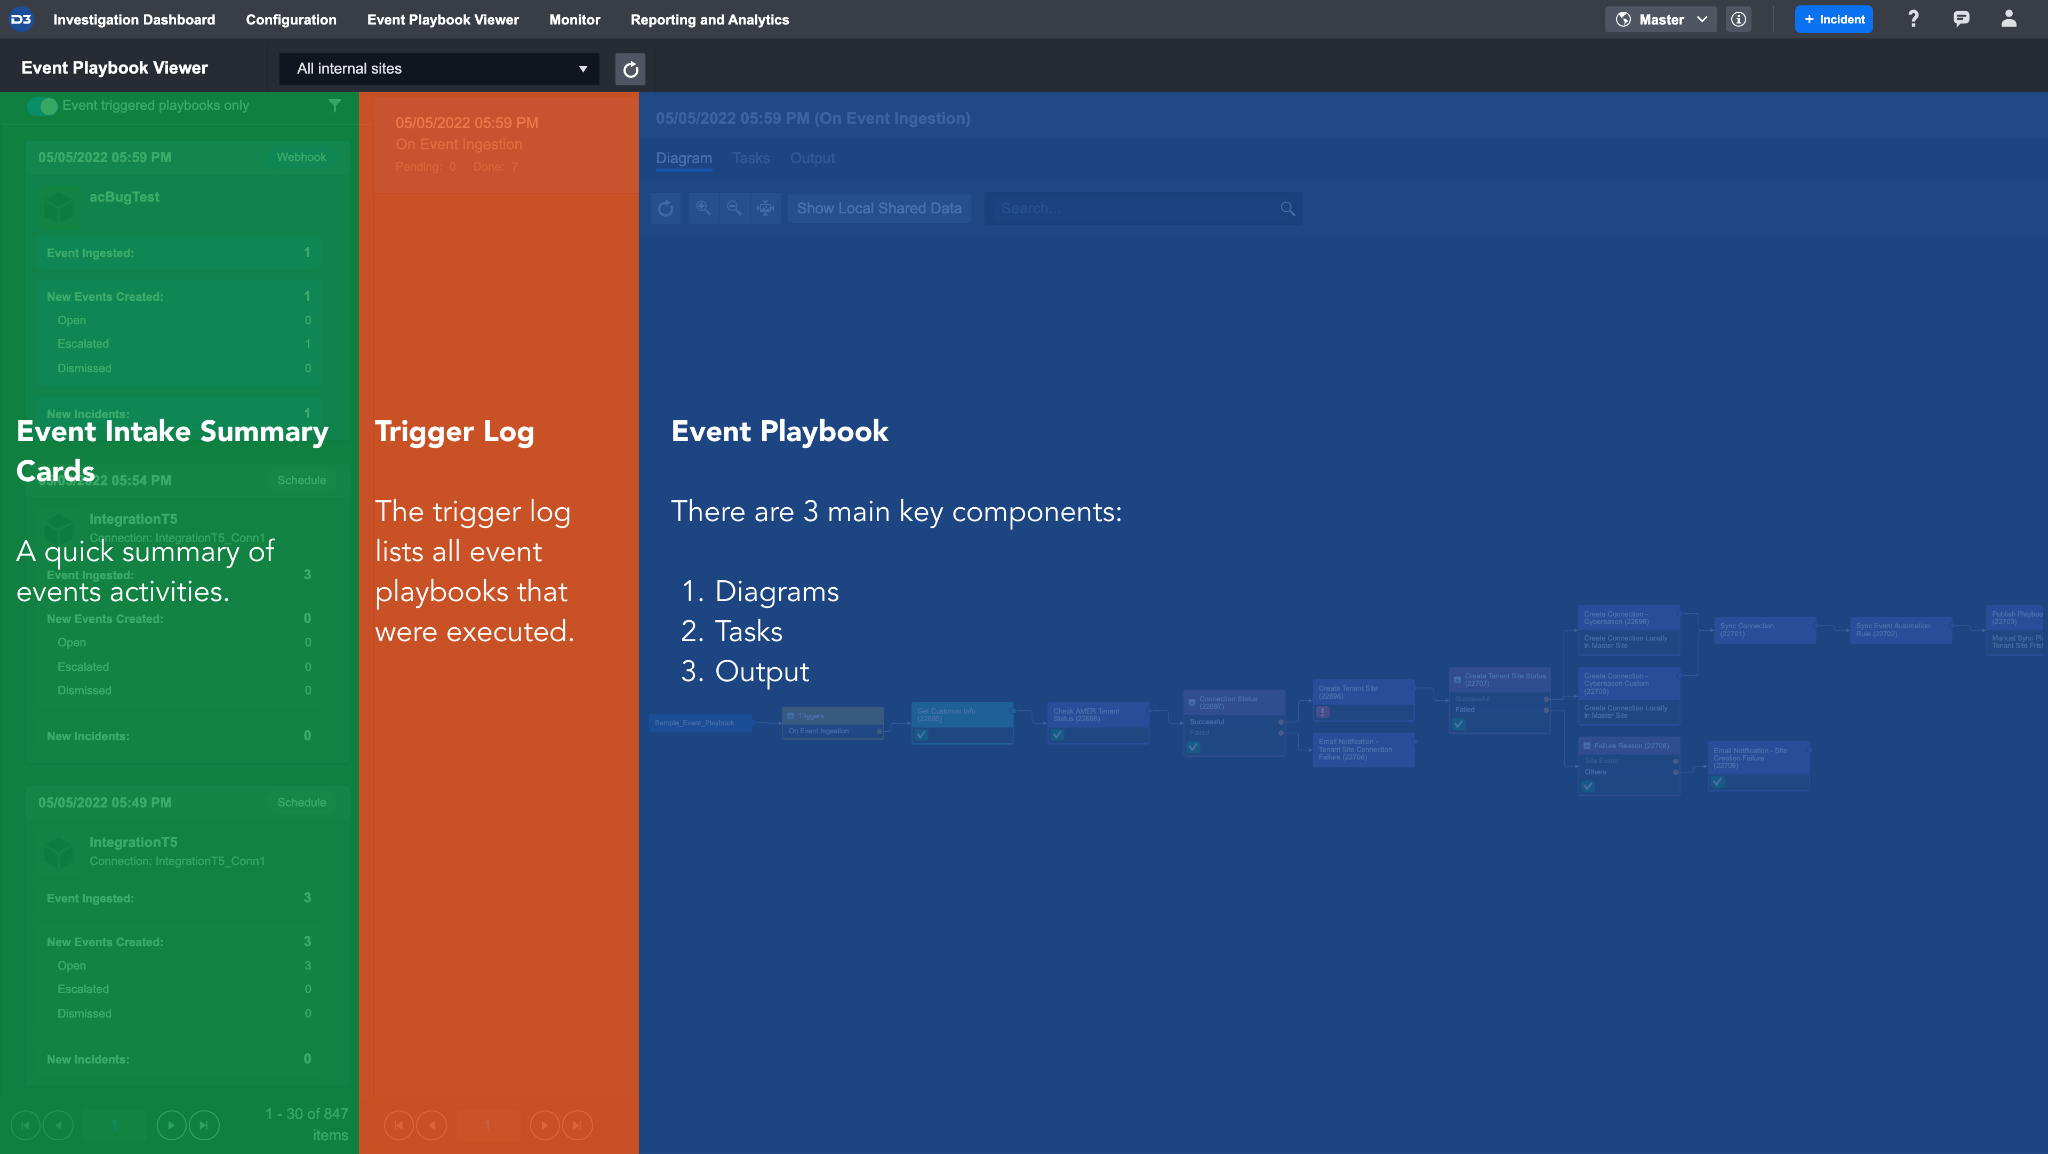
Event Playbook Viewer allows you to check the status of Event-triggered playbooks and the corresponding task details. There are two triggers—on event ingestion and after event dismissal—and a specific trigger determines the triggered task chain within the event playbook being executed.
In this feature, you can find the progress of data ingestion and see the statistical summary of events ingested, new events created and a count of new incidents. If there is any stop on error or manual tasks, you can manually operate those tasks here.
UI Structure
This section outlines the UI features of the Event Playbook Viewer and it contains the following components:
Event Intake Summary Card
Triggering log
Event Playbook
Event Intake Summary Card
Event intake summary cards group the event ingestion into batches and includes the statistics of Event Ingested, New Events Created, and New Incidents.
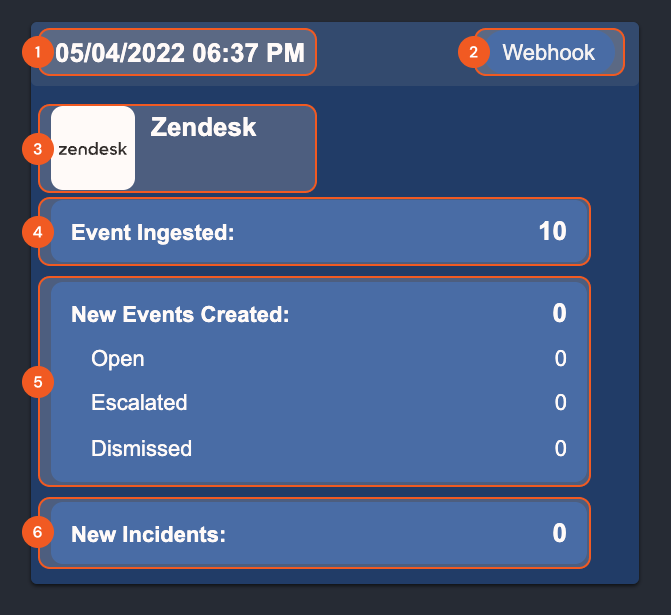
Time - The time of event ingestion.
Schedule - Displays the data ingestion method. There are four different ingestion methods:
Schedule
Webhook
File
Command
Integration and Connection - This shows the integrations and connections used to ingest data. Only data ingestion through the schedule uses a connection.
Event Ingested - The total number of ingested events.
New Events Created - The total number of new events created. The events go through the automation rule and will result in one of the three following states:
Open
Escalated
Dismissed
New Incidents - The total number of new incidents created through events escalation.
Filtering the Event Intake Summary Cards
You can apply filters to the cards to narrow down your search.
Reader Note
The toggle Event triggered playbooks only is enabled by default. This filters out empty event ingestion batches. To view all event ingestion batches, disable this toggle.
Click on the filter icon to open the filter window
You can filter the ingested event data by Integration, Date Range and Intake Method.
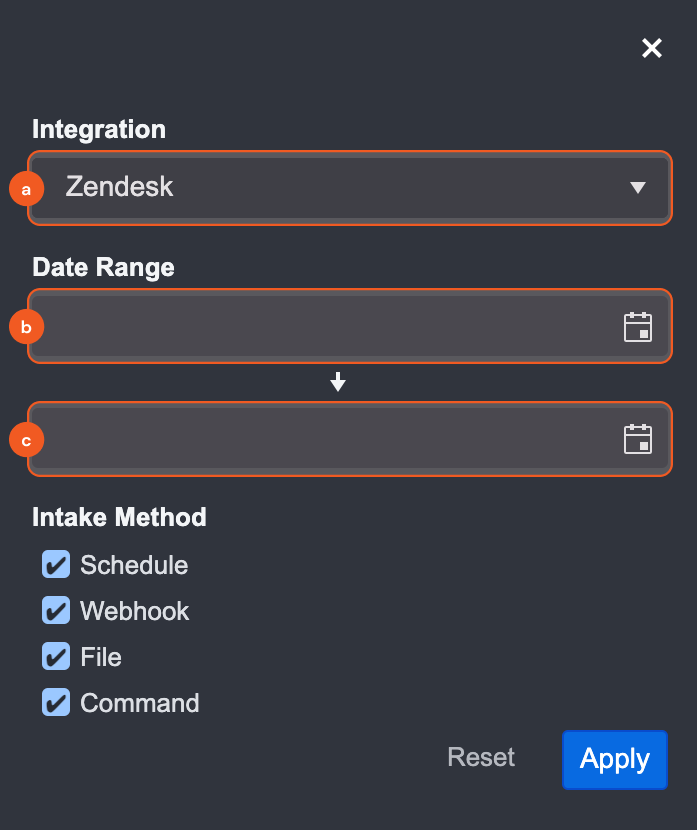
a. Integration – The integration that the event data was in ingested through
b. Date Range – The date range that the event data was ingested
c. Intake Method – The three types of event data ingestion methods
Schedule
Webhook
File
Trigger Log
The trigger log lists all event playbooks that were executed. Each log represents a specific run of a triggered event playbook path – its details, which include: time of execution, the trigger, and status is displayed.
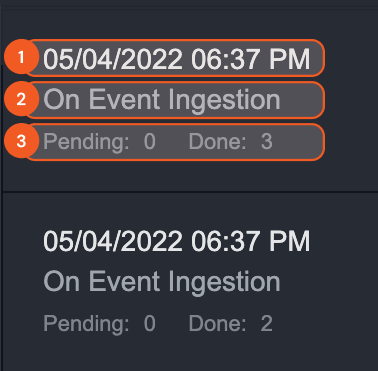
Time - The time that this event was triggered
Specific Trigger - The specific event playbook trigger that executed
Pending and Done - The number of pending tasks and done tasks
Event Playbook
This panel displays an overview of the specific triggered task chain within the event playbook that was executed. For example, if you are viewing an After Event Escalation trigger log, you will only see the task chain that comes after the After Event Escalation trigger in that specific event playbook.
There are three ways to view the progress and task details:
Diagram
Tasks
Output
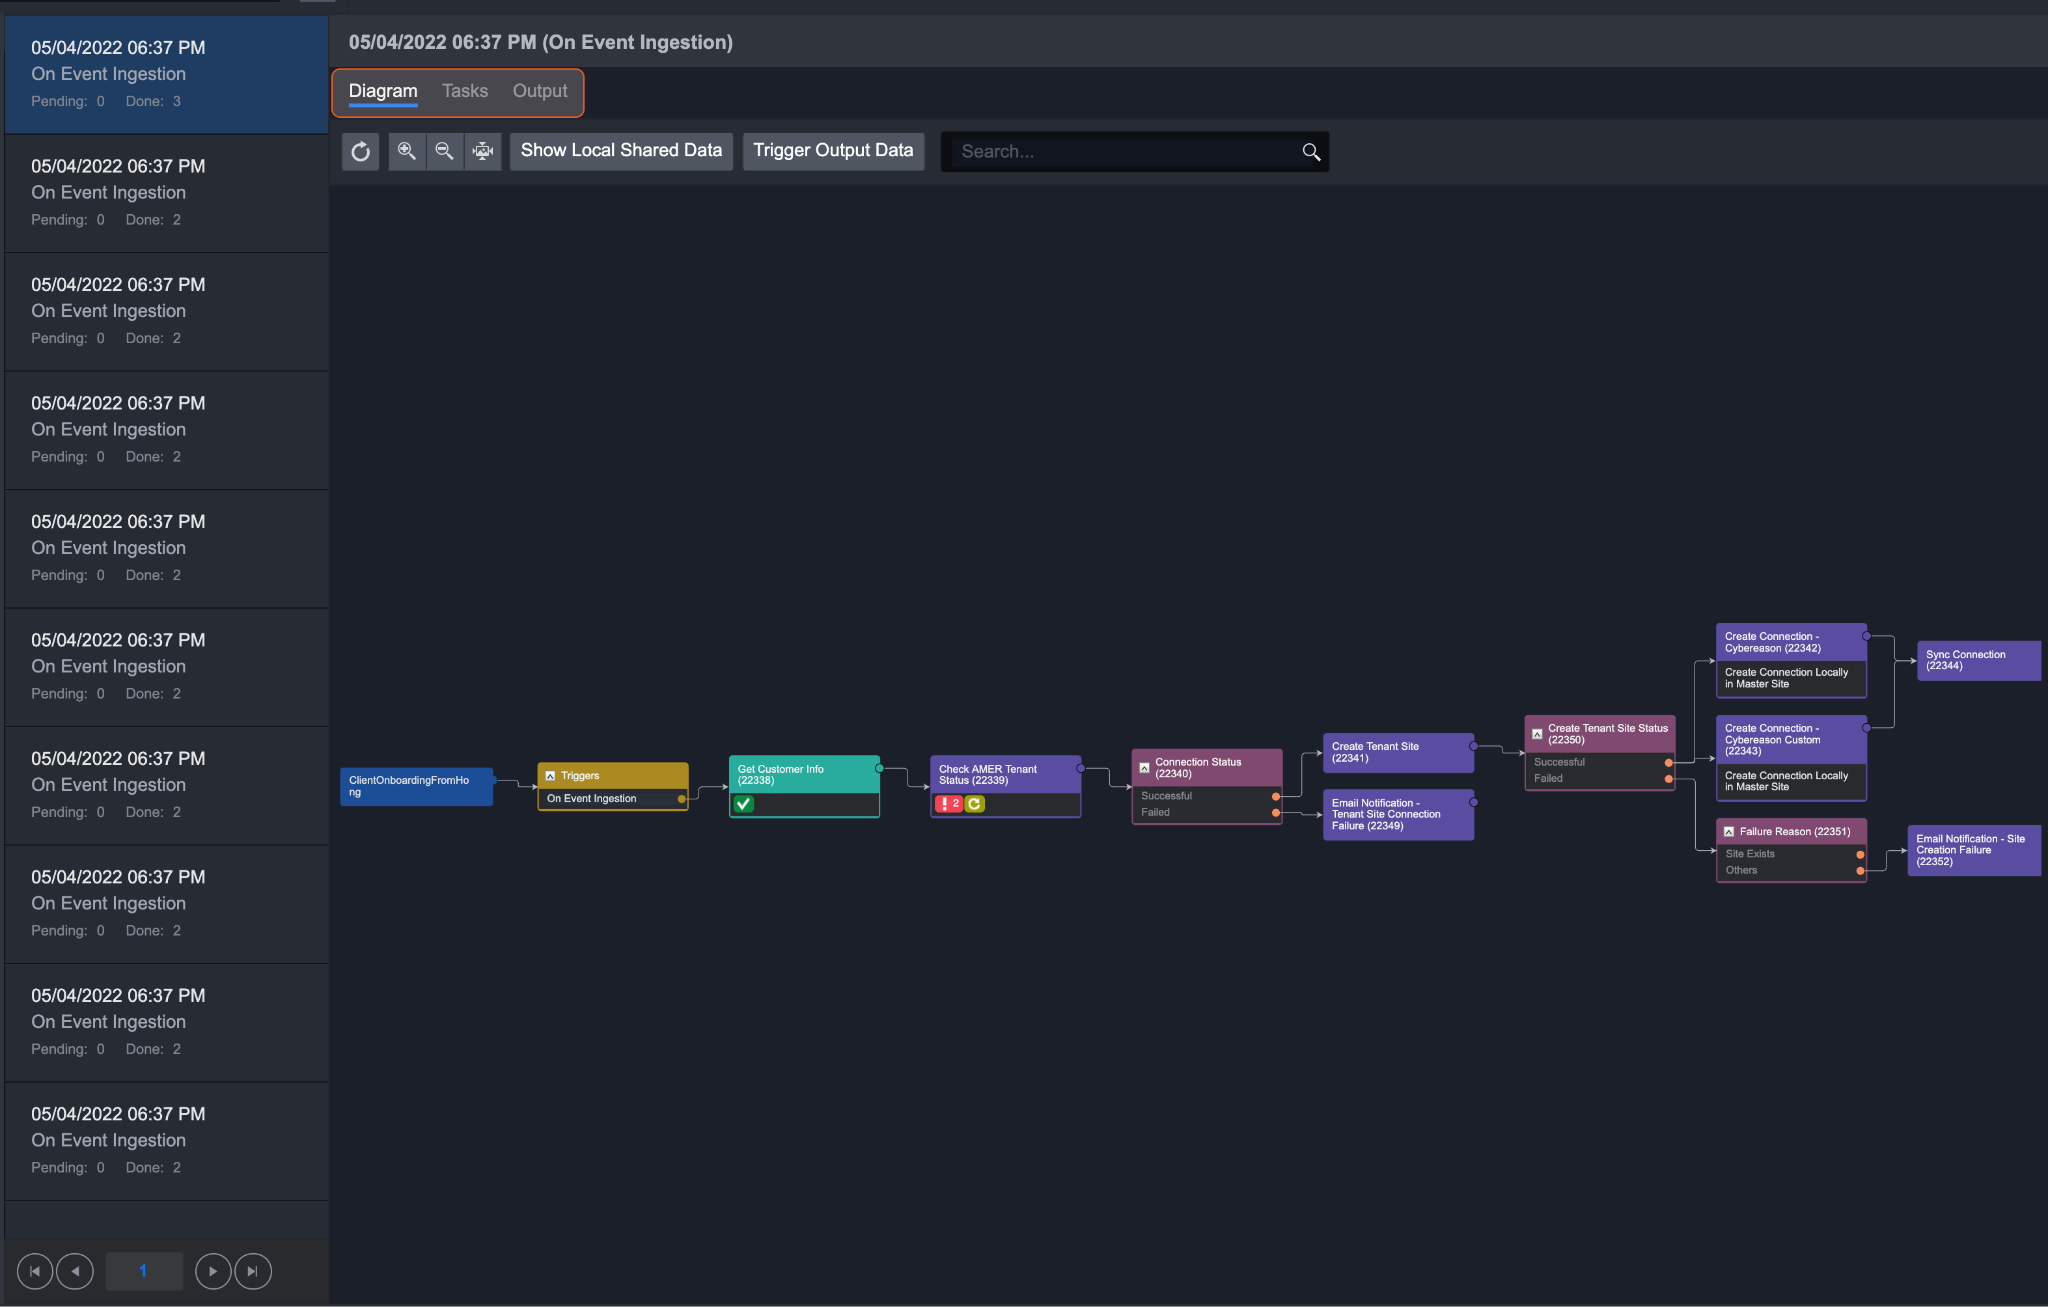
Diagram
You can see the progress of an Event Playbook and click on a task to view details.
 Done | The green checkmark means the task was successfully run. |
 Error | This icon indicates that an error has occurred while the task was running. You can rerun these tasks after correcting the error. |
 Required  Suggested | Required tasks are represented by an asterisk and suggested tasks have a light bulb. Both of these statuses are referred to as a Pending Task. Required Tasks require your manual response, whereas this action is optional for Suggested Tasks. |
 | Any task without a status icon has not been run yet. |
Get Latest Playbook
In the case an event playbook has been updated after it has run, you will notice a button appear next to the search bar. Clicking this button will replace and re-run the playbook on this event, updating task statuses.
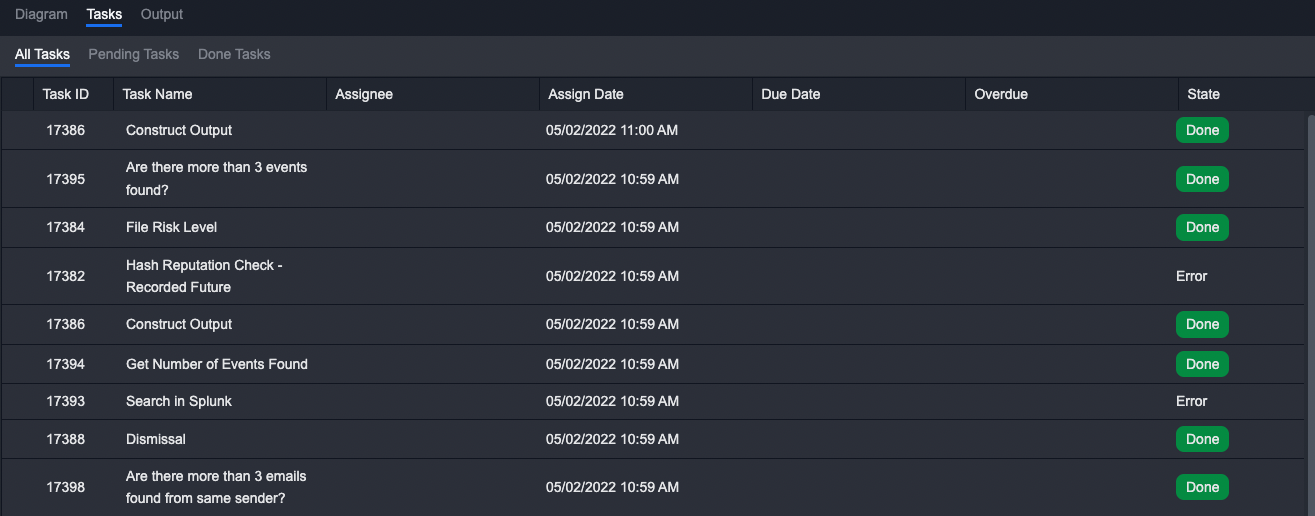
Tasks
This tab shows all the tasks of an event Playbook and is categorized into three sub-tabs: All Tasks, Pending Tasks and Done Tasks. To correct an erroneous task, click on the specific item to open the Task Details window and click on the Rerun button to address the error before you run the error task. Under the Pending Tasks tab, there are required and suggested tasks. The required tasks require manual user input while a suggested task is optional.
Output
The output tab shows the results of an event playbook that contains a passdown task. You can configure the Passdown Task to save the results of the executed Playbook Task and pass down its values into the Command Task’s output or any designated placeholder fields.