
Schedules
Schedules is a system performing a task at a given time interval. You can schedule both Utility Commands and Integration Commands to run periodically.
For example, you can schedule the system to perform a weekly IP Reputation Check of incoming emails, or any other actions. All Schedules can be created, edited, and viewed in the Schedules Module.
The Schedules module shows a complete list of all scheduled jobs for Commands. There are three types of Commands that will show up in the Schedules list:
Integration Command: handle data ingestion into D3 SOAR. For more information, see Integrations.
Utility Command: handle the manipulation, transformation and other tasks of the ingested data. For more information, see Utility Commands.
System Command: handle the recursive connection health check. For more information, see Utility Commands.
Reader Notes
fetchEvents and fetchIncidents schedules are located in Data Ingestion.
Anatomy of a Schedule
The module provides you with the following components:
List of Scheduled Commands
Within each Schedule, there are the following details:
Run Filter
Run Log
Information Panels of each job run (Input and Output Data, Error Log)
List of Scheduled Commands
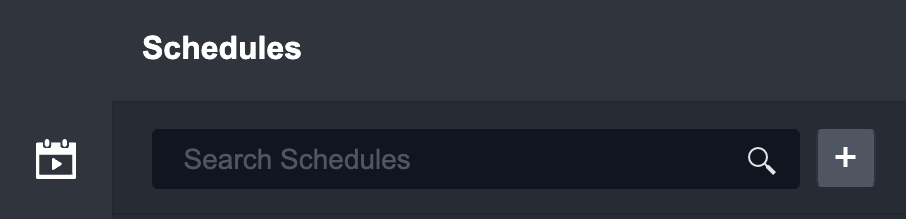
Provides a list of Scheduled Commands. Each Schedule card provides you with the Schedule’s name, the start and end date, and the active / disabled status. You can also search for Schedules in this list. Schedules can be sorted by default or by sites. Sorting by sites will nest all schedules under that particular site.
To create a new Schedule, click on the + button to add an Integration Command or Utility Command schedule.
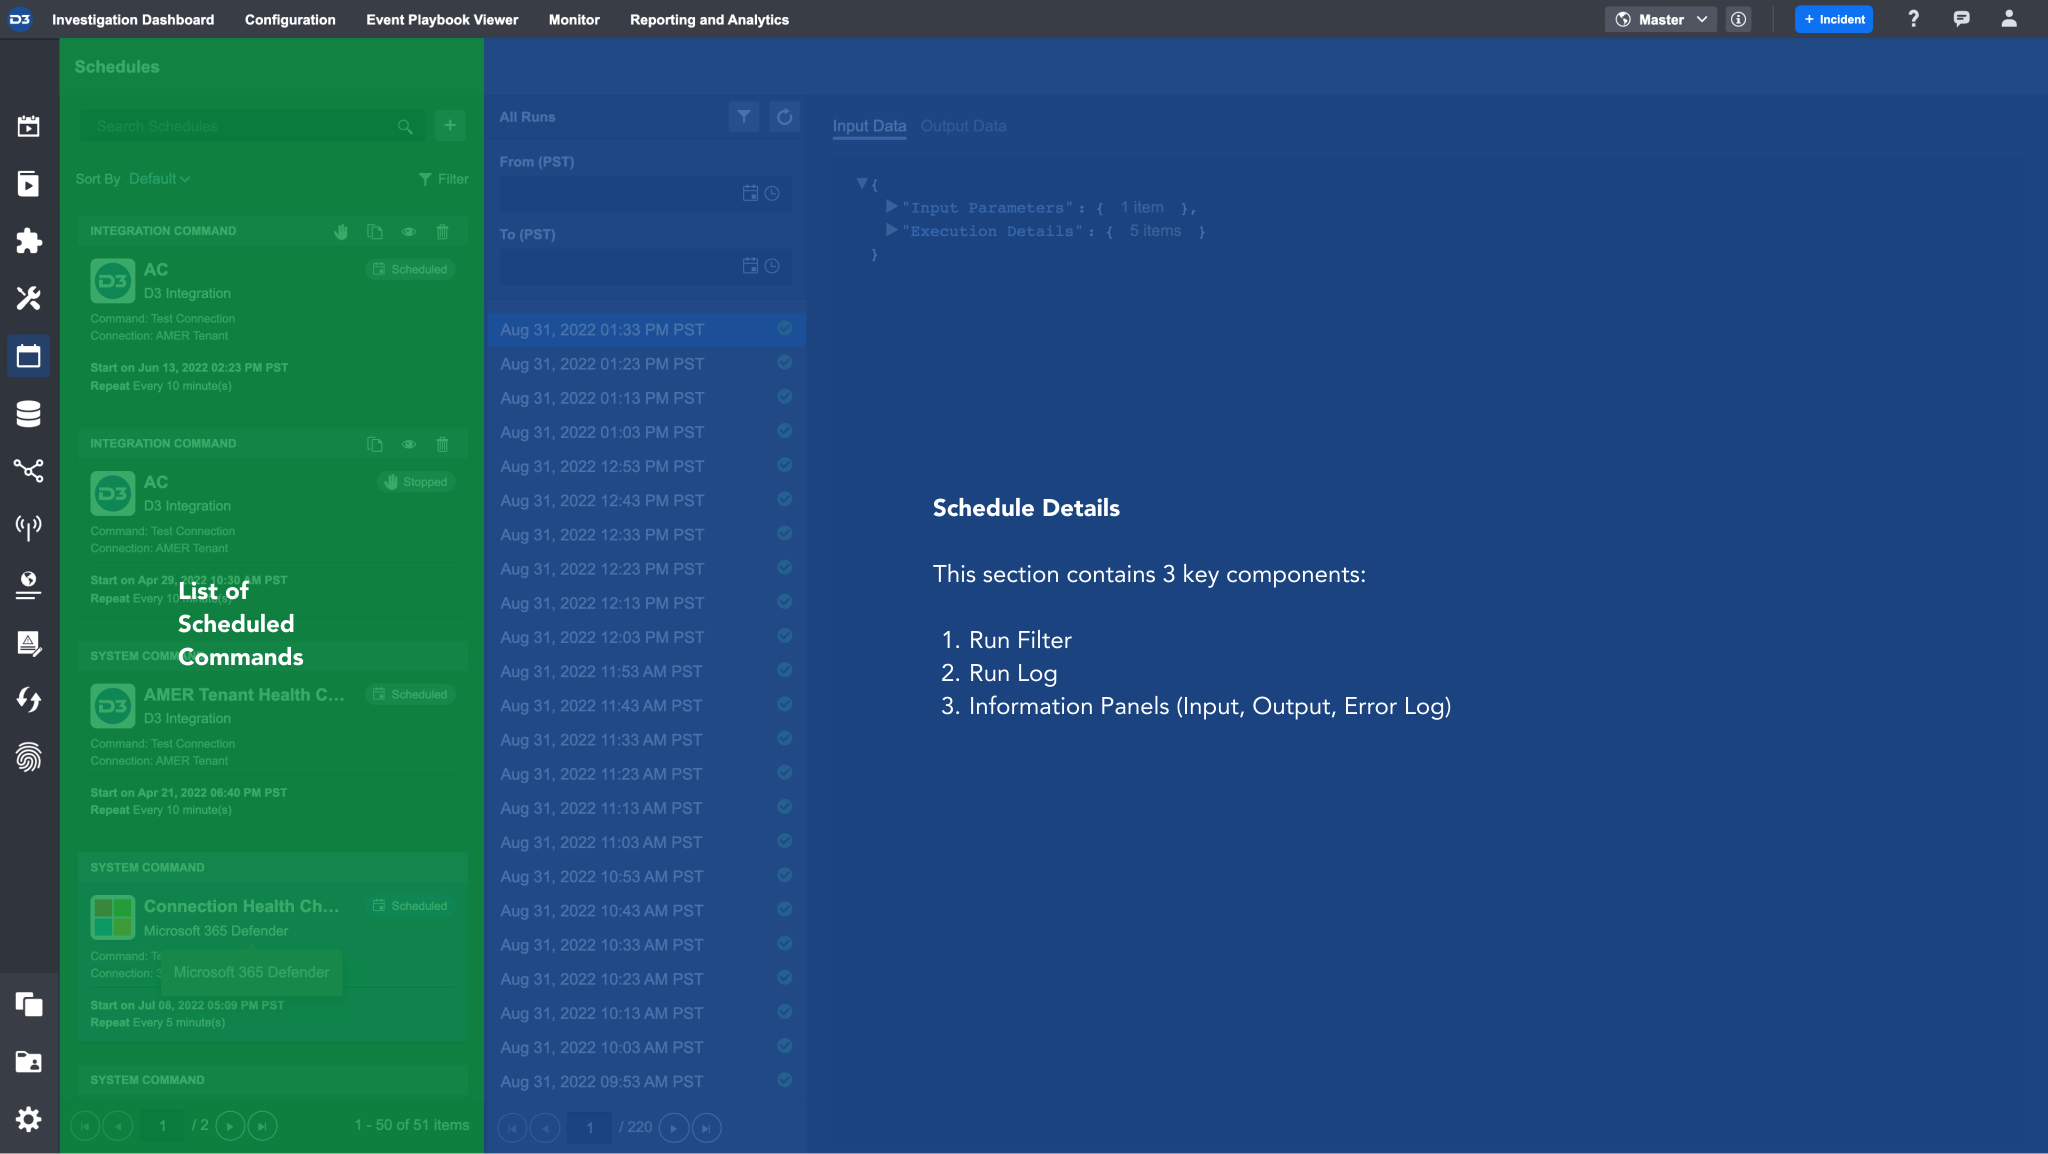
Schedule Details
Each Schedule consists of various runtimes. Selecting a Schedule runtime will display the details of each Schedule, including: Input Data, Output Data, and Error Log.
All Scheduled Commands are either an Integration or Utility Command; as such, they all have input, output, and error log of the Command execution.
Configuring a Schedule
Configuring Scheduled Commands
To create a new Integration Command schedule:
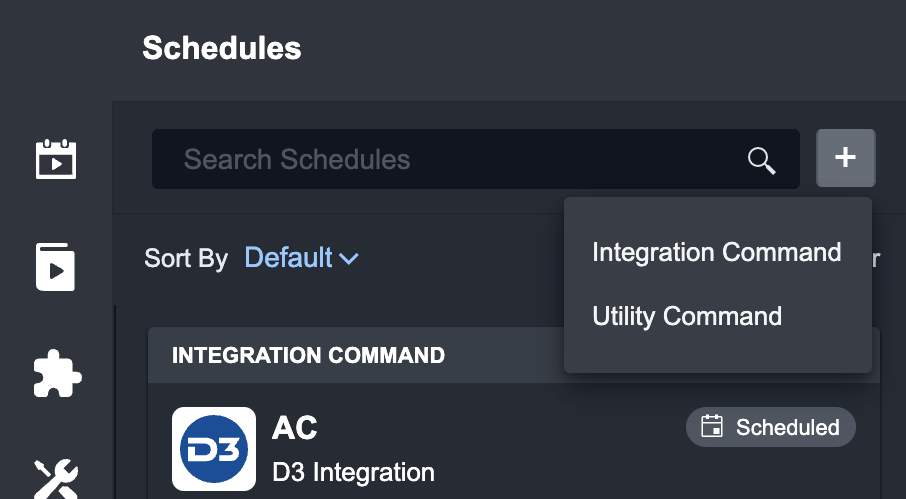
Navigate to the Schedule tab.
Click on the + icon.
Select Integration Command from the dropdown menu.
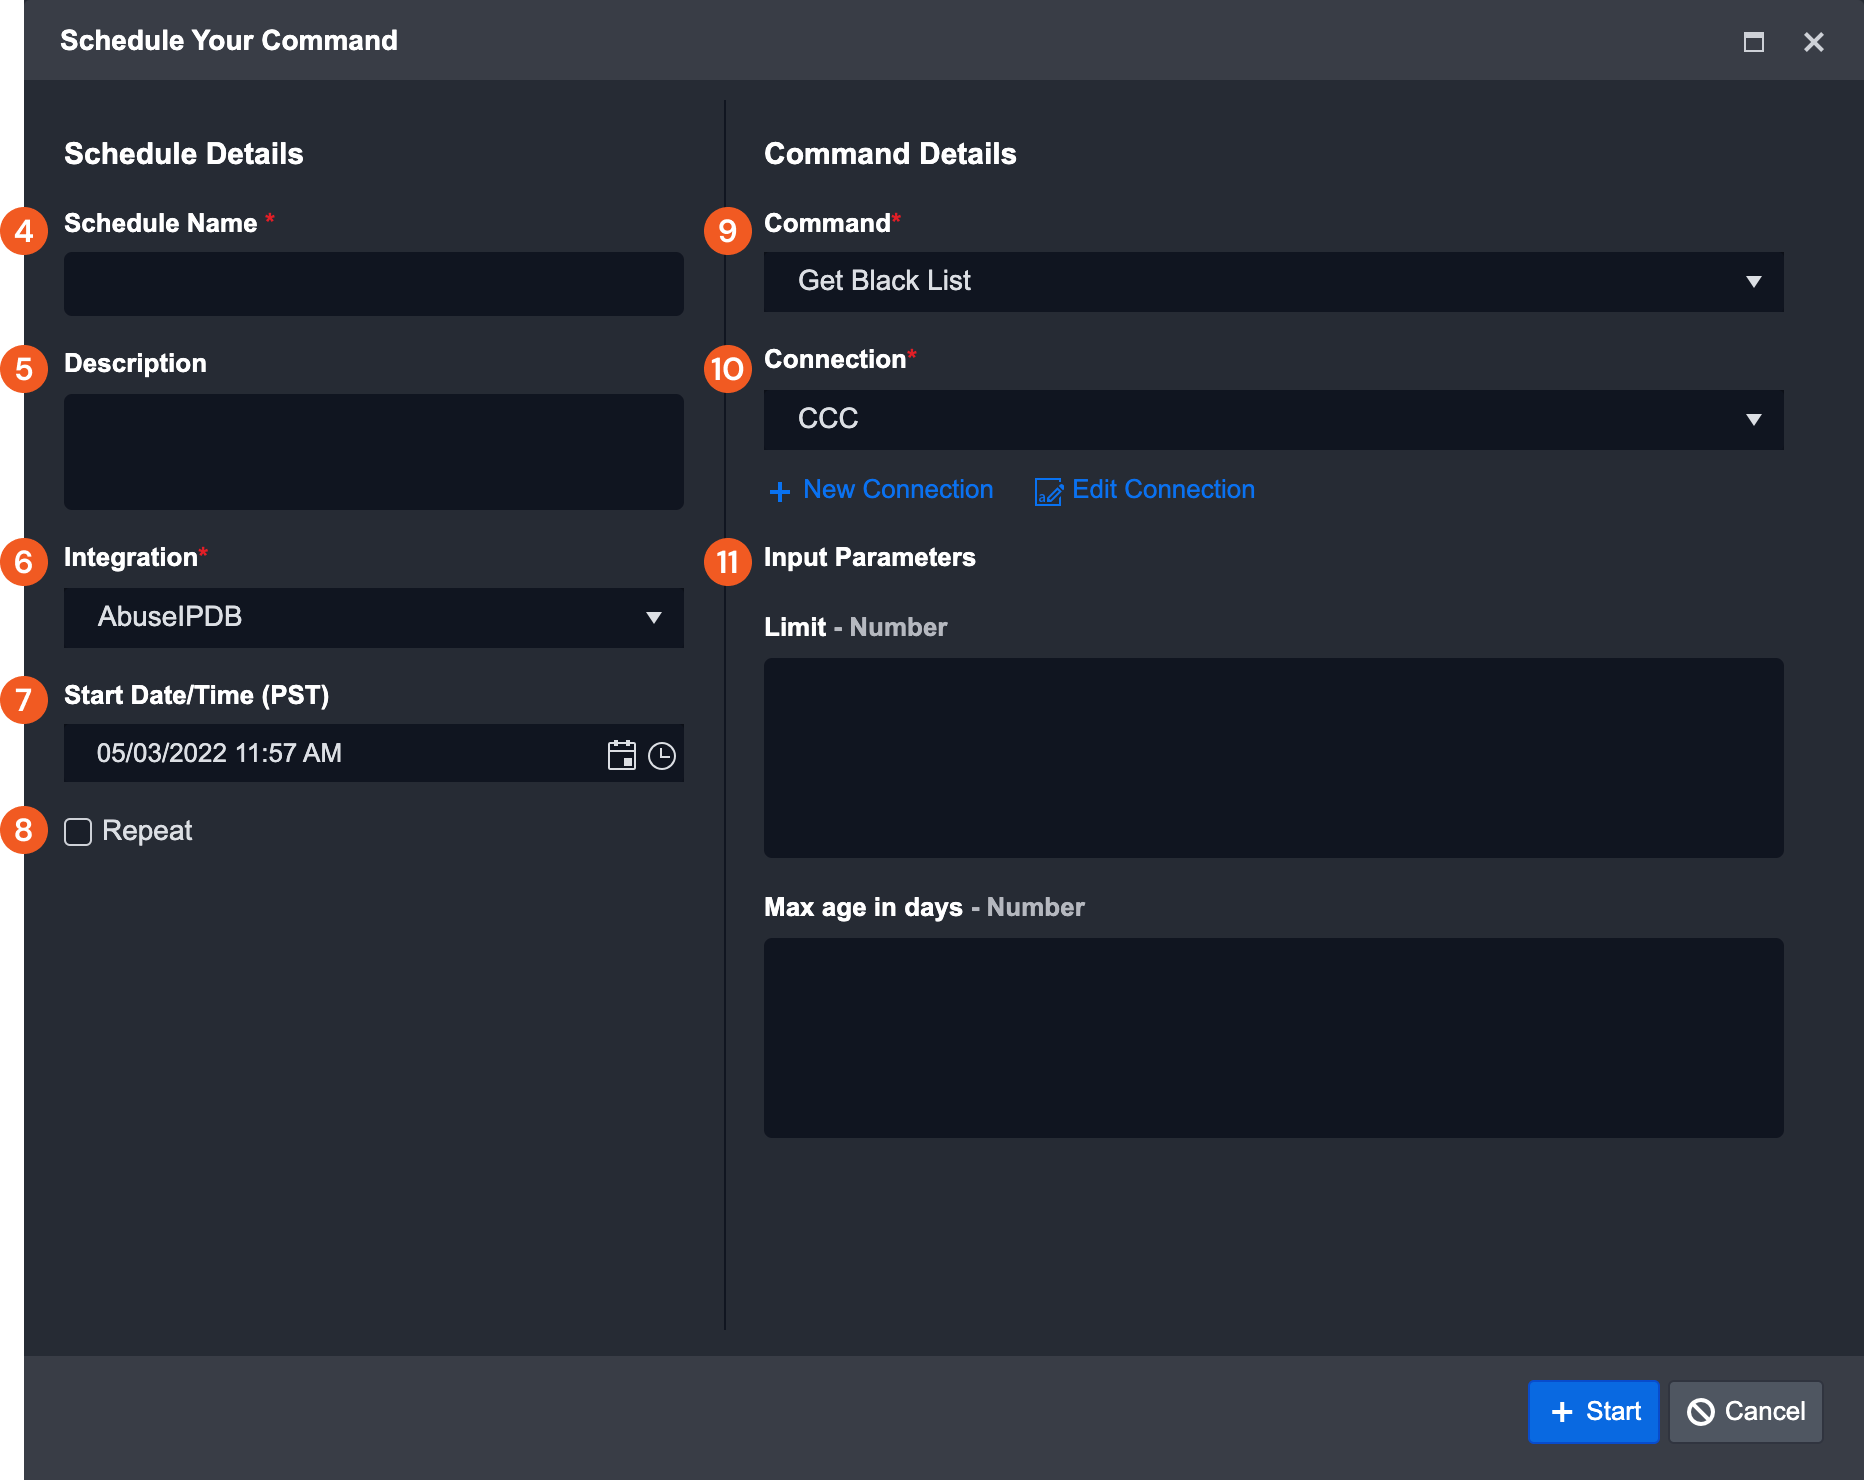
Fill in the Schedule Name.
(Optional) Add a description
Select the desired Integration.
Set the Schedule Start Time.
(Optional) If you want the schedule to repeat, check the Repeat checkbox. This will open a pop-up window where you can configure the schedule repeats.
Set the Schedule Start Time.
Select the desired Connection.
Fill the Input Parameters.
Click Start to run the schedule.
Result
The new Schedules will display as a card on the left hand side.
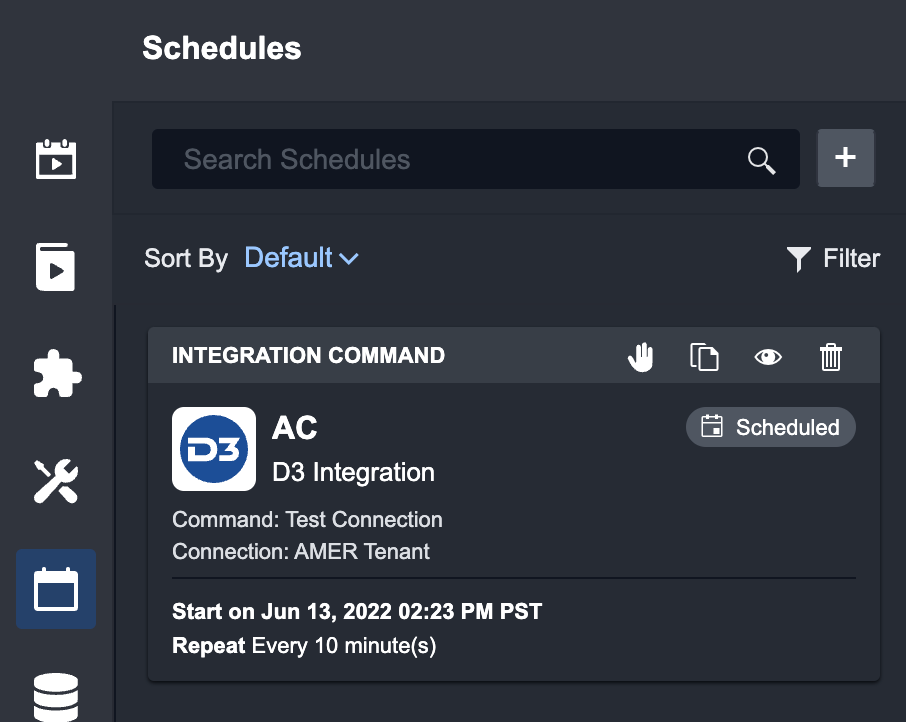
A Schedule card displays all of the job’s Command information and time information. You can view Schedule Job status by the tag on the right of the Schedule name. Click on a schedule to view its run log.
Status | Description |
|---|---|
 | This indicates that the Scheduled Command is configured. |
 | This indicates that the Schedule is done. |
 | This indicates that the Schedules Command is stopped by the user. If a schedule is stopped, it cannot be started again. |
Reader Note
Creating a new Schedules for a Utility Command is similar to the Integration Command instructions above. The only difference is that you will not need to select an Integration nor a Connection.
To clone an existing Schedules:
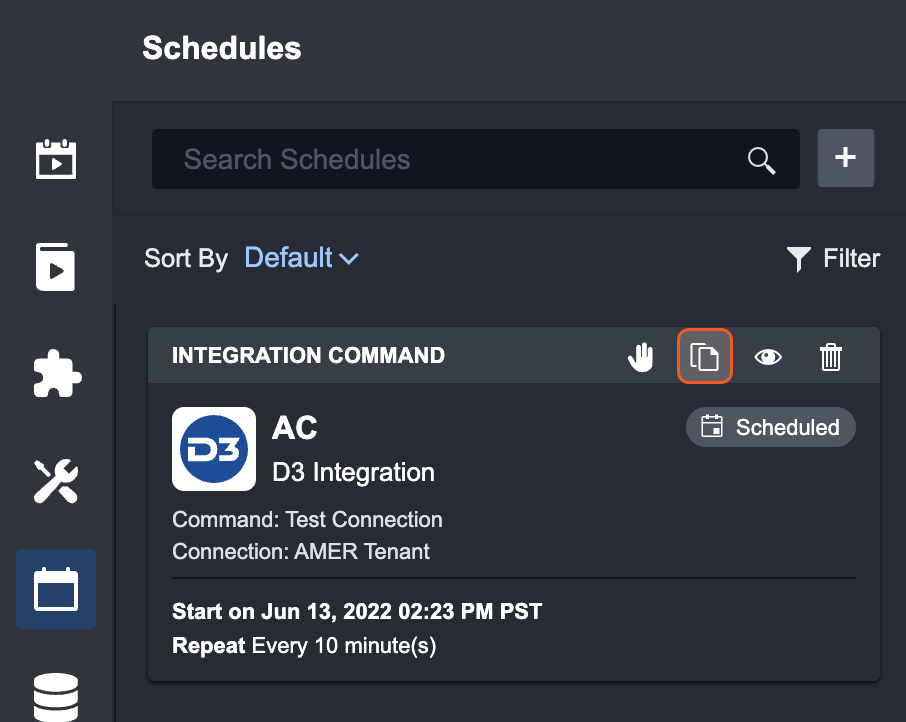
The four icons on the Schedule cards are: Stop, Clone, View and Delete.
Click on the Clone icon.
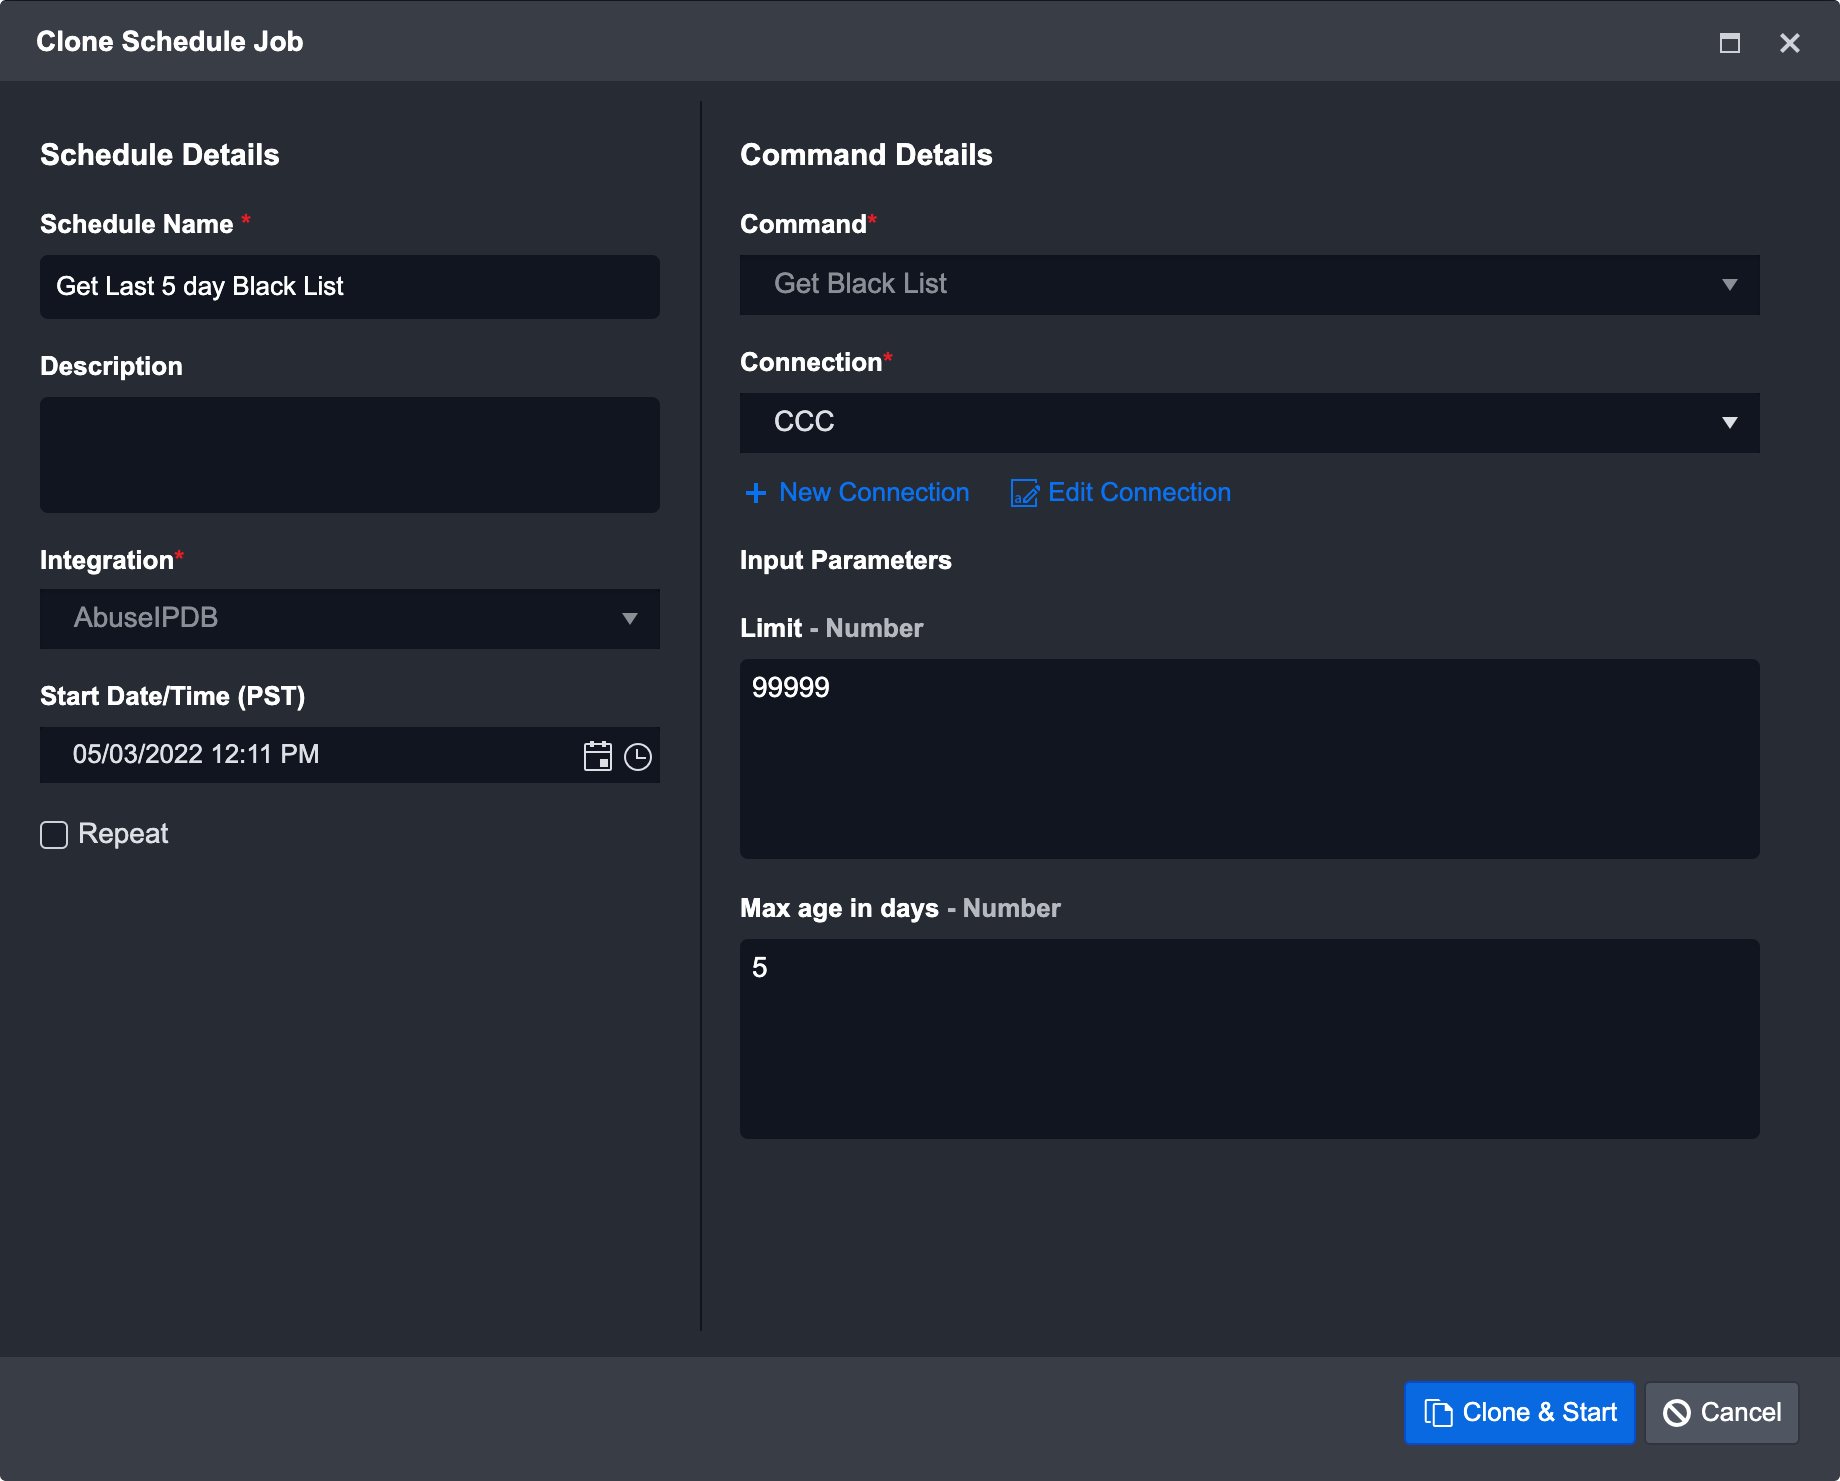
Make the desired changes to the cloned schedule.
Click Clone & Start.
Schedule Details
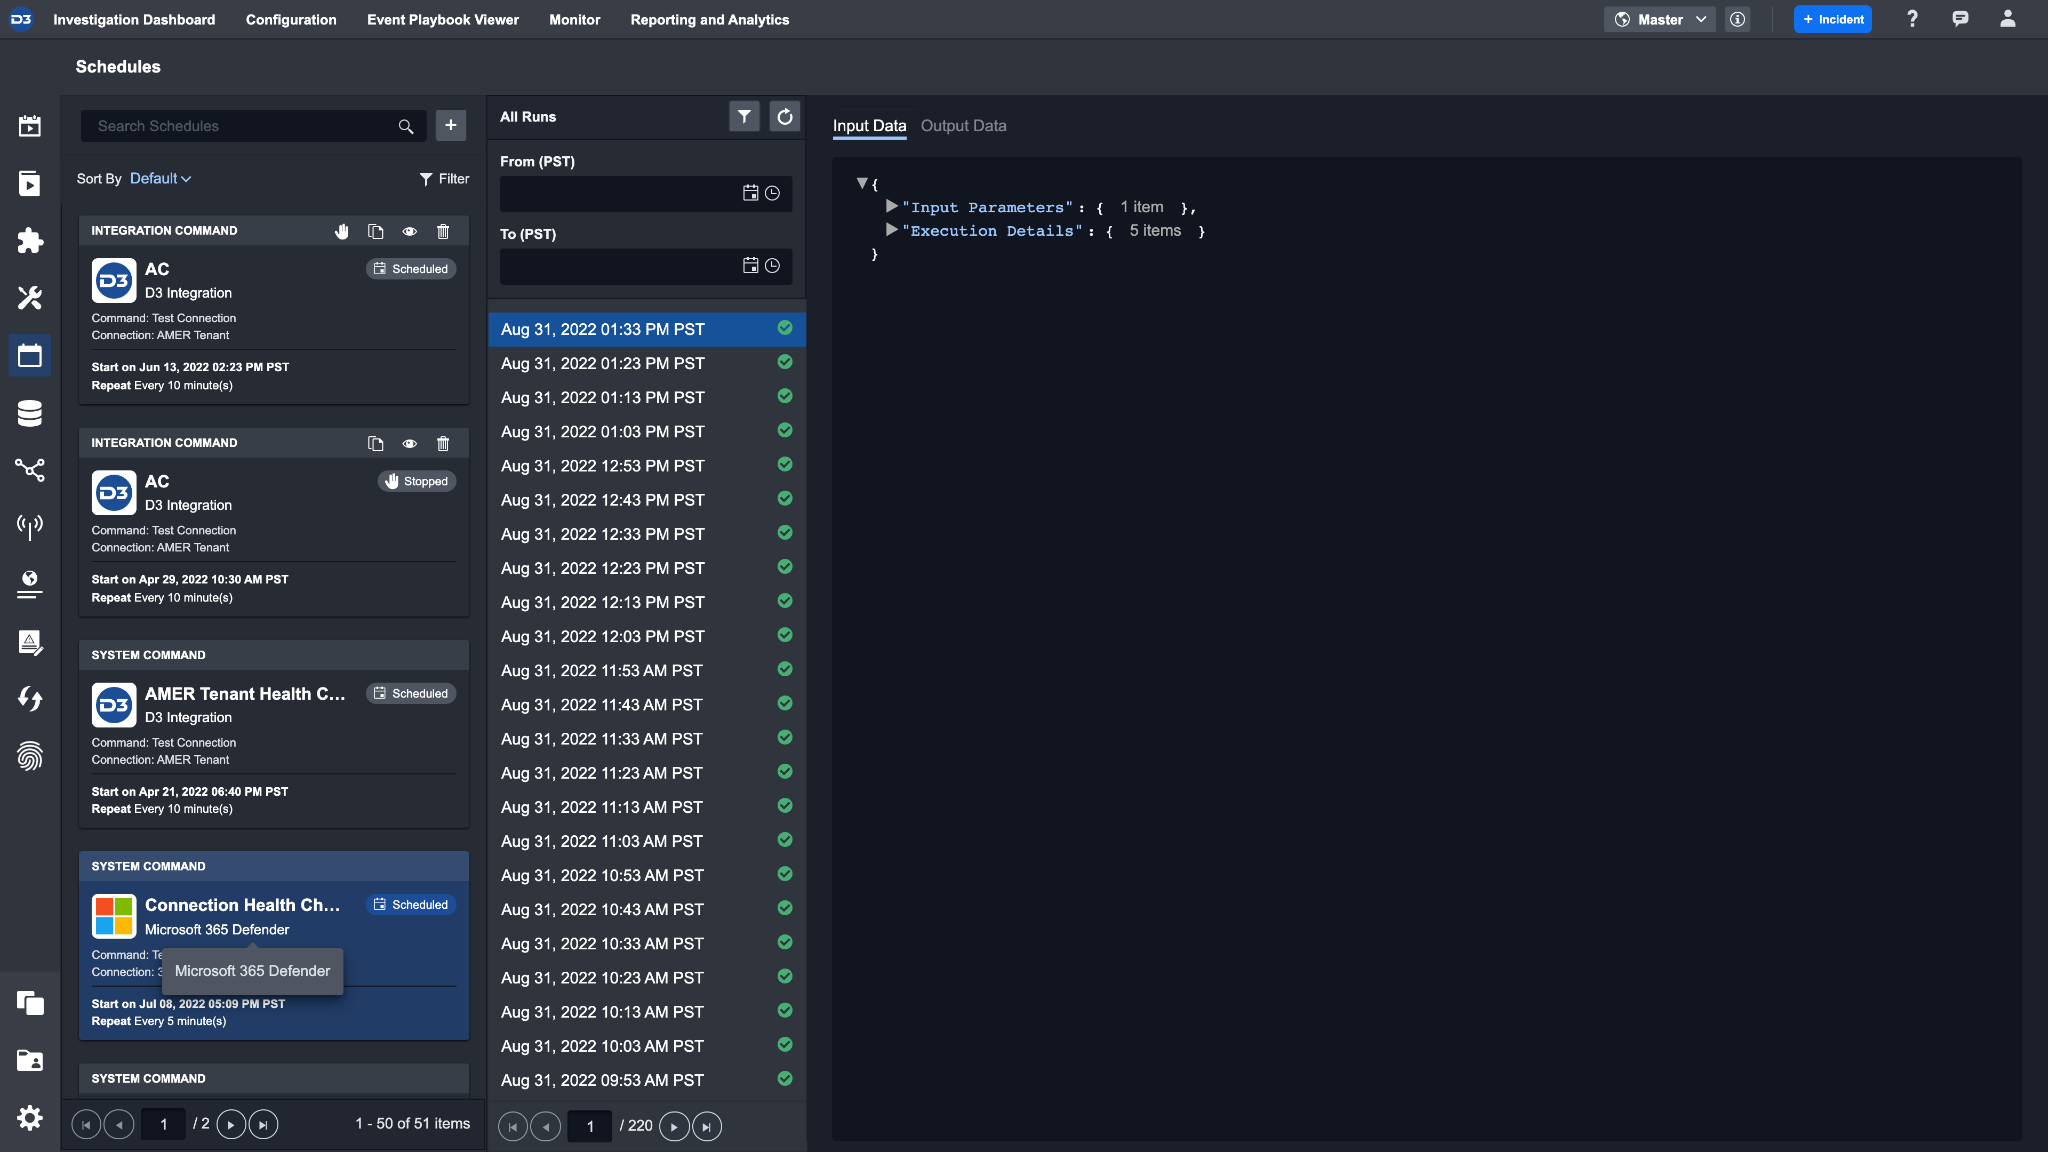
The Schedule Details section allows you to see a complete log of all runs corresponding to the Schedules, as well as their input, output and errors. This is a powerful tool that checks how individual runs were executed and if there are any errors to be immediately addressed.
Run Log
All Runs show a chronological list of all of the command’s runs with date and time information. You can narrow down this log by date range and/or by status using the filters provided at the top of the list. At a glance, you can view if a run was successful by looking at the icon on the right side of the date and time.
Status | Description |
|---|---|
 Done | This indicates that the run was successful and Event data has been received. |
 Error | This indicates that the run was unsuccessful. |
 Running | This indicates that the run is initiated but there are tasks that haven't run yet. |
Information Panels
Individual run details are displayed on the right hand side. Depending on the type of command, different information panels are available for view, such as Playbook and Custom Log. The table below outlines the different information panel and when they are displayed:
Panel | Displays for |
|---|---|
Input Data 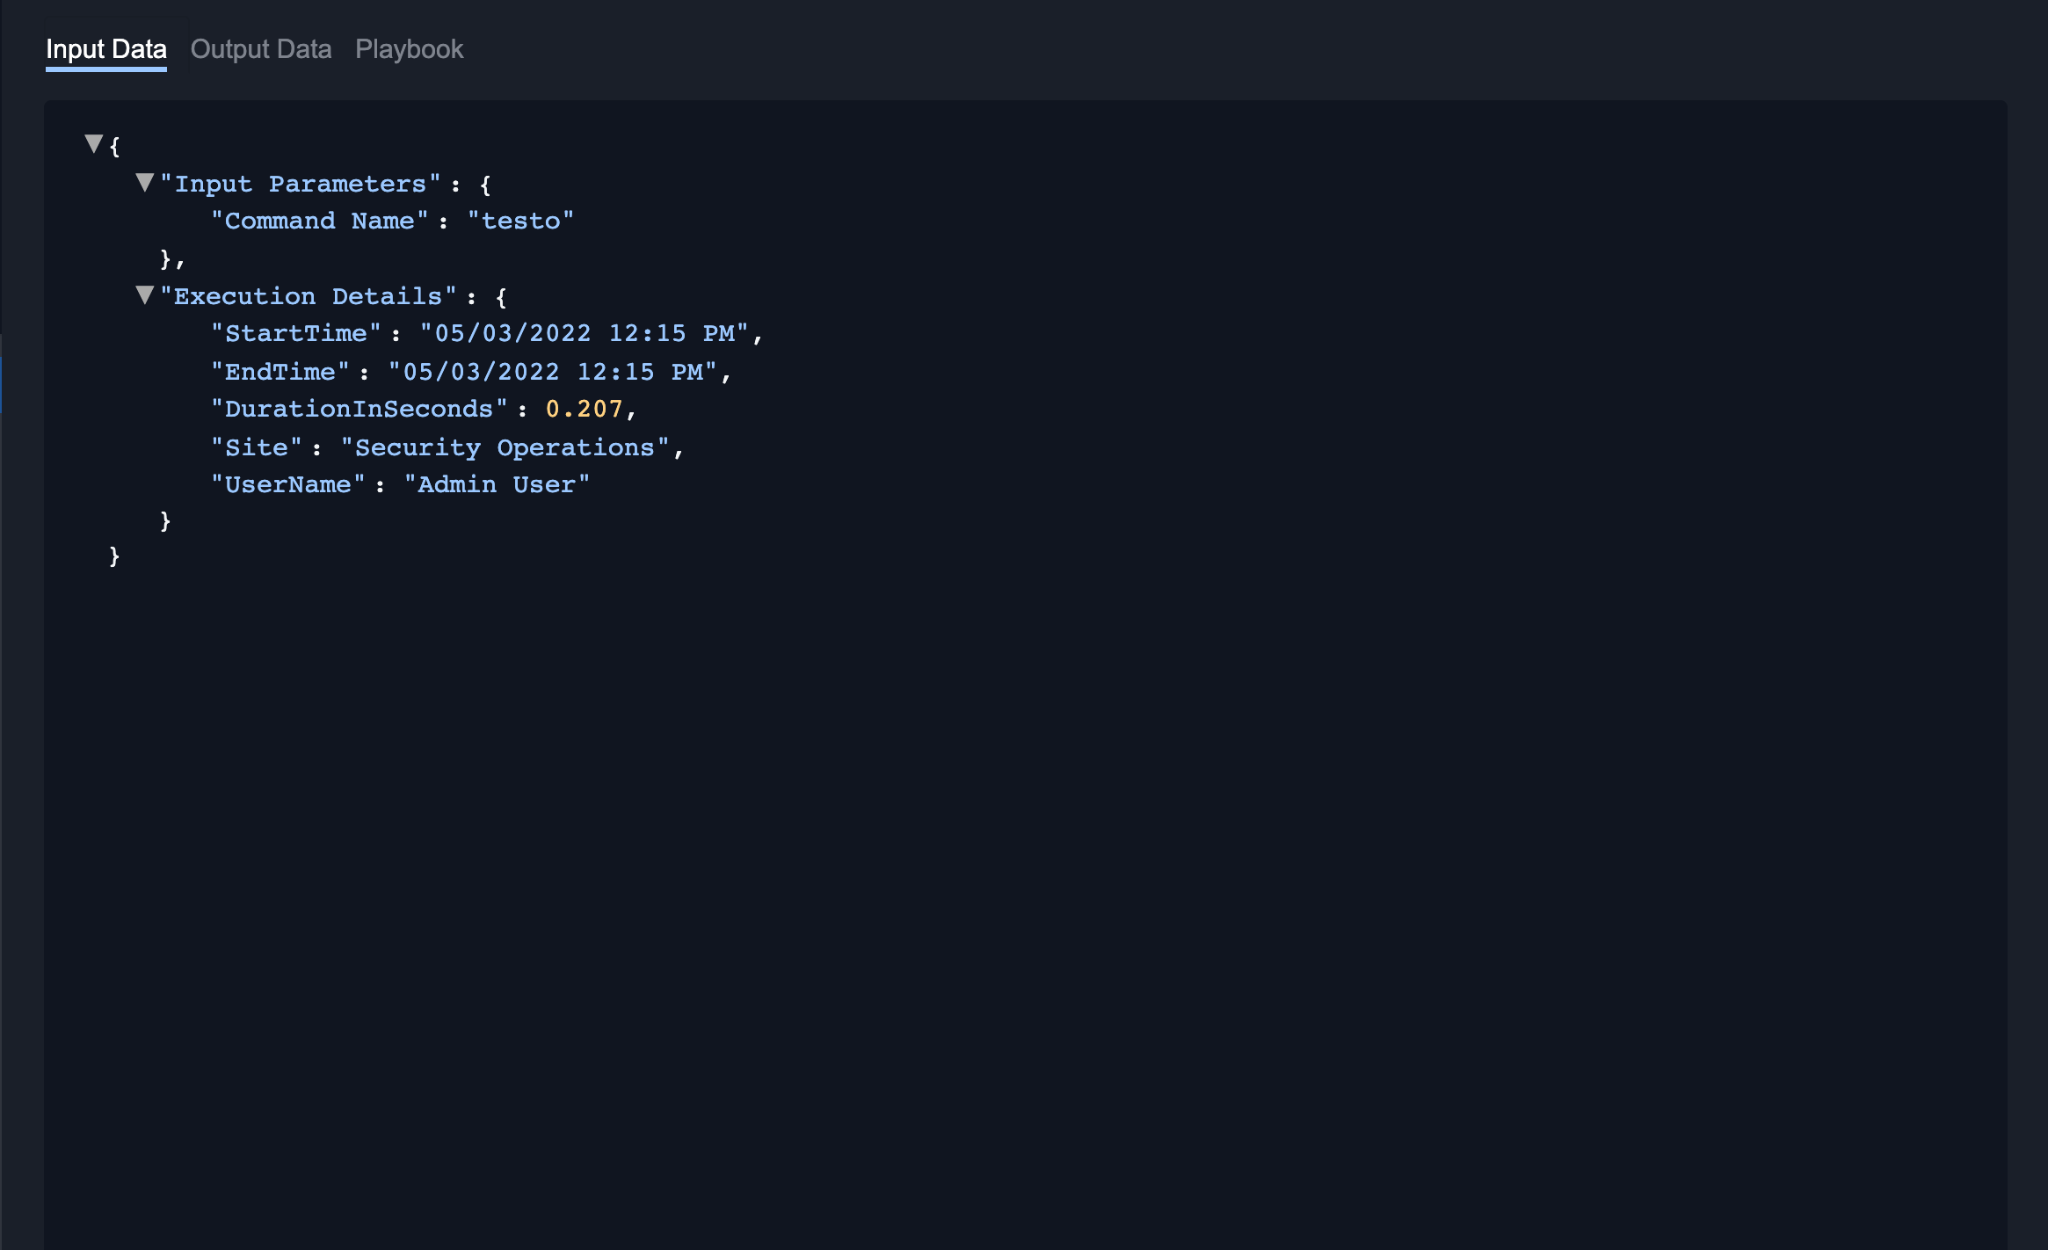 | All schedules |
Output Data 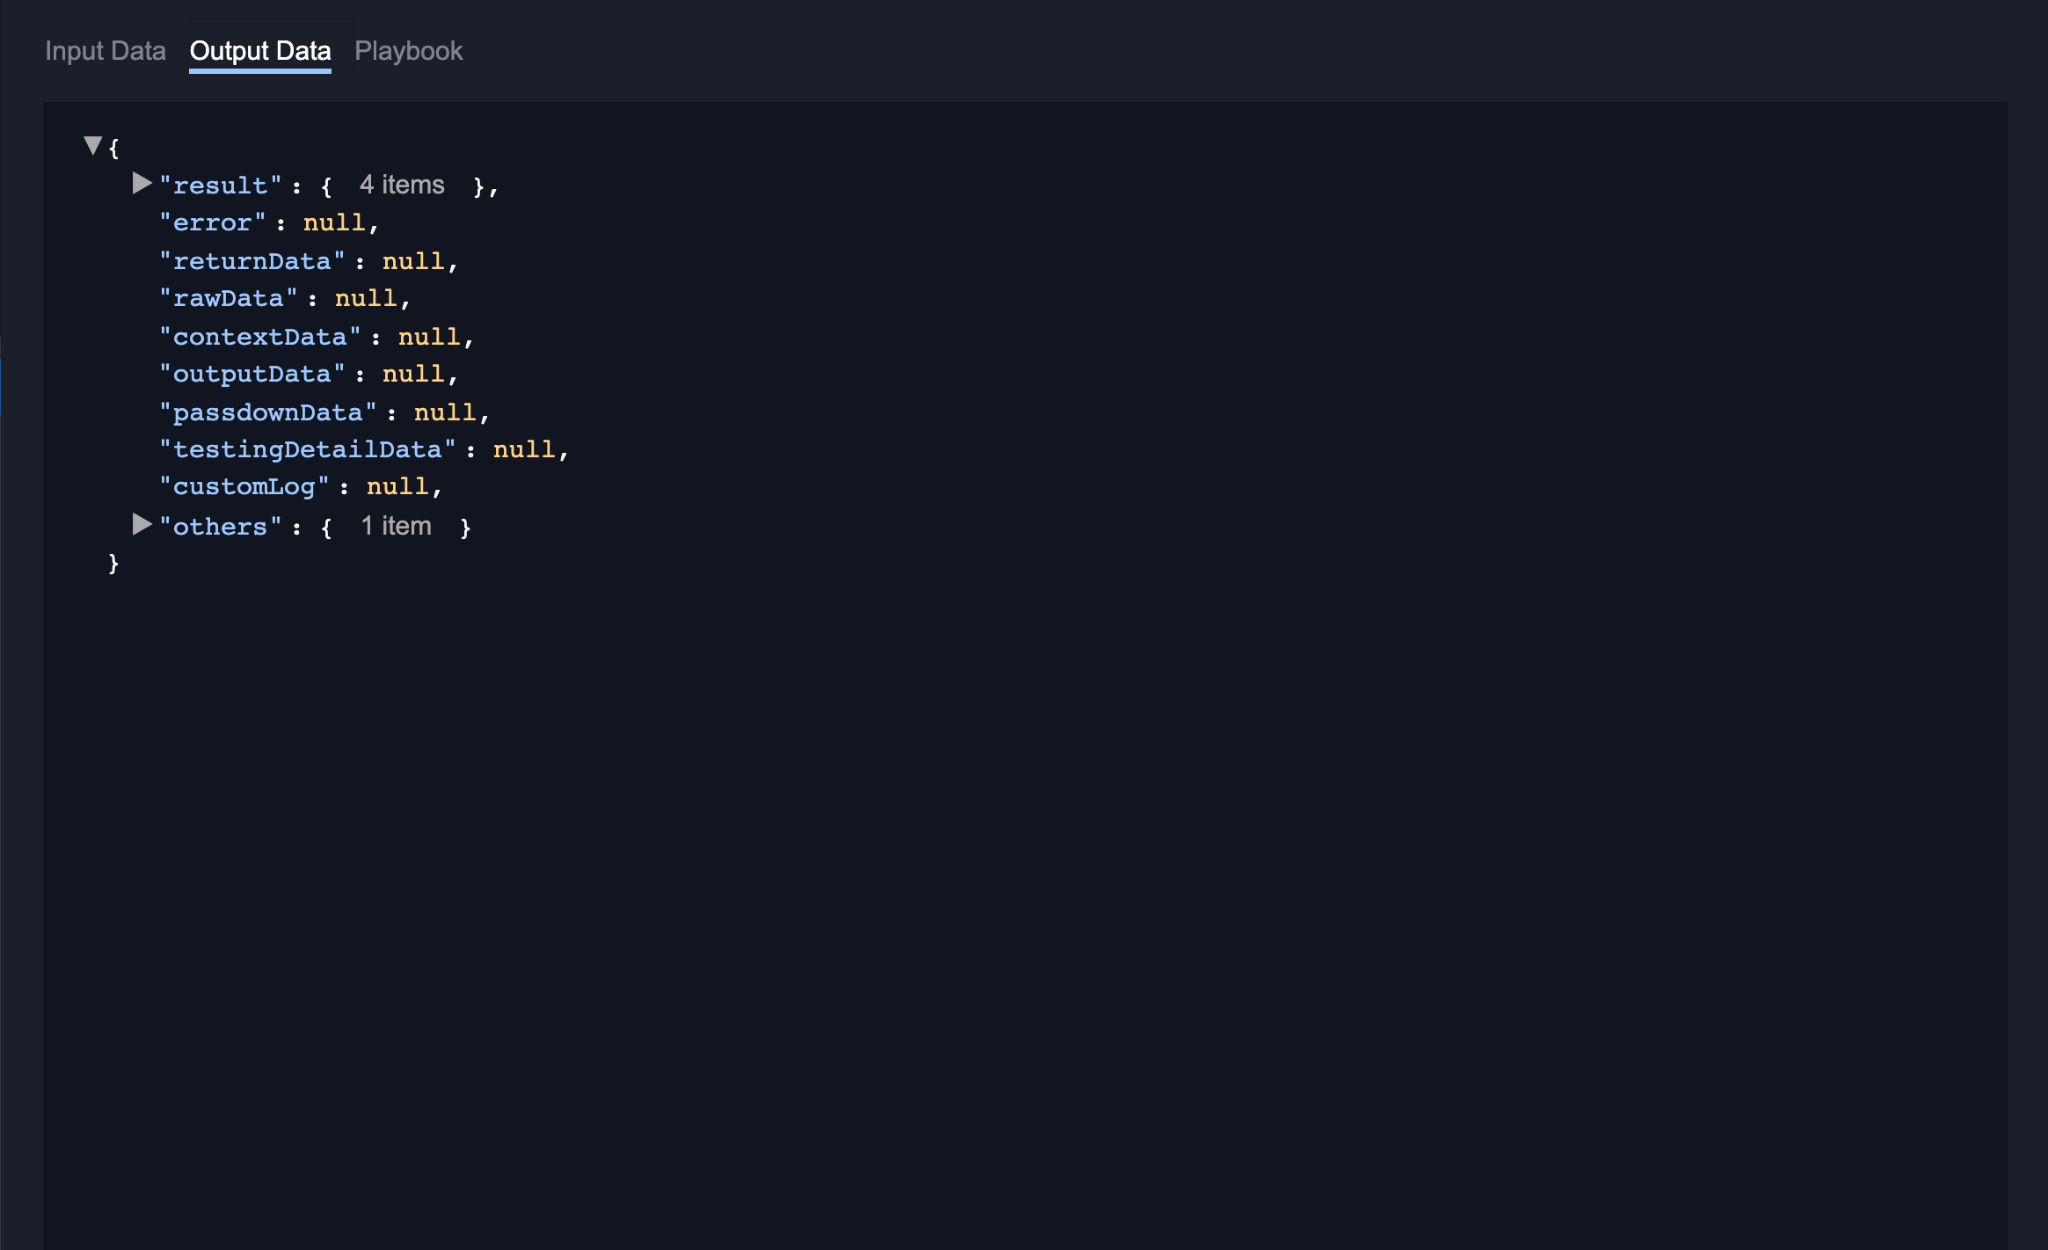 | All schedules |
Error Log 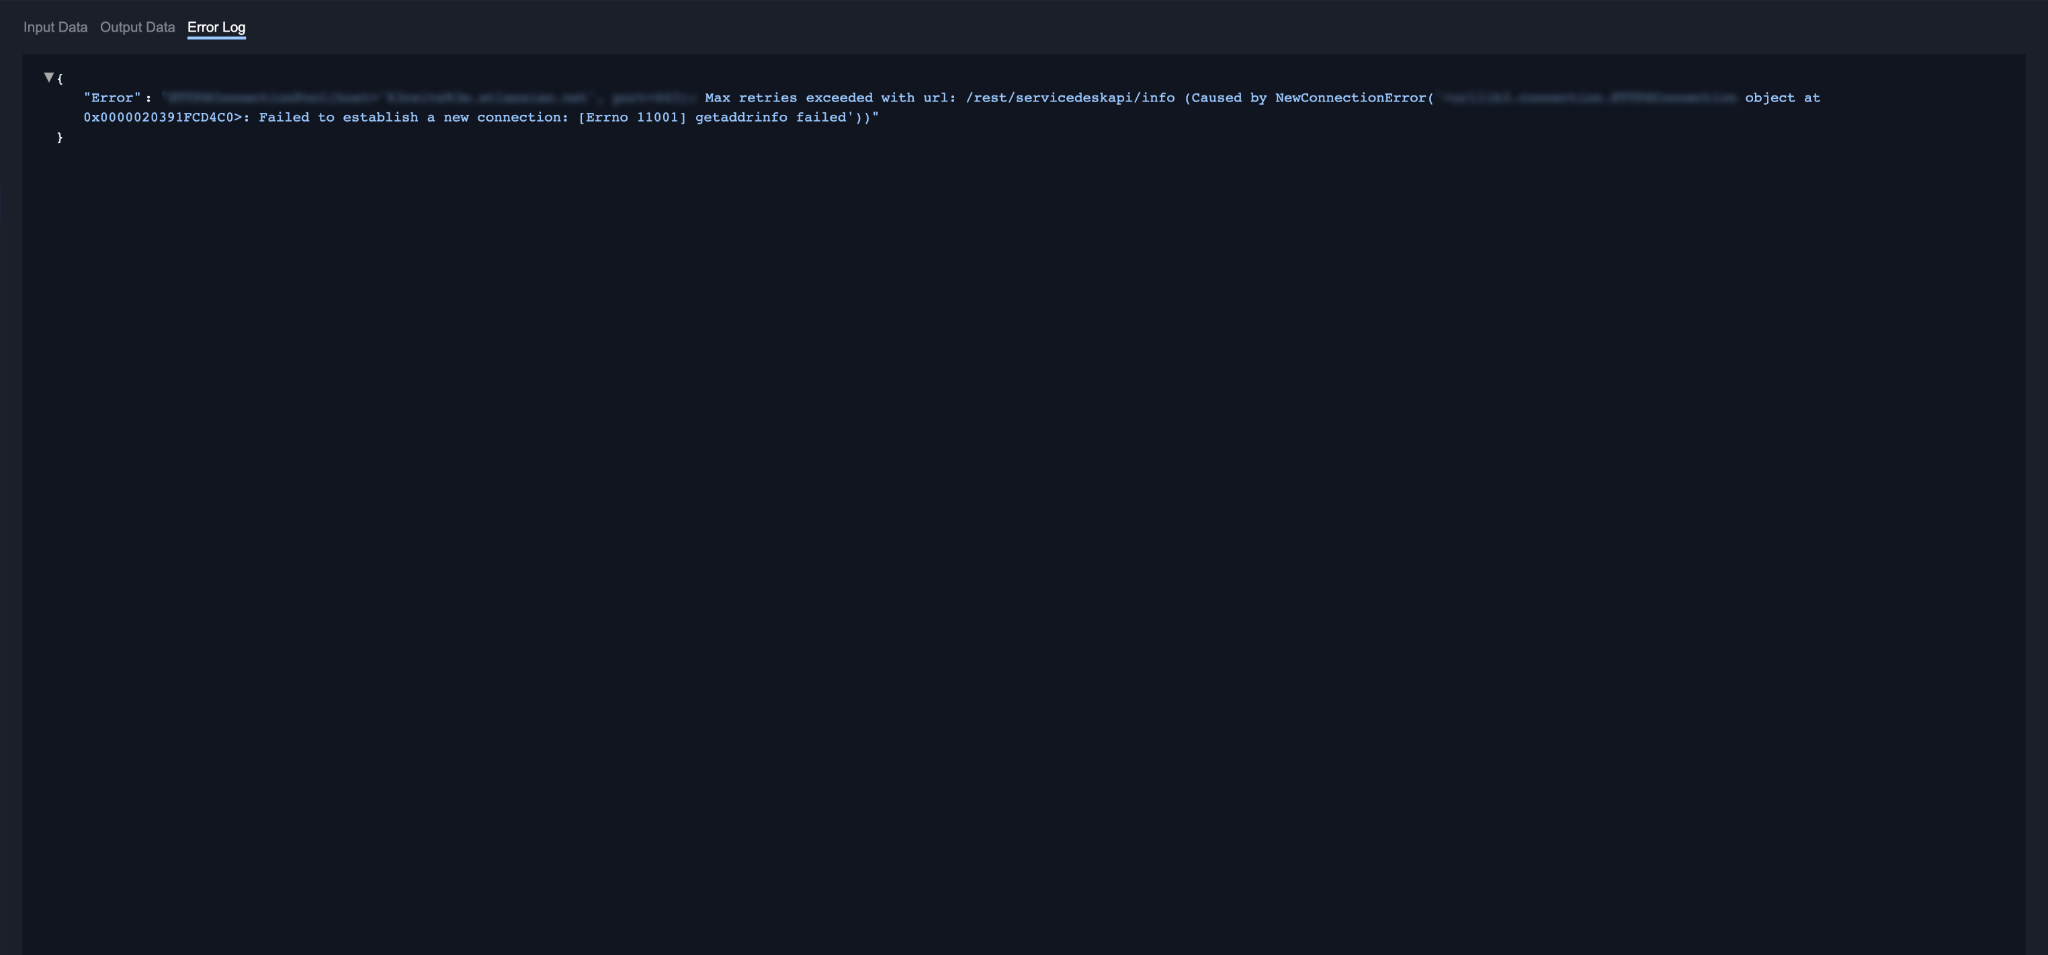 | Schedule runs with error status |
Playbook This panel displays the Playbook configured for a command as it would appear in runtime within the Incident Workspace. 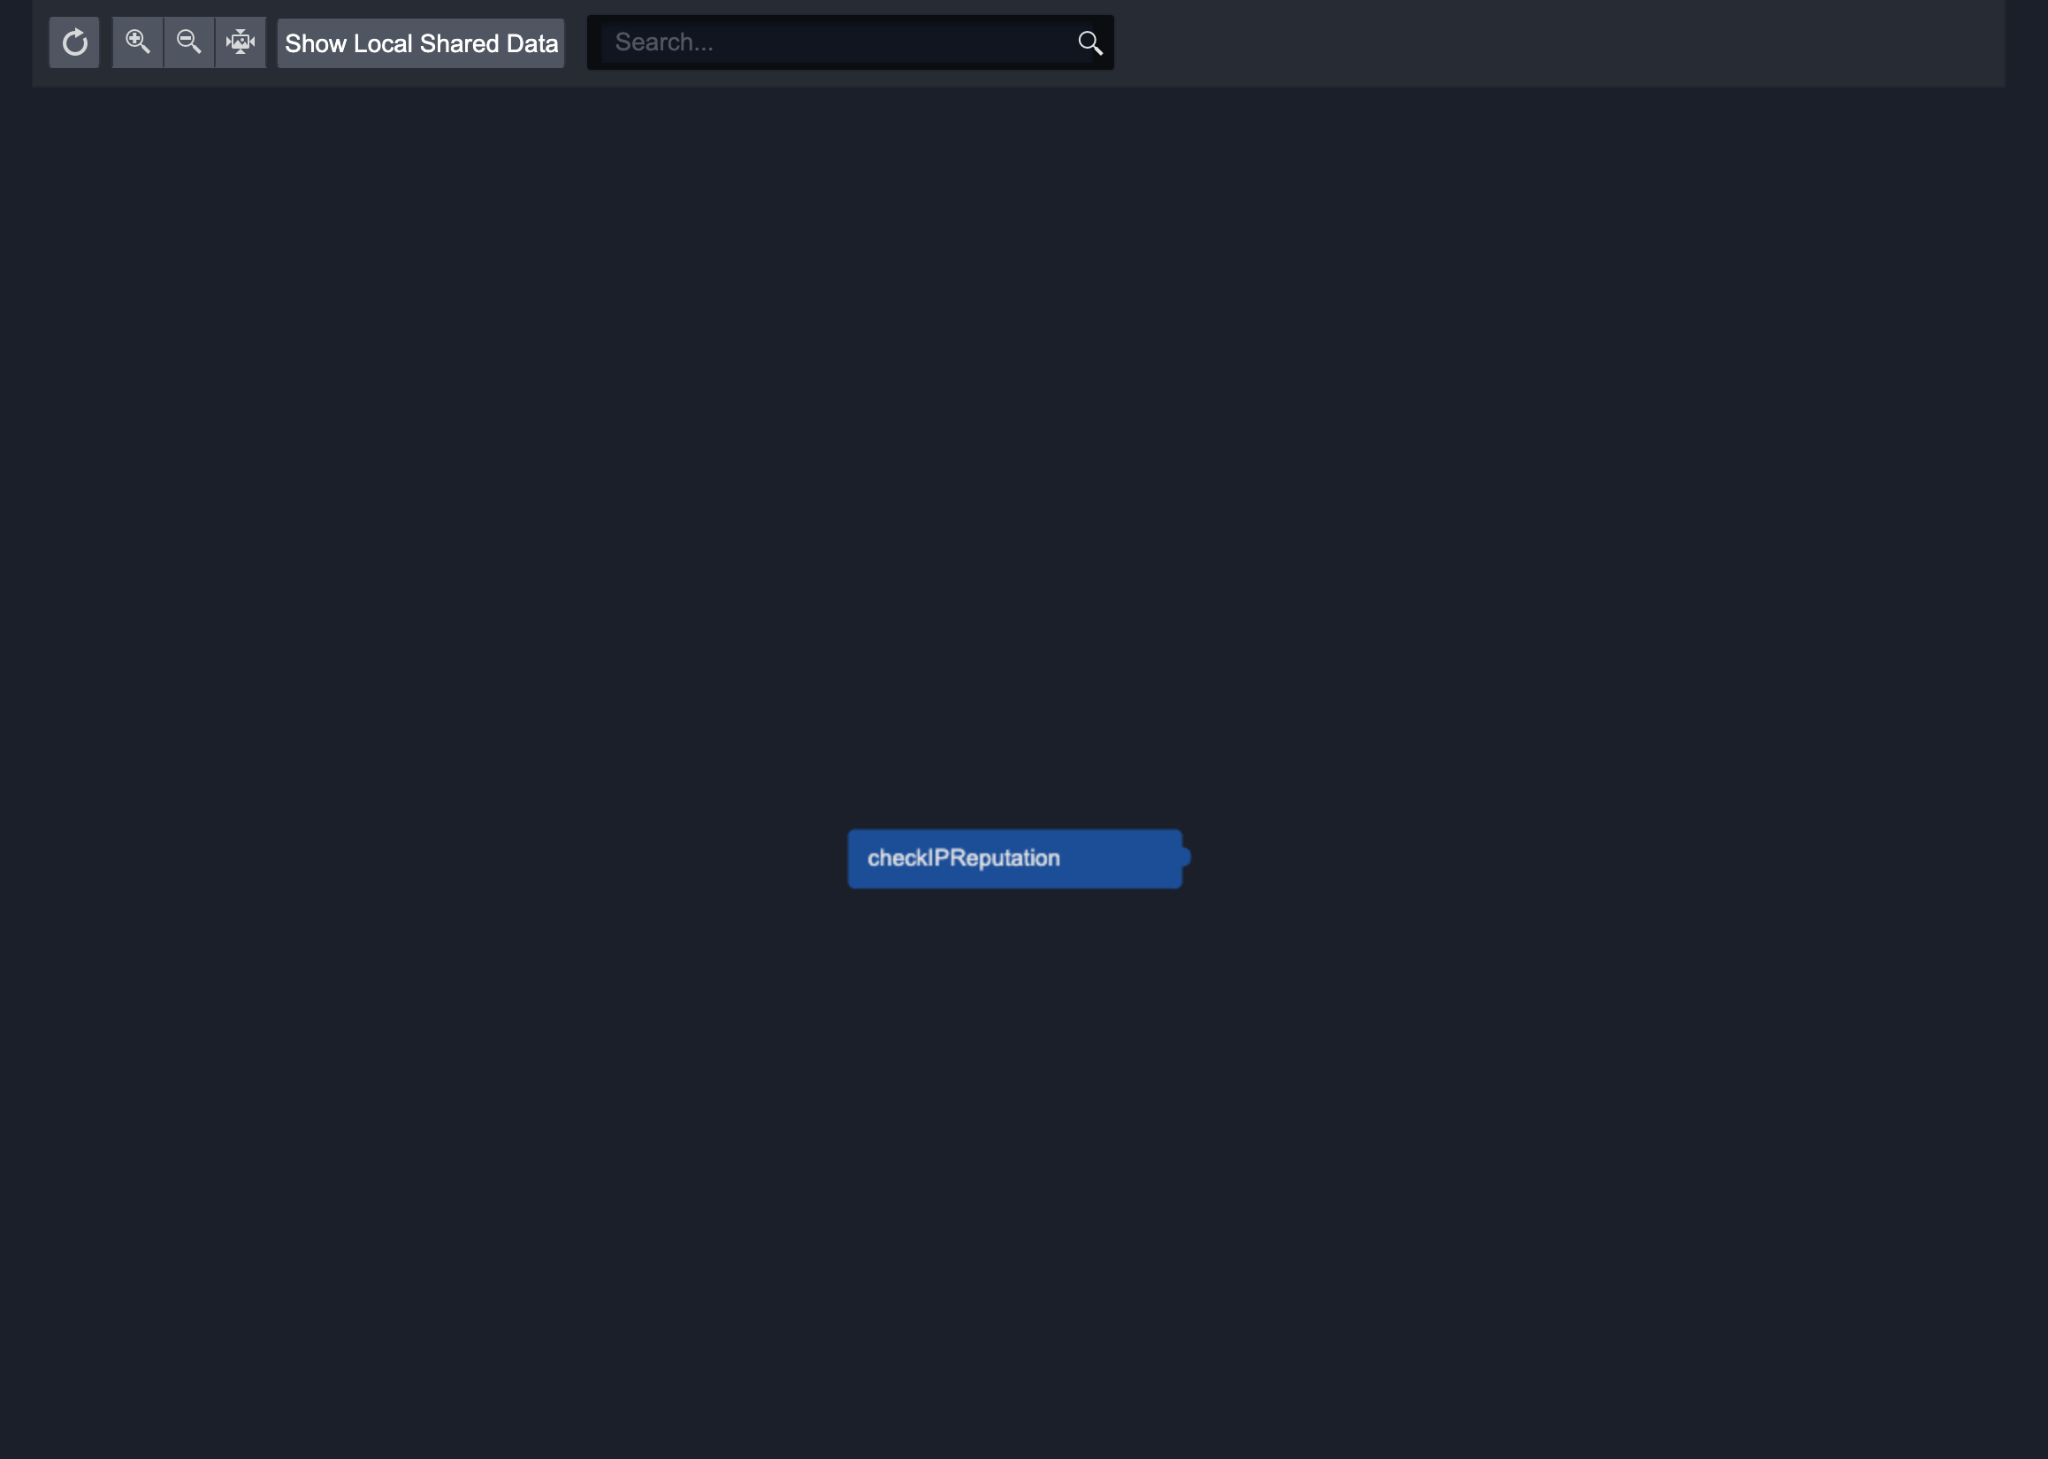 | Custom commands using the Codeless Implementation Method |
Custom Log This panel displays the Custom Log.  | Custom Commands using the Python Implementation Methods includes
|