.png)
Monitor
Overview
The Monitor workspace is designed around the MITRE ATT&CK Framework to provide you with a global view of your organization’s security posture.
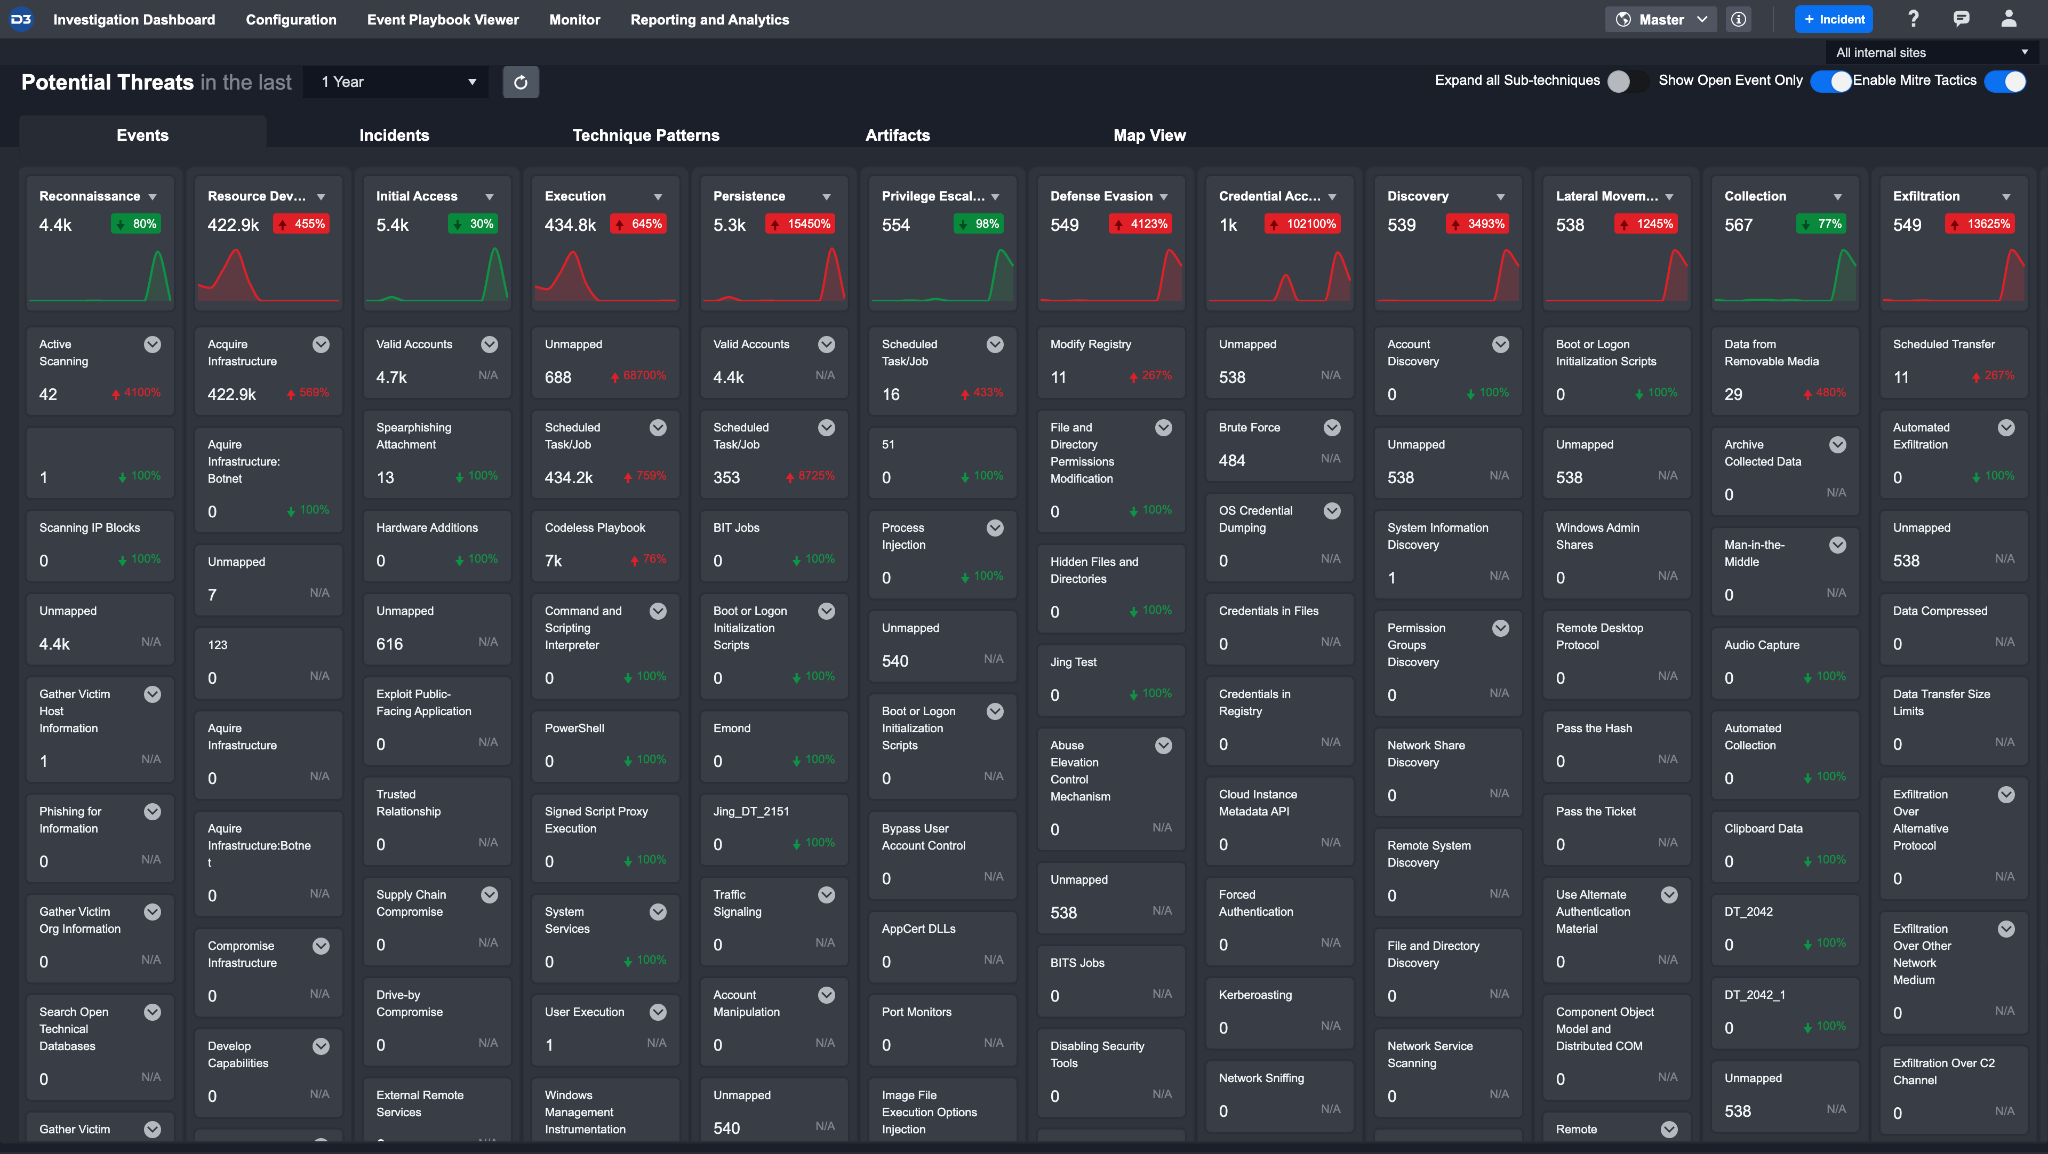
The tabs across the top of the Monitor screen allows you to analyze through five different lenses: Events, Incidents, Technique Patterns, Artifacts, and Map View. Below is a screenshot of the MITRE ATT&CK matrix view of Events.
Reader Note
The count and display of Events, Artifacts and Technique Patterns on each of these tabs will vary depending on the site selected.
MITRE ATT&CK Matrix
All potential threats in the Events & Incidents tabs are categorized in a MITRE ATT&CK matrix view based on their framework found, underlined in ATT&CK Matrix for Enterprise. This view is designed to highlight any large-scale attacks at a glance and guide you to critical threats that require more immediate attention.
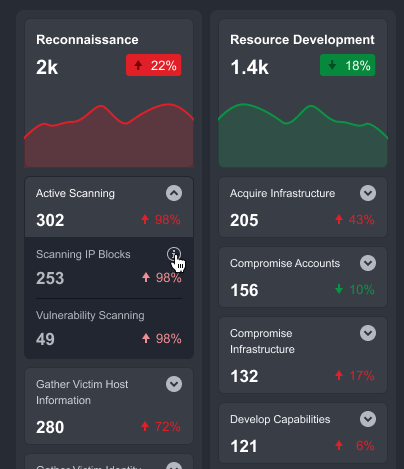
The visualization presented in the Tactics row provides you with a high-level health check of the organization. This visualization helps you quickly identify the number of threats and velocity of change for each underlying Technique over a specific period. You can create custom Tactics, Techniques, and search conditions for more refined categorization, covered in later parts of this document.
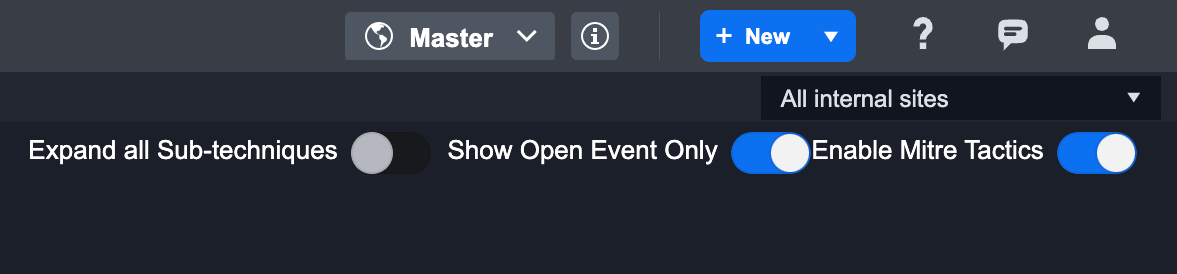
The view of the Monitor Dashboard can be customized by using the toggles on the top right corner, right under site selection. With these toggles, you can Expand Sub-techniques for a comprehensive view, show only Open Events, and enable or disable MITRE Tactics.
Reader Note
The Enable Mitre Tactics toggle is applied globally; if it is toggled off, the user will not be able to use the tactic elsewhere including tagging incidents with tactics.
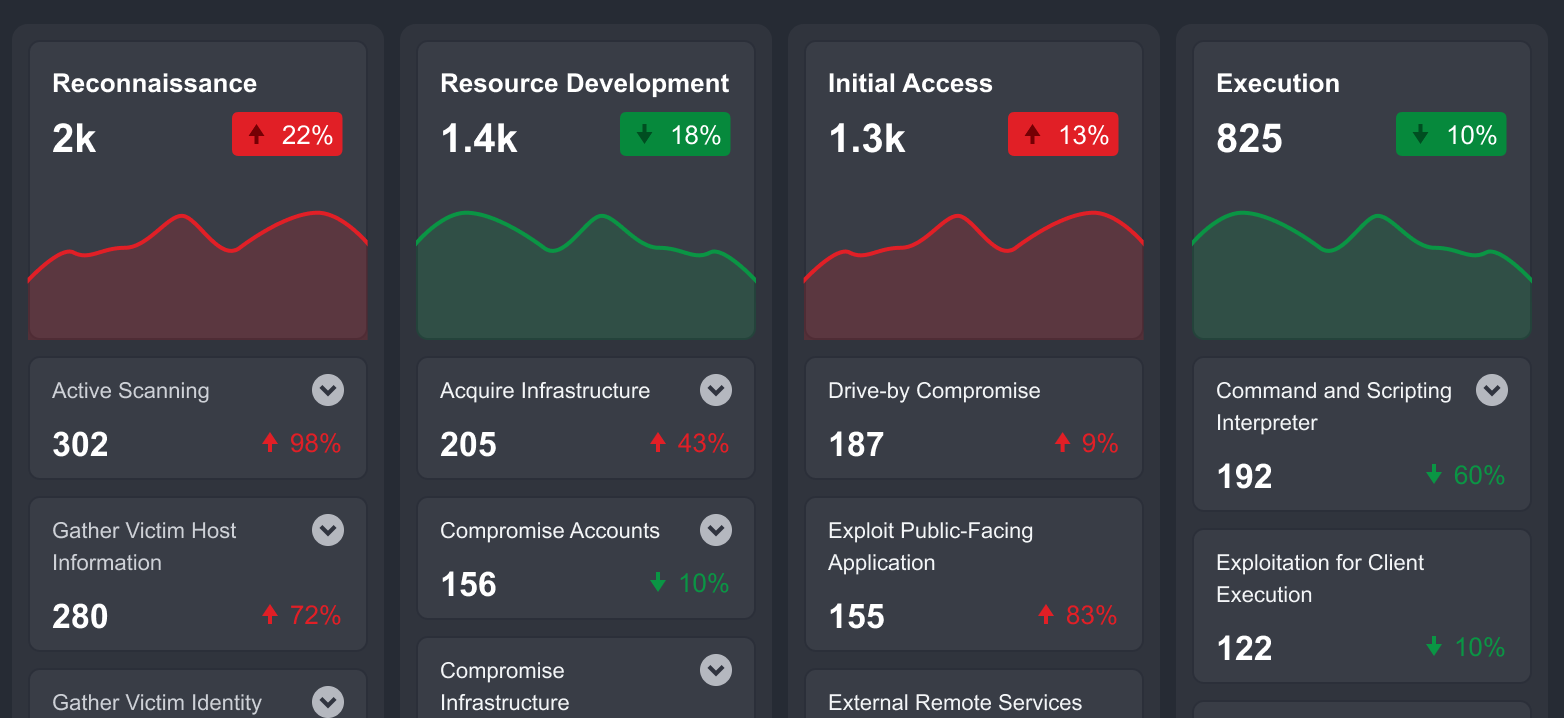
Techniques & Sub-Techniques
Techniques and Sub-Techniques shown below the tactics section have the event count and the velocity of changes. By default, Sub-Techniques are hidden; you can expand each technique to reveal the underlying Sub-Techniques. You can also click on any of the Tactics, Techniques, or Sub-Techniques to configure search criteria.
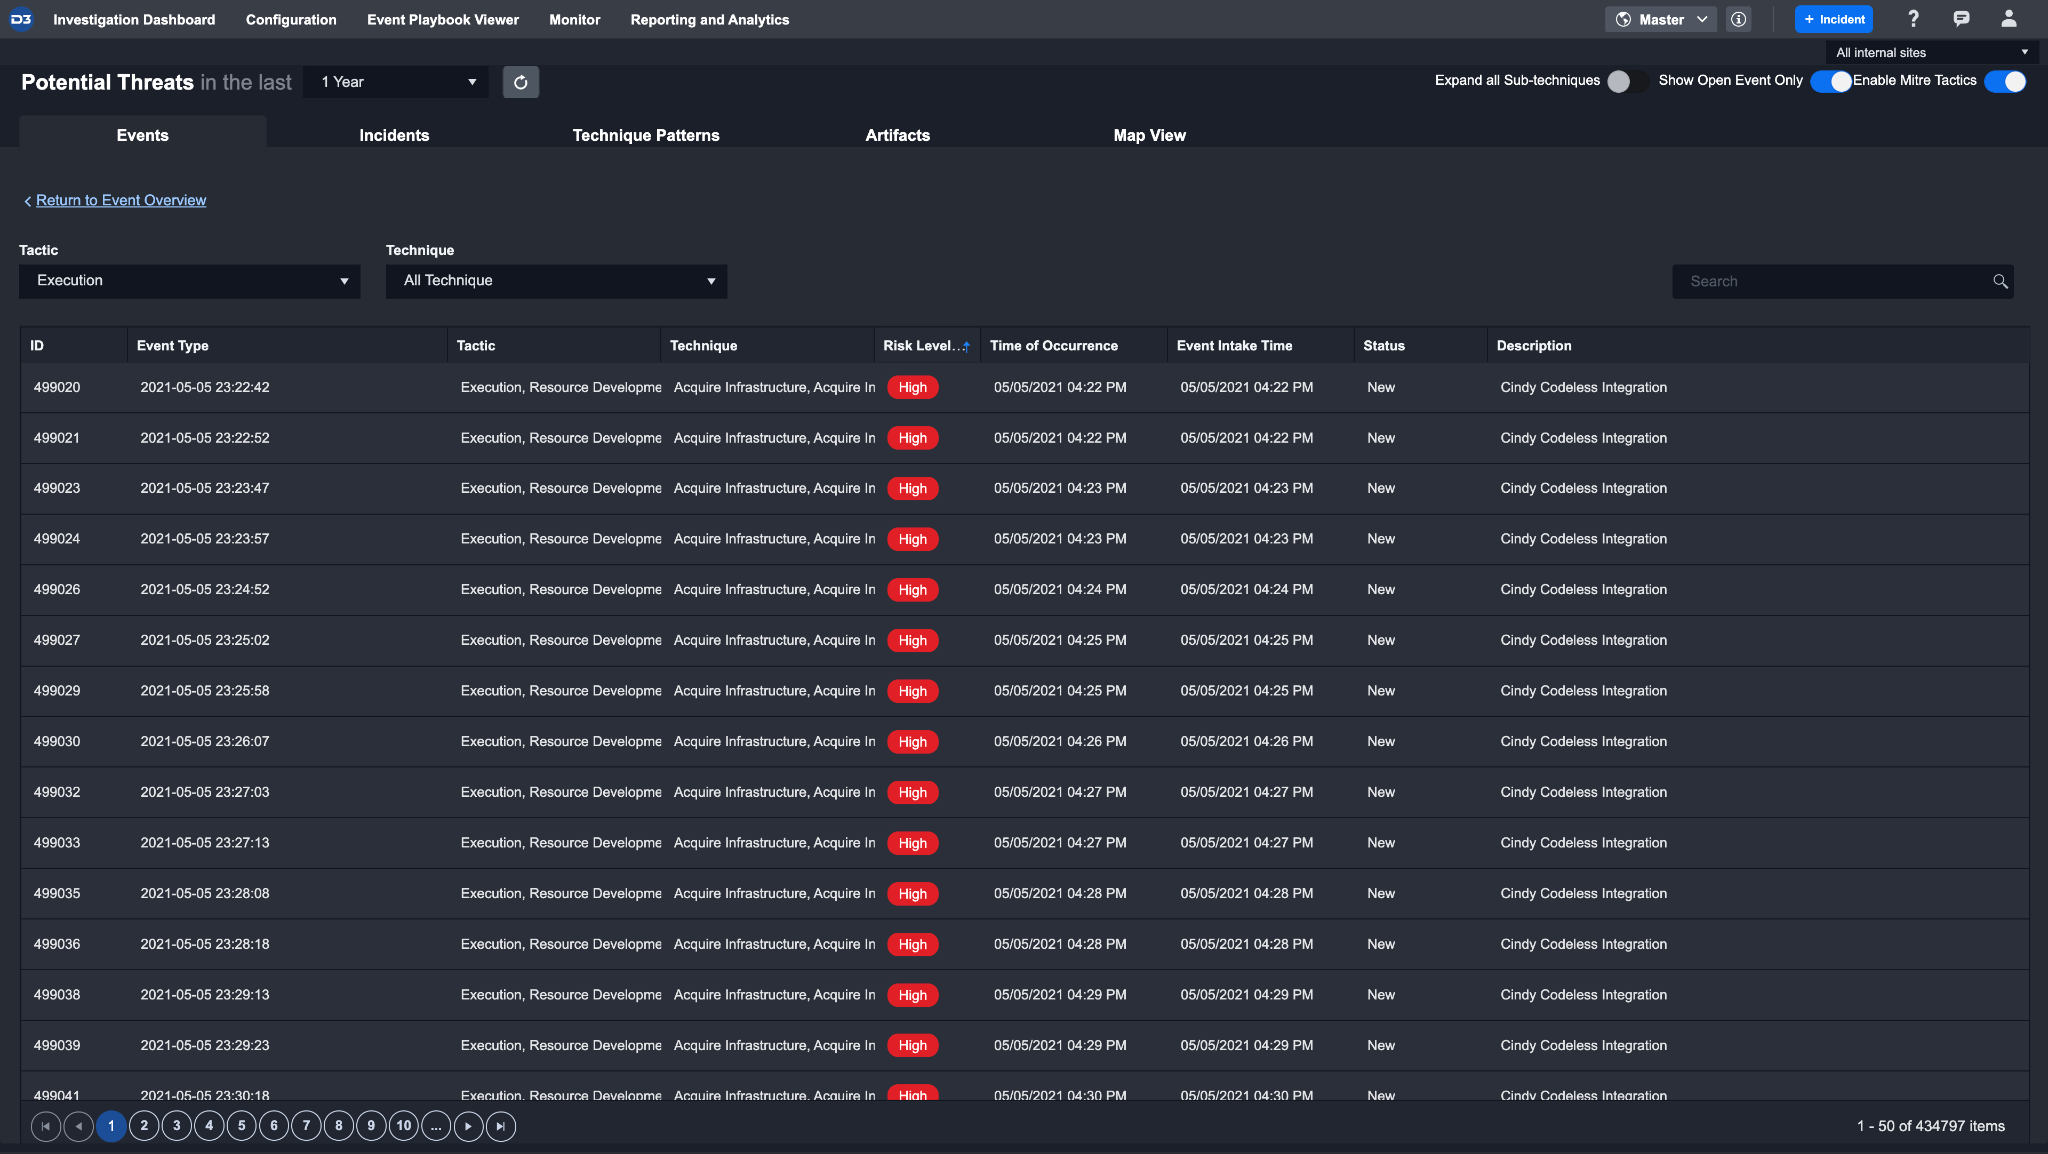
Events
Clicking on a specific Tactic or Technique from the MITRE ATT&CK matrix view will reveal a list of all underlying events. All events in the events list are sorted by their time of occurrence, and the time they were ingested into the SOAR platform. You can select an event to investigate it. Subsequently, you can escalate the event to an incident, or dismiss it.
Creating a New Tactic
The Monitor Workspace is designed to be fully customizable and adaptive to your environment. You can create a new Tactic to use in your investigation:
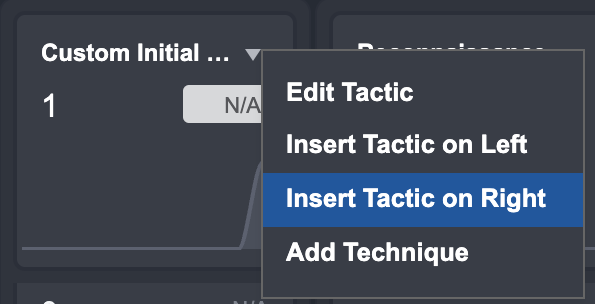
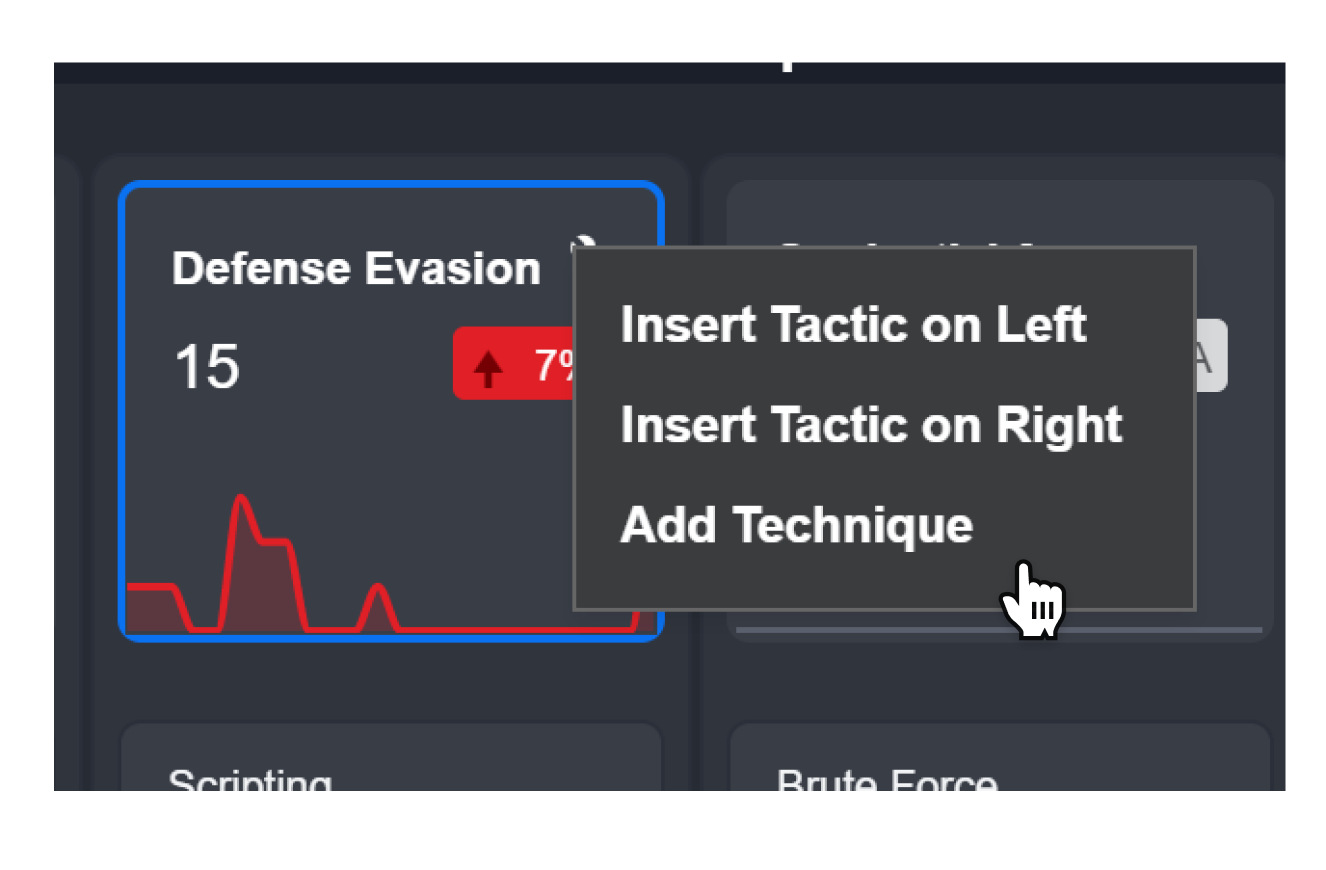
Hover over a Tactic and click on ▼
Select Add Technique from the dropdown menu.
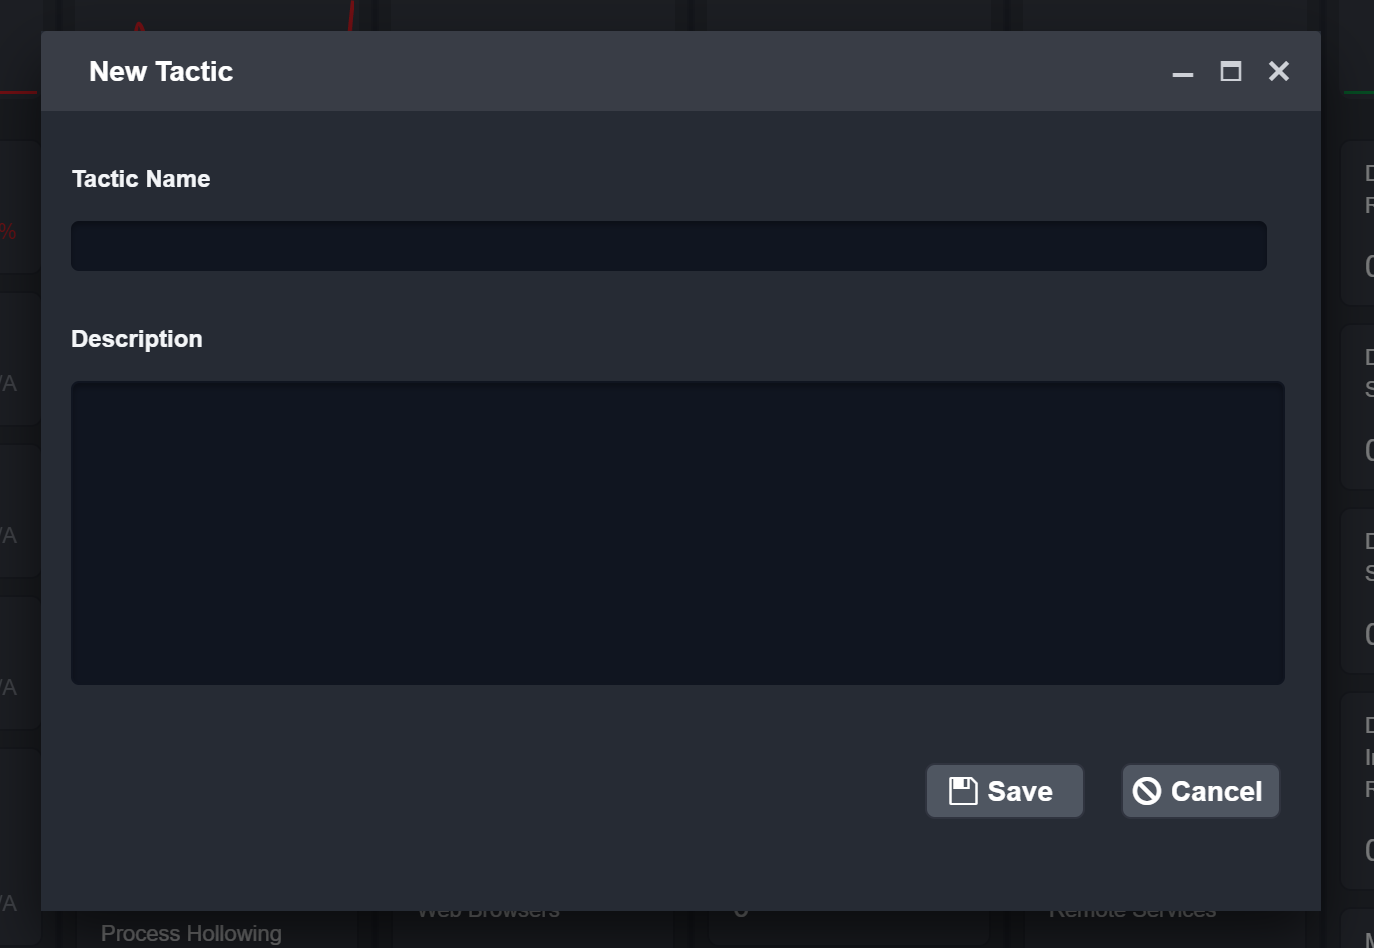
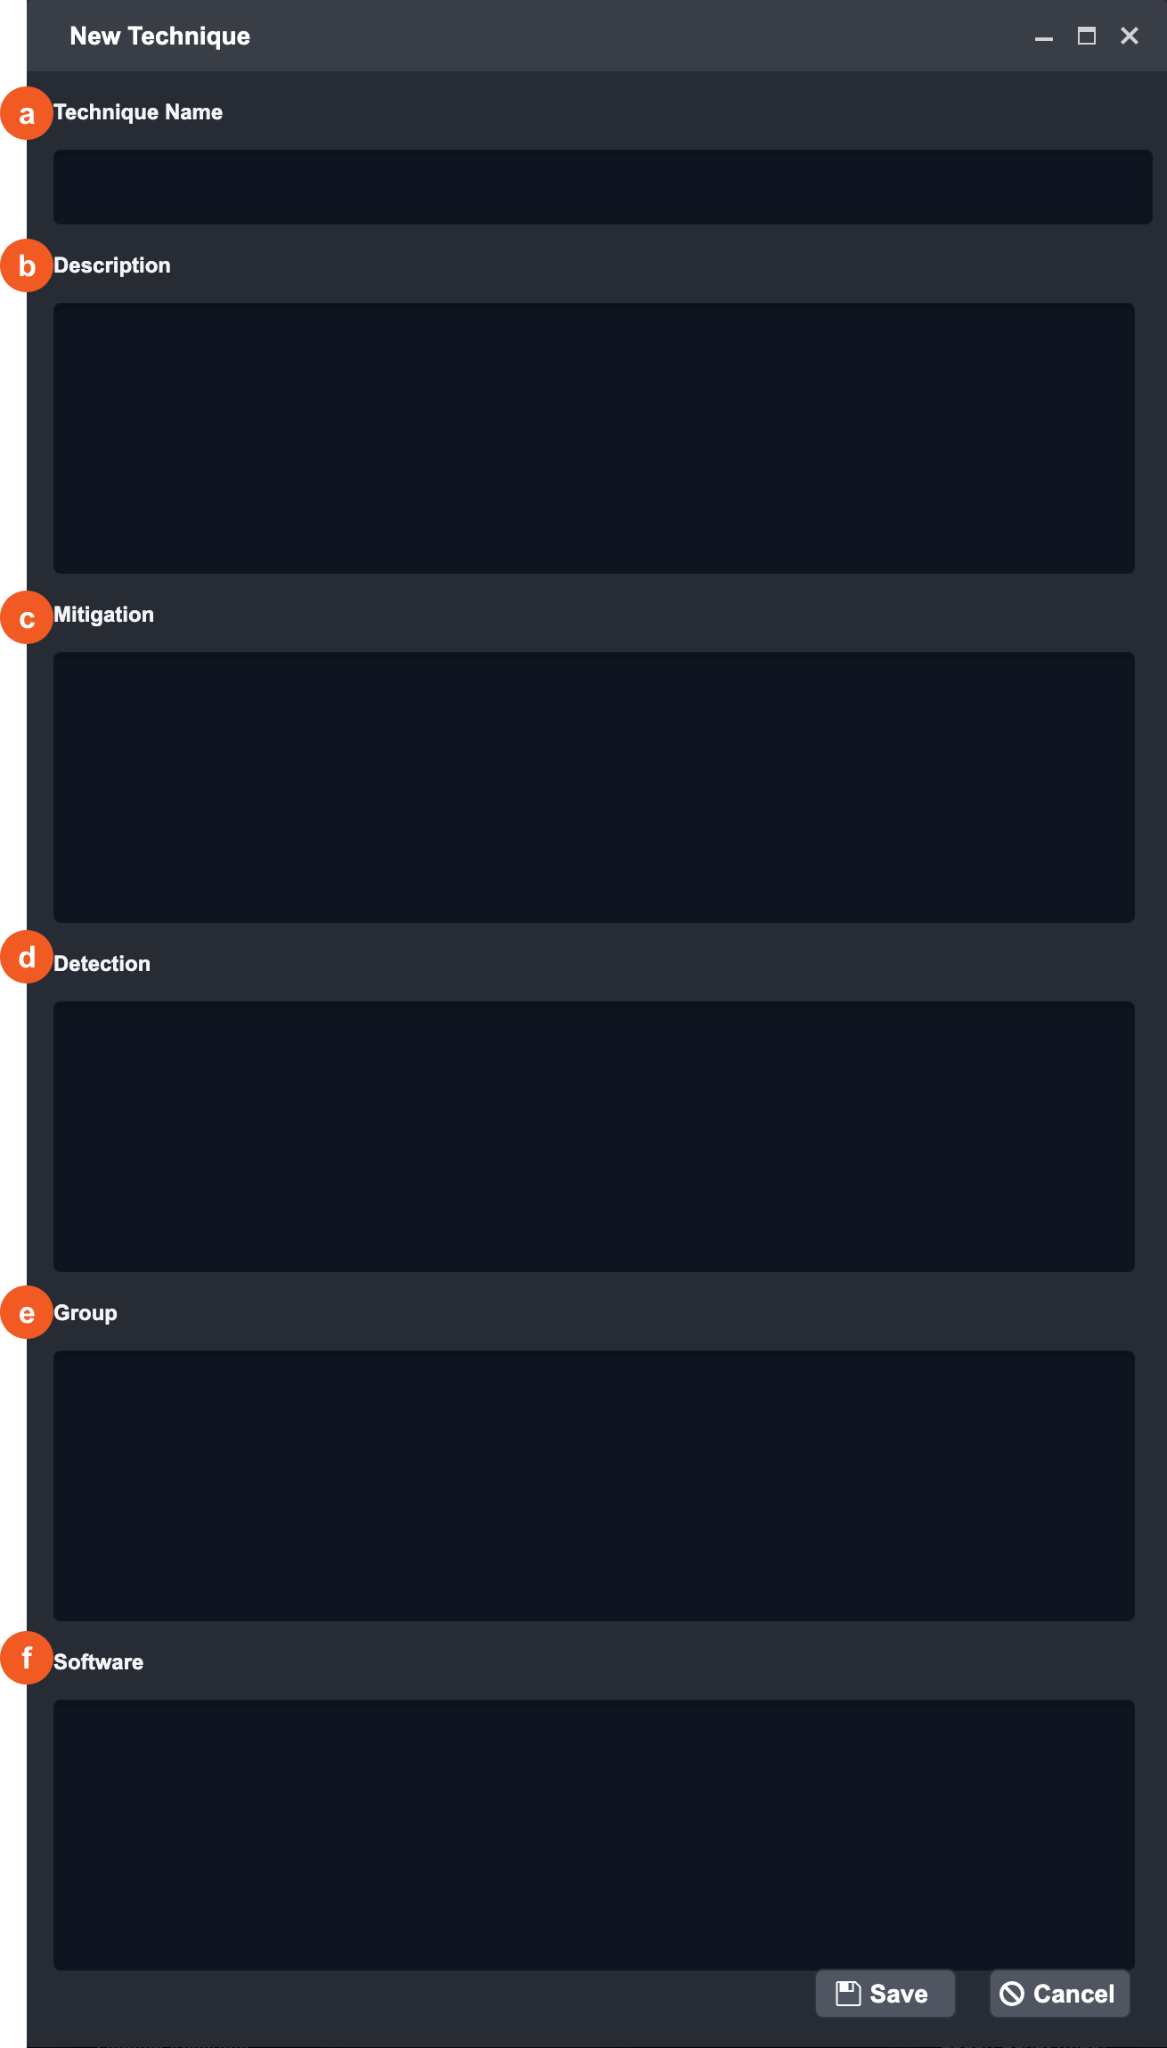
In the New Technique window, enter the following details:
Technique Name
Description
Mitigation
Detection
Group
Software
Reader Note
You can insert Procedure information of a MITRE Tactic & Technique under Group and Software.
Click Save.
Creating a New Technique and Procedure
After a tactic has been created, you can then add a Technique under this tactic. You can also optionally add Procedure information that belongs to this technique.
|  |
Reader Note You can insert Procedure information of a MITRE Tactic & Technique under Group and Software.
|  |
Creating a Technique Search Criteria
You can add specific search criteria(s) to both system and custom Tactic-Technique-Procedures (TTP). The search criteria determines an event’s TTP label when it is ingested – that is, once the search criteria is created, all newly ingested events that satisfy the search criteria will be labeled with the respective TTP.
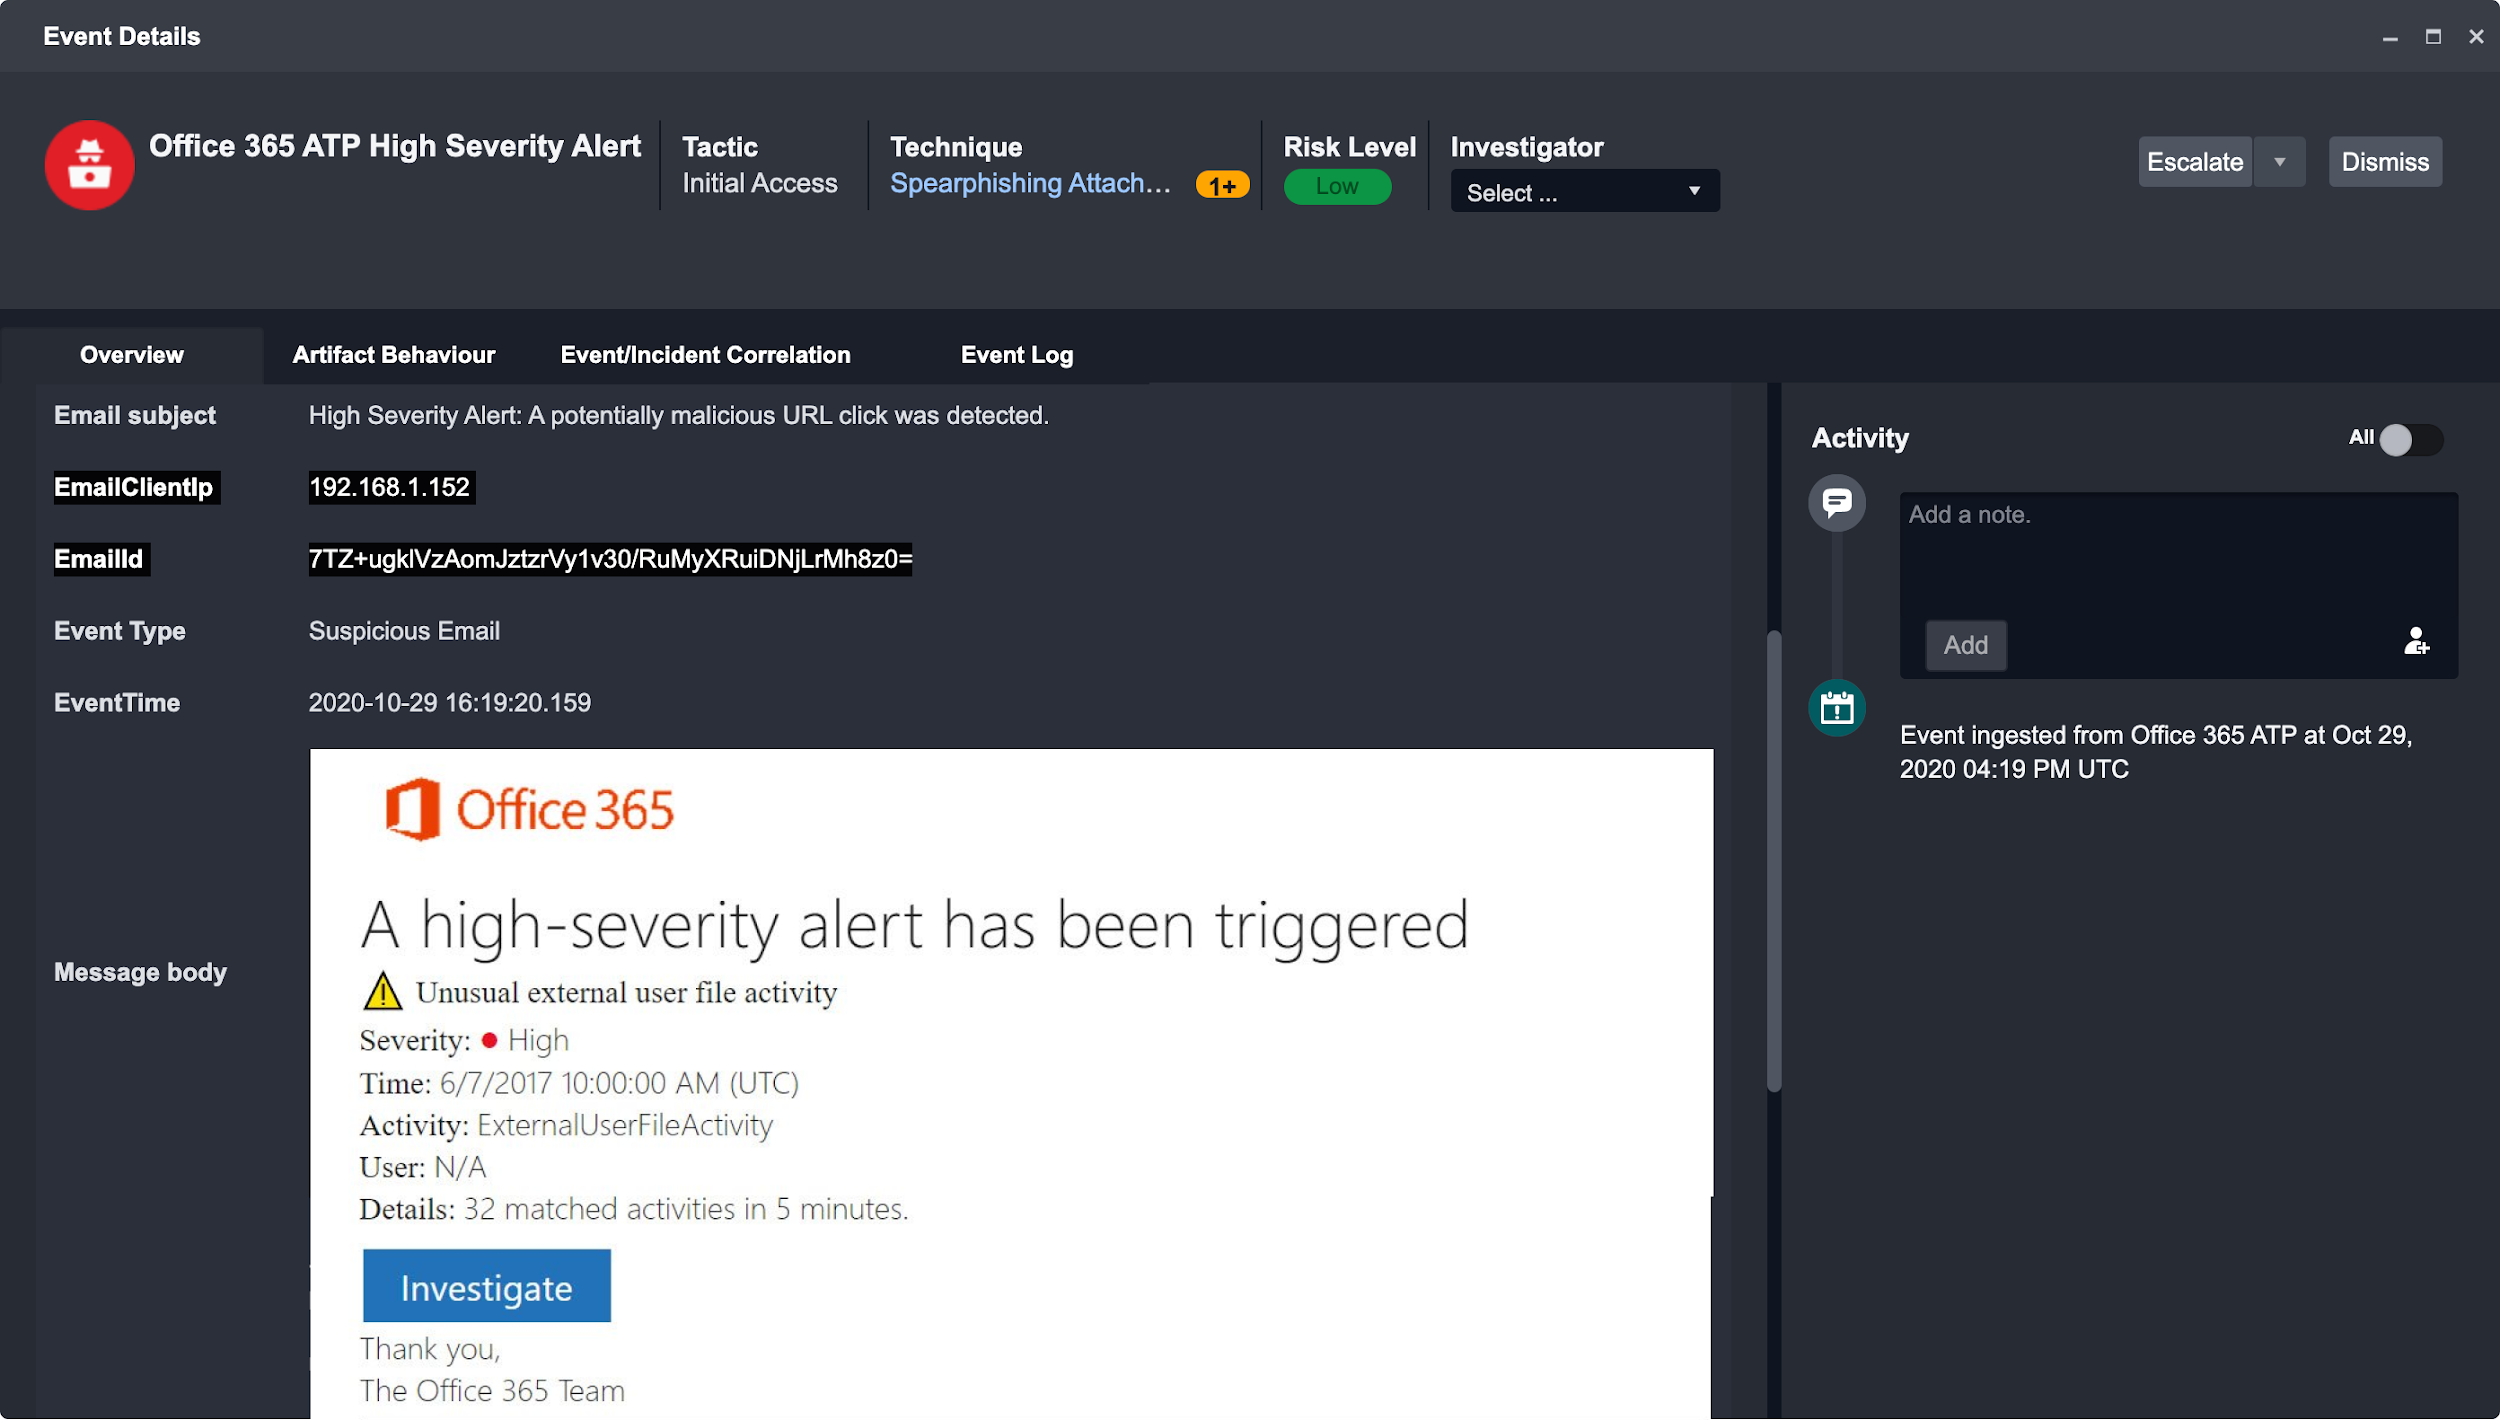
The example below outlines the steps to add a search criteria to the Spearphishing Link technique for Office 365 ATP alerts.
In this example, Office 365 ATP alerts are being automatically ingested to D3 SOAR to create an Event. The search criteria will be looking for a Spearphishing Link Event that generally has the description in the Email Subject as “A potentially malicious URL click was detected.”
To map all new email alerts of this type to the Spearphishing Link technique:
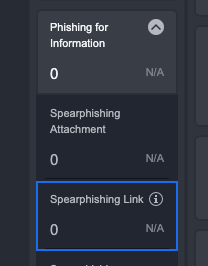
Expand Phishing for Information under the Reconnaissance Tactic in the Events tab.
Hover over the Spearphishing Link Technique and click on ⓘ to open up the Search Criteria editor.
Click + Create a New Search.
In the New Search window:
Search Name: Enter a name for the Integration.
Example - Office 365 Email Alerts
(Optional) Description: Enter a short description for this query.
Example - Malicious URL Clicks captured by Office 365
Risk Level: Set the risk level for this query.
Example - High
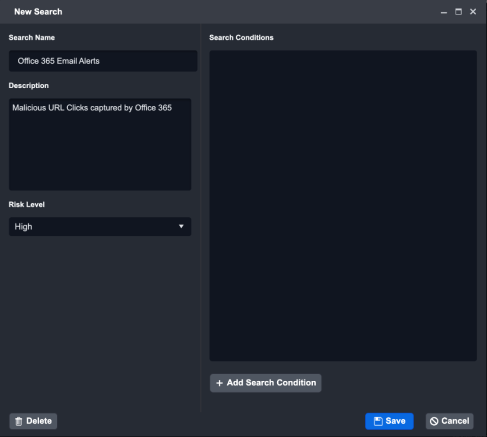
Click + Add Search Condition
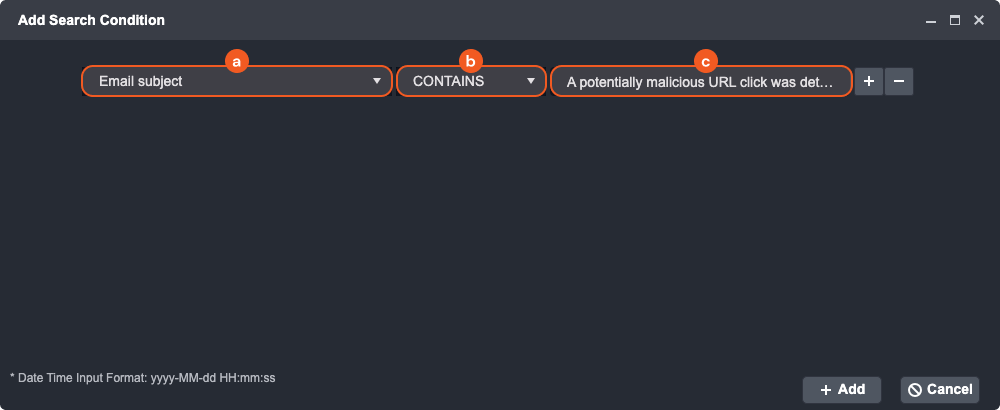
In the Add Search Condition window:Click on the Field dropdown and select Email Subject
For the Operator dropdown, select CONTAINS.
Type “A potentially malicious URL click was detected” into the Value input field.
After adding all search queries, click the + Add button.
Reader Note
The observable condition operators are dependent on the event field type selected.
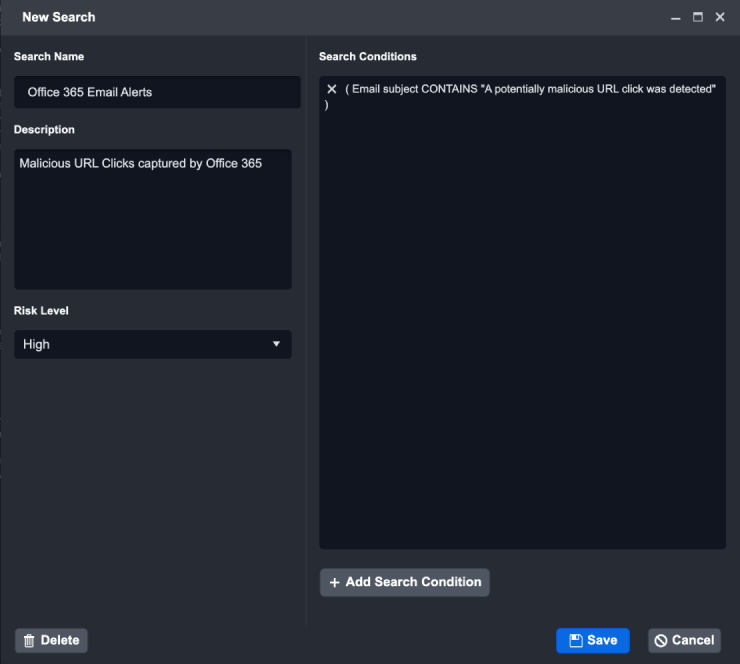
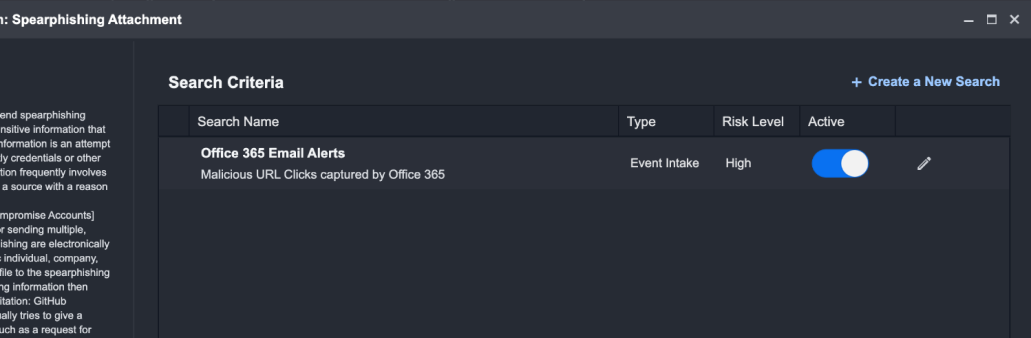
Review all the search queries in the New Search window, then click Save.
Activate this new search query by enabling the Active toggle.
Reader Note
As a best practice, when building a custom Tactic-Technique-Procedure (TTP) search criteria, first analyze a few sample events. From the event data, look for specific fields and values that help generalize the characteristics of the events to then mark as a certain TTP group.
Viewing and Editing a Technique Search Criteria
You can also view the search criteria for any existing Techniques by clicking ⓘ on any Technique card. This provides transparent visibility into the underlying criteria used to surface the Events.
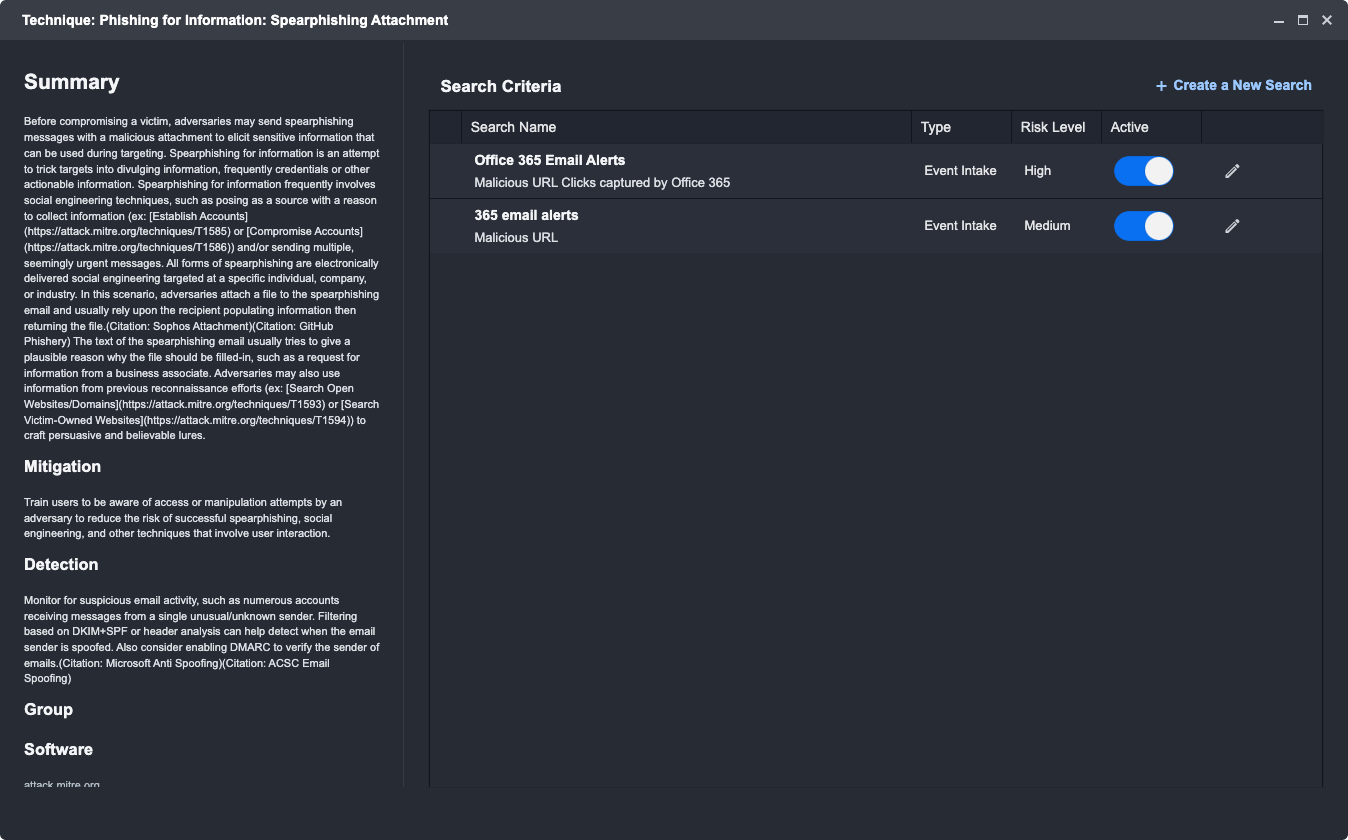
You can edit and enable/disable existing search criteria. Clicking on the pencil icon will bring up the same Search Query windows as mentioned above.
Reader Note
Please note that all system search criteria are view-only; user-created criteria can be edited.
Incidents
The same MITRE ATT&CK Framework is available from the Incident perspective in the second tab. The key difference in this view is that your team or an automated event escalation rule have validated the threats shown here.
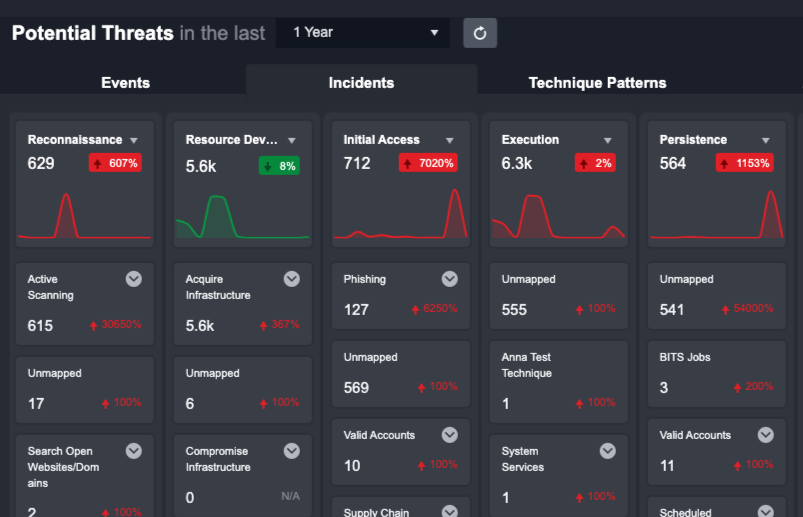
Clicking on a specific Tactic or Technique from this view will reveal a list of all underlying Incidents. You can select an Incident to investigate from this list.
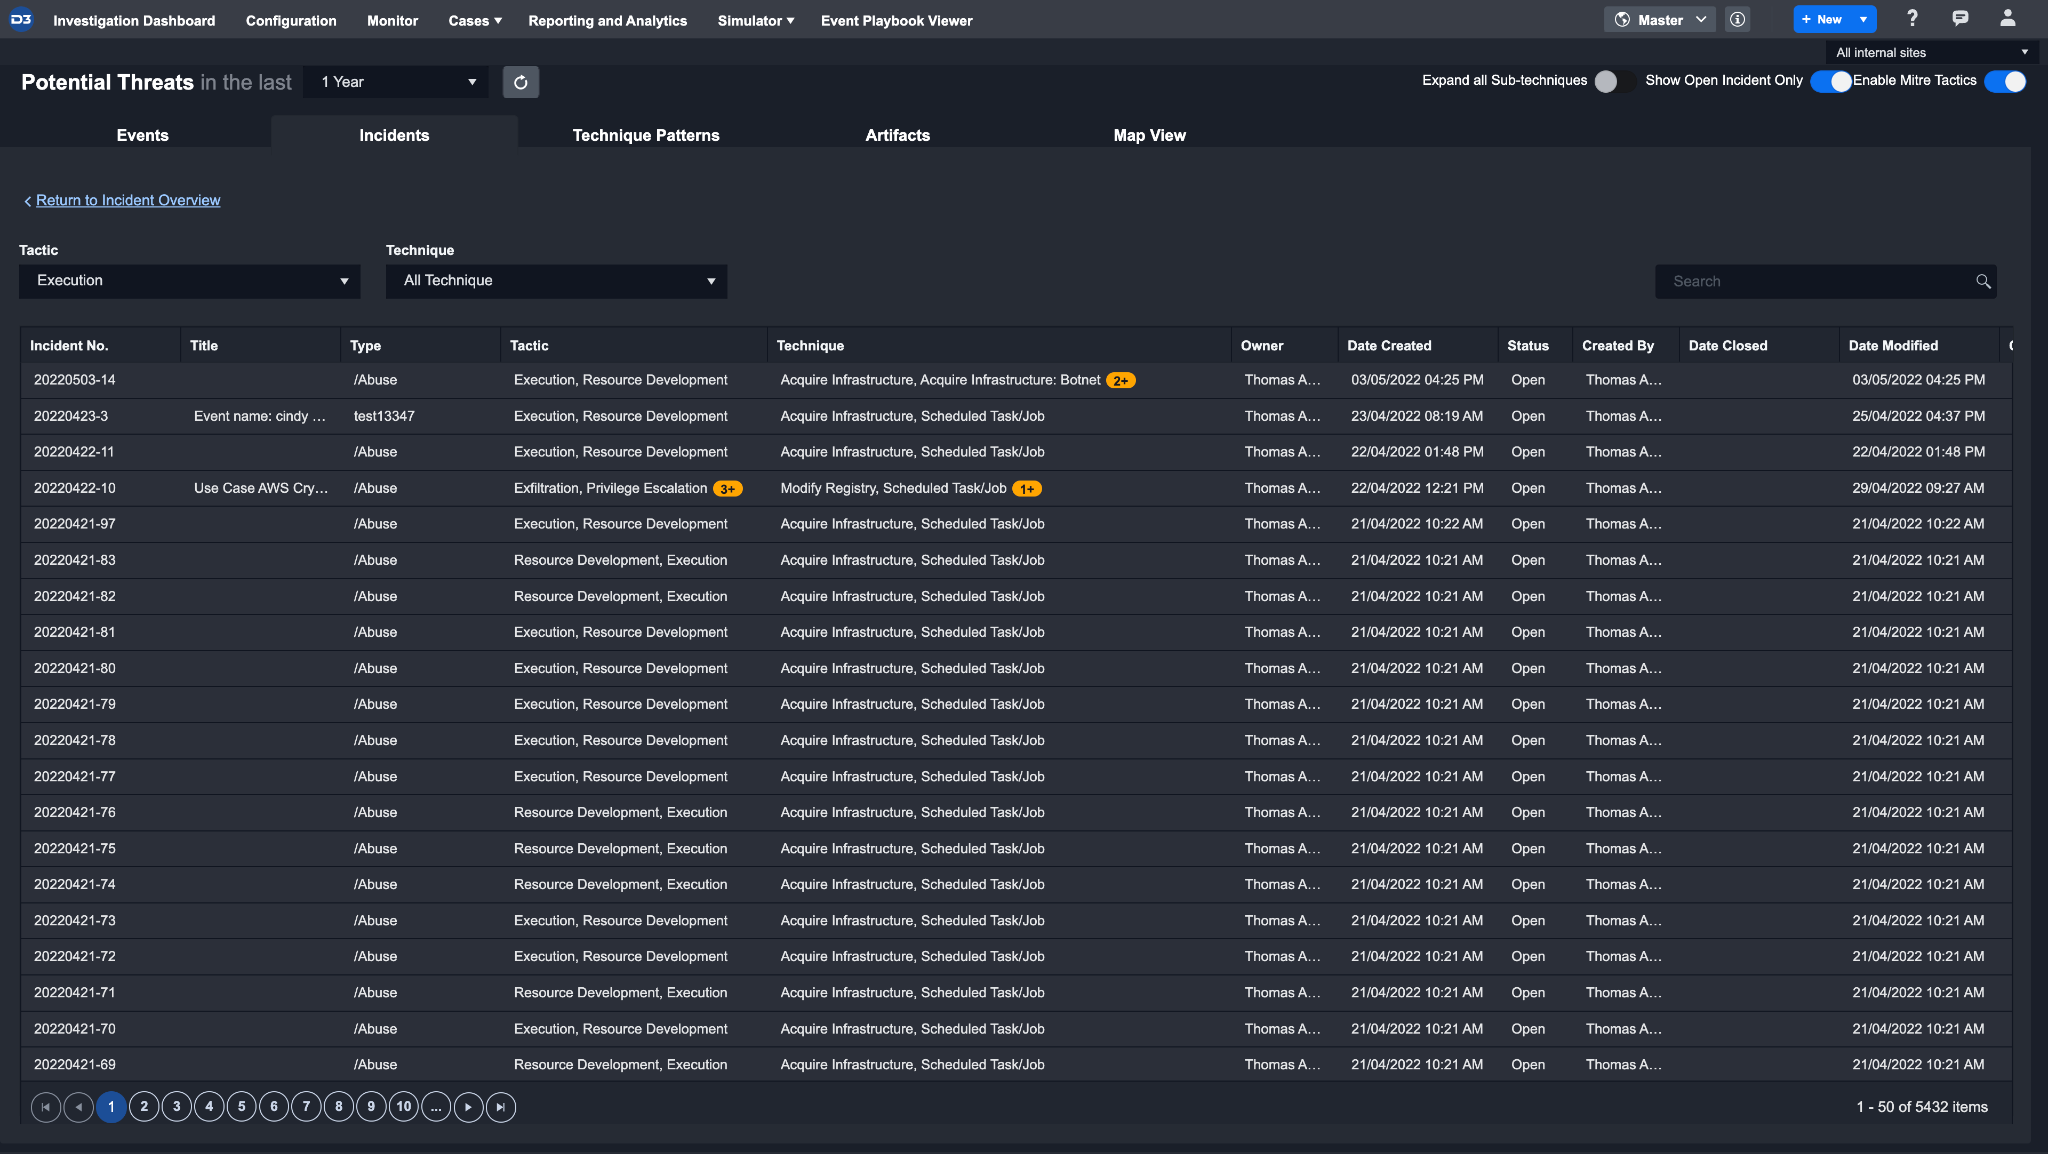
Investigating an Incident
Selecting an Incident from the list will bring you to the Incident Workspace. The Incident Workspace has been designed to provide all the tools needed to respond to an Incident in one place.
For more information on this workspace, refer to Incident Workspace.
Technique Patterns
The Technique Patterns tab groups events based on the specific search criteria that were used to tag the event with the appropriate tactics and techniques. The condensed view can help you identify patterns and frequency of an attack immediately and effectively. Technique Patterns relevant to specific incidents can also be accessed in the Incident Workspace.
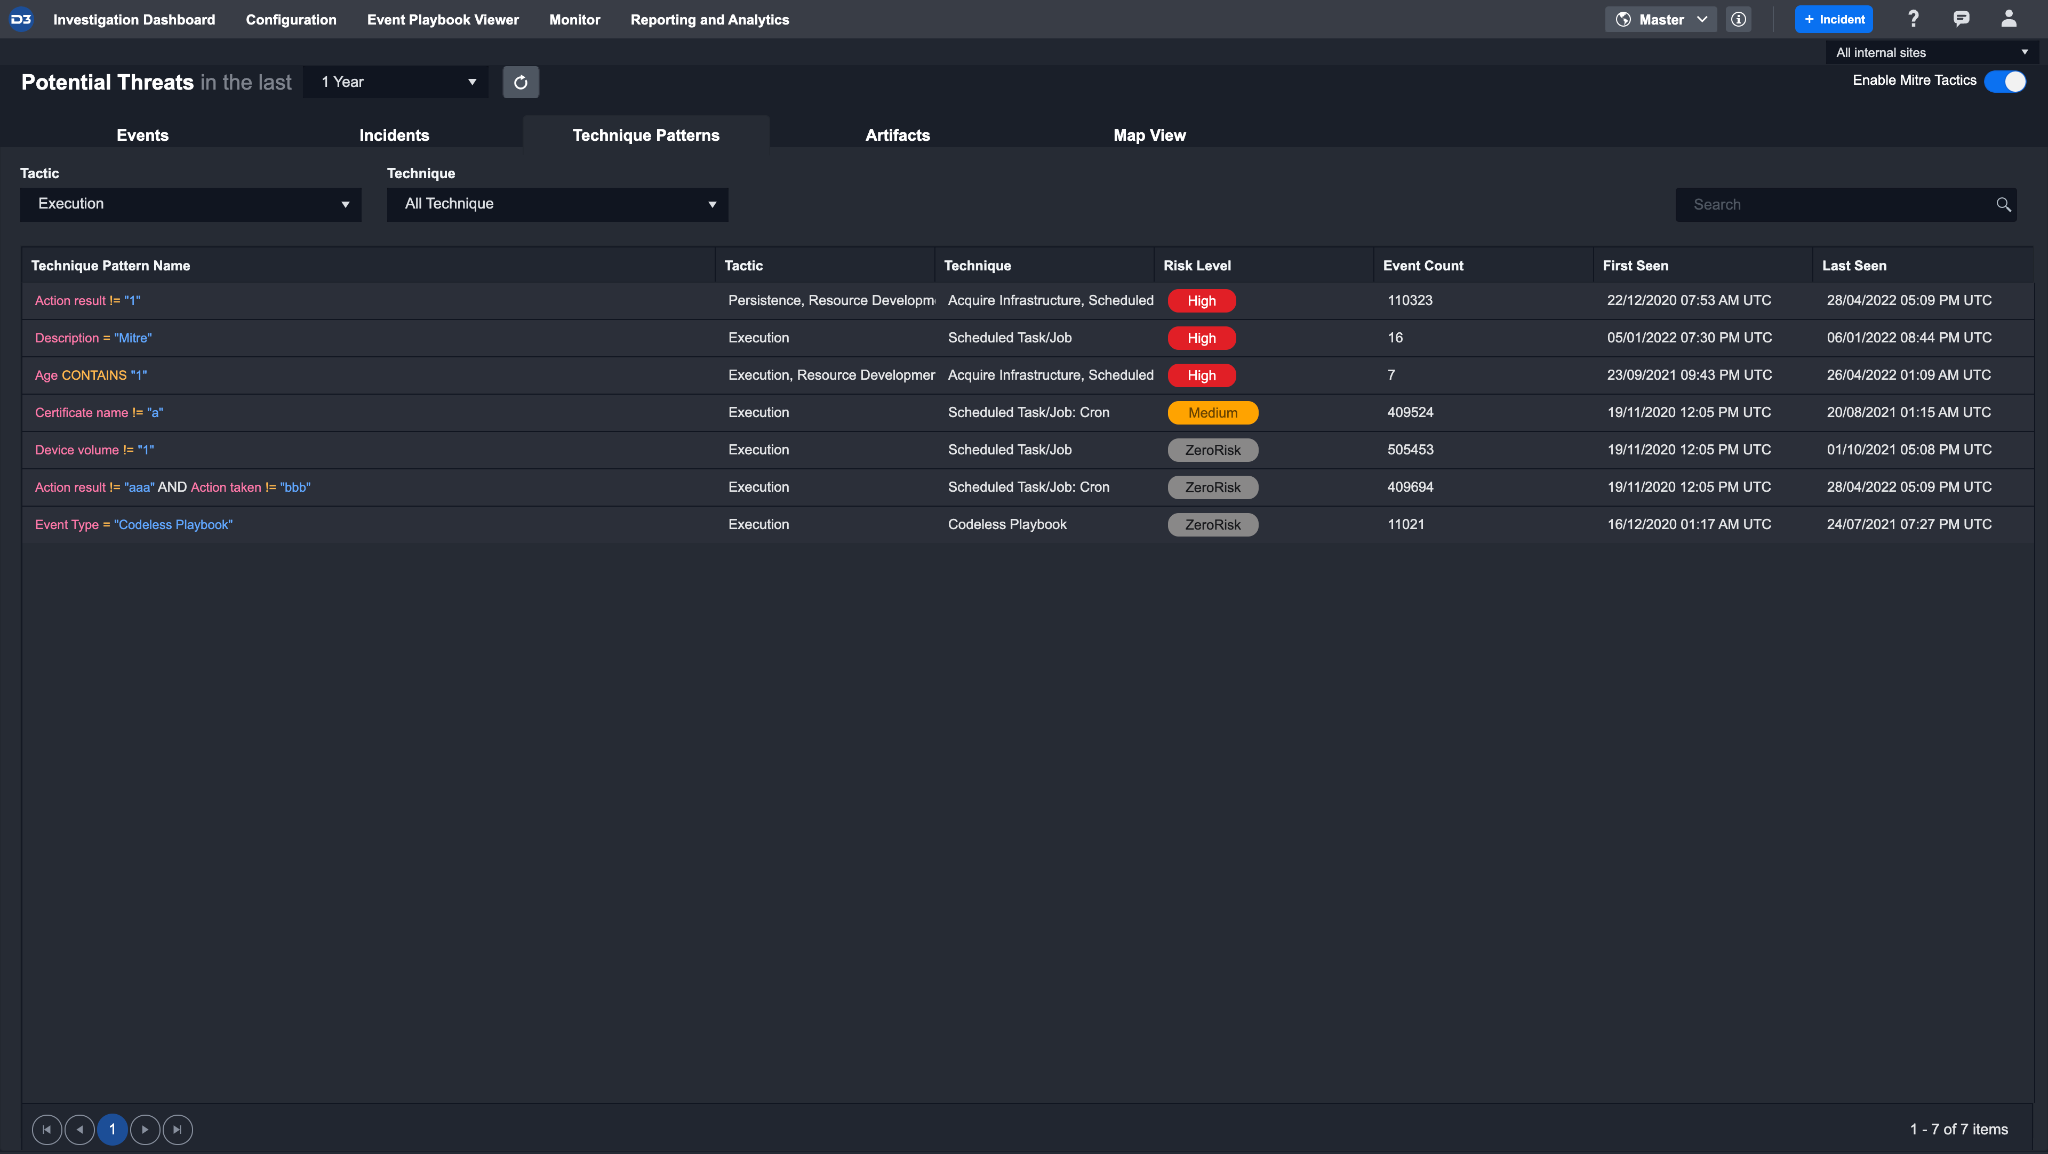
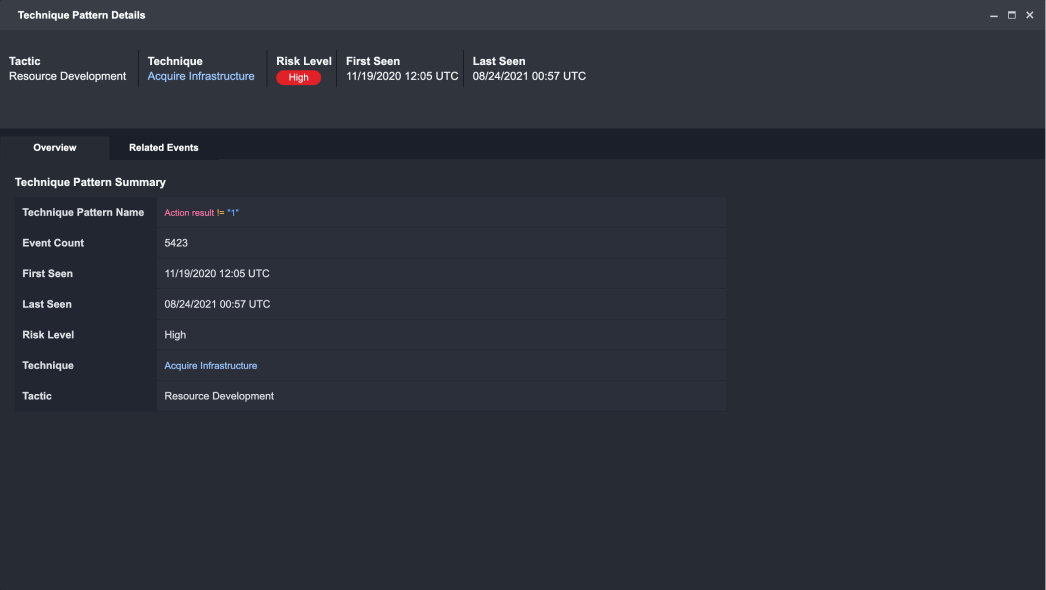
Technique Pattern Details
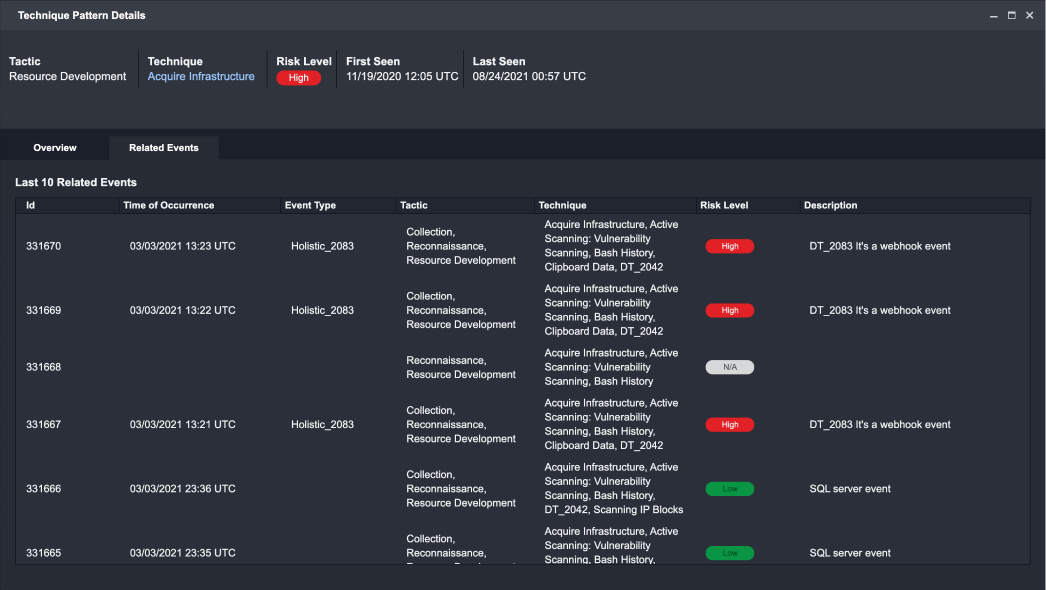
Clicking on a Technique Pattern from this list will open up the Technique Pattern Details window where you can view additional details about their selection and associated events. There are two key views availables for the Technique Pattern Details:
Overview: Provides you with all relevant information for the selected Technique Pattern.
Related Events: Provides a list of all instances where the selected Technique Pattern appears in an event. Clicking on an event will expand to an Events Details window.
Artifacts
The Artifacts tab shows all the artifacts that have been extracted for the events shown in the events tab. From this view, you can sort artifacts based on level of importance (i.e. a filter can be applied to identify high profile artifacts such as an important server). Artifacts relevant to specific incidents can be accessed in the Incident Workspace.
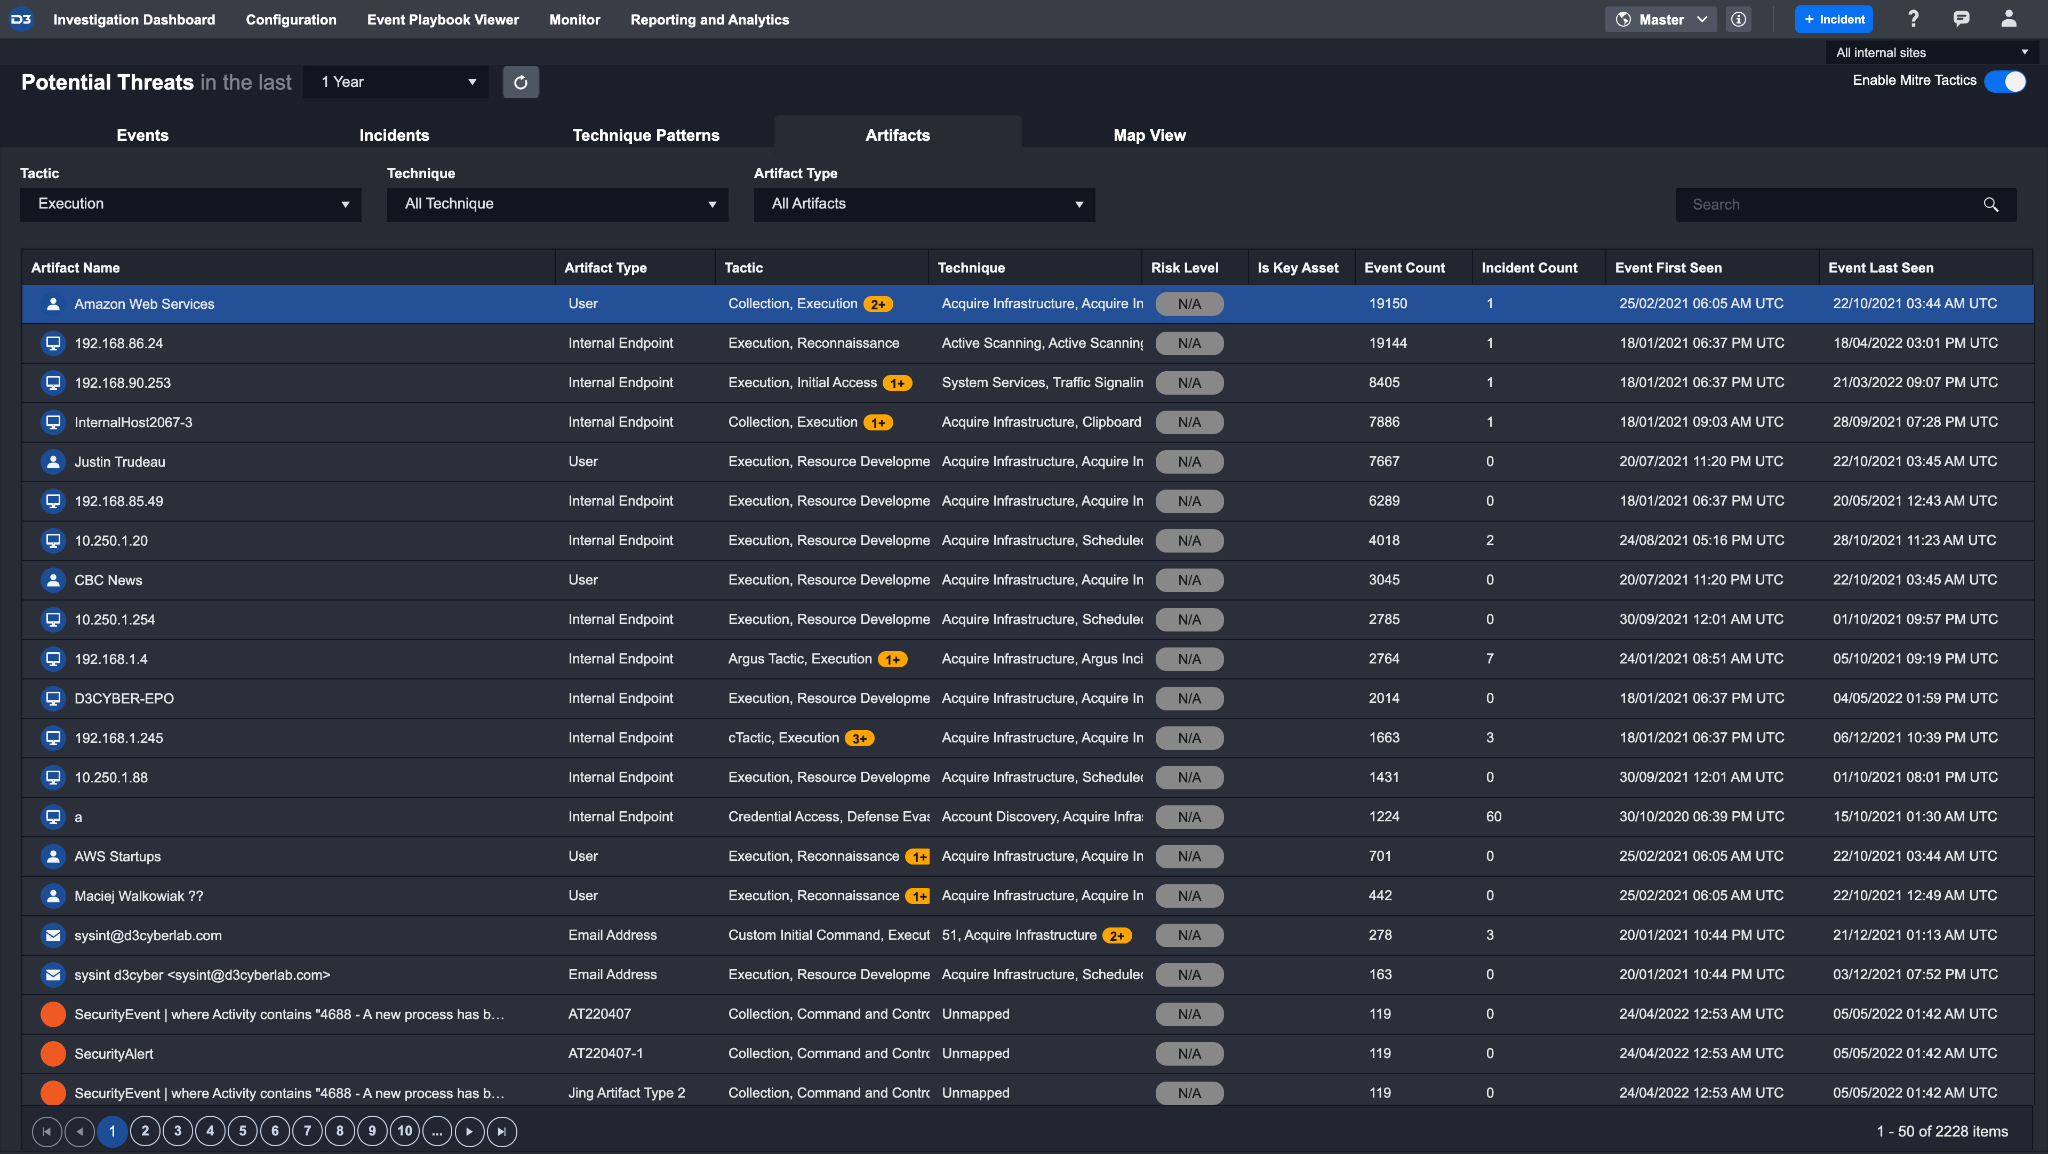
Viewing Artifact Details
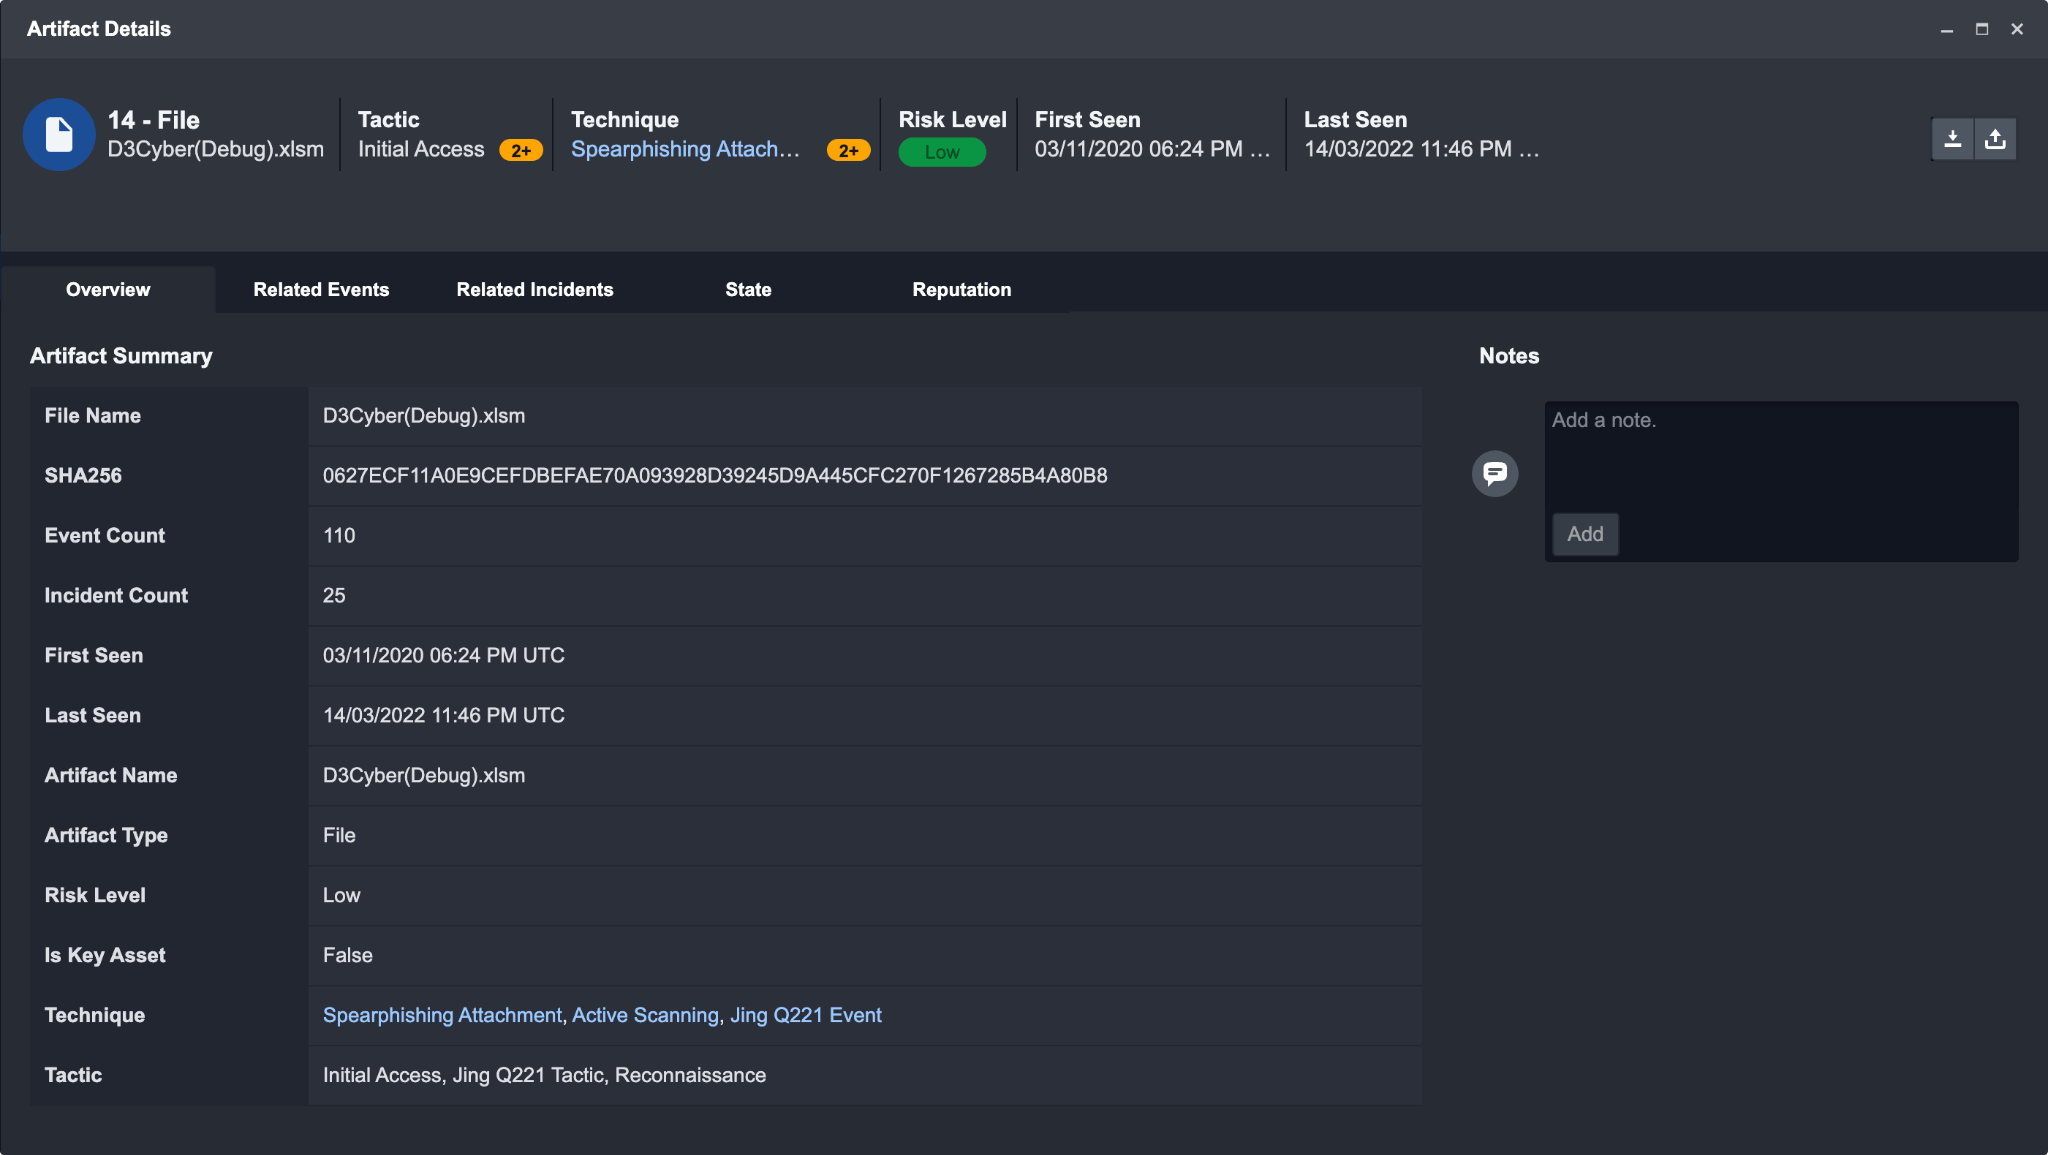
Clicking on an artifact from this list will open up the Artifact Details window where you can view additional details and associated events. There are 5 tabs within Artifact Details:
Overview: Displays all relevant information for the selected Artifact.
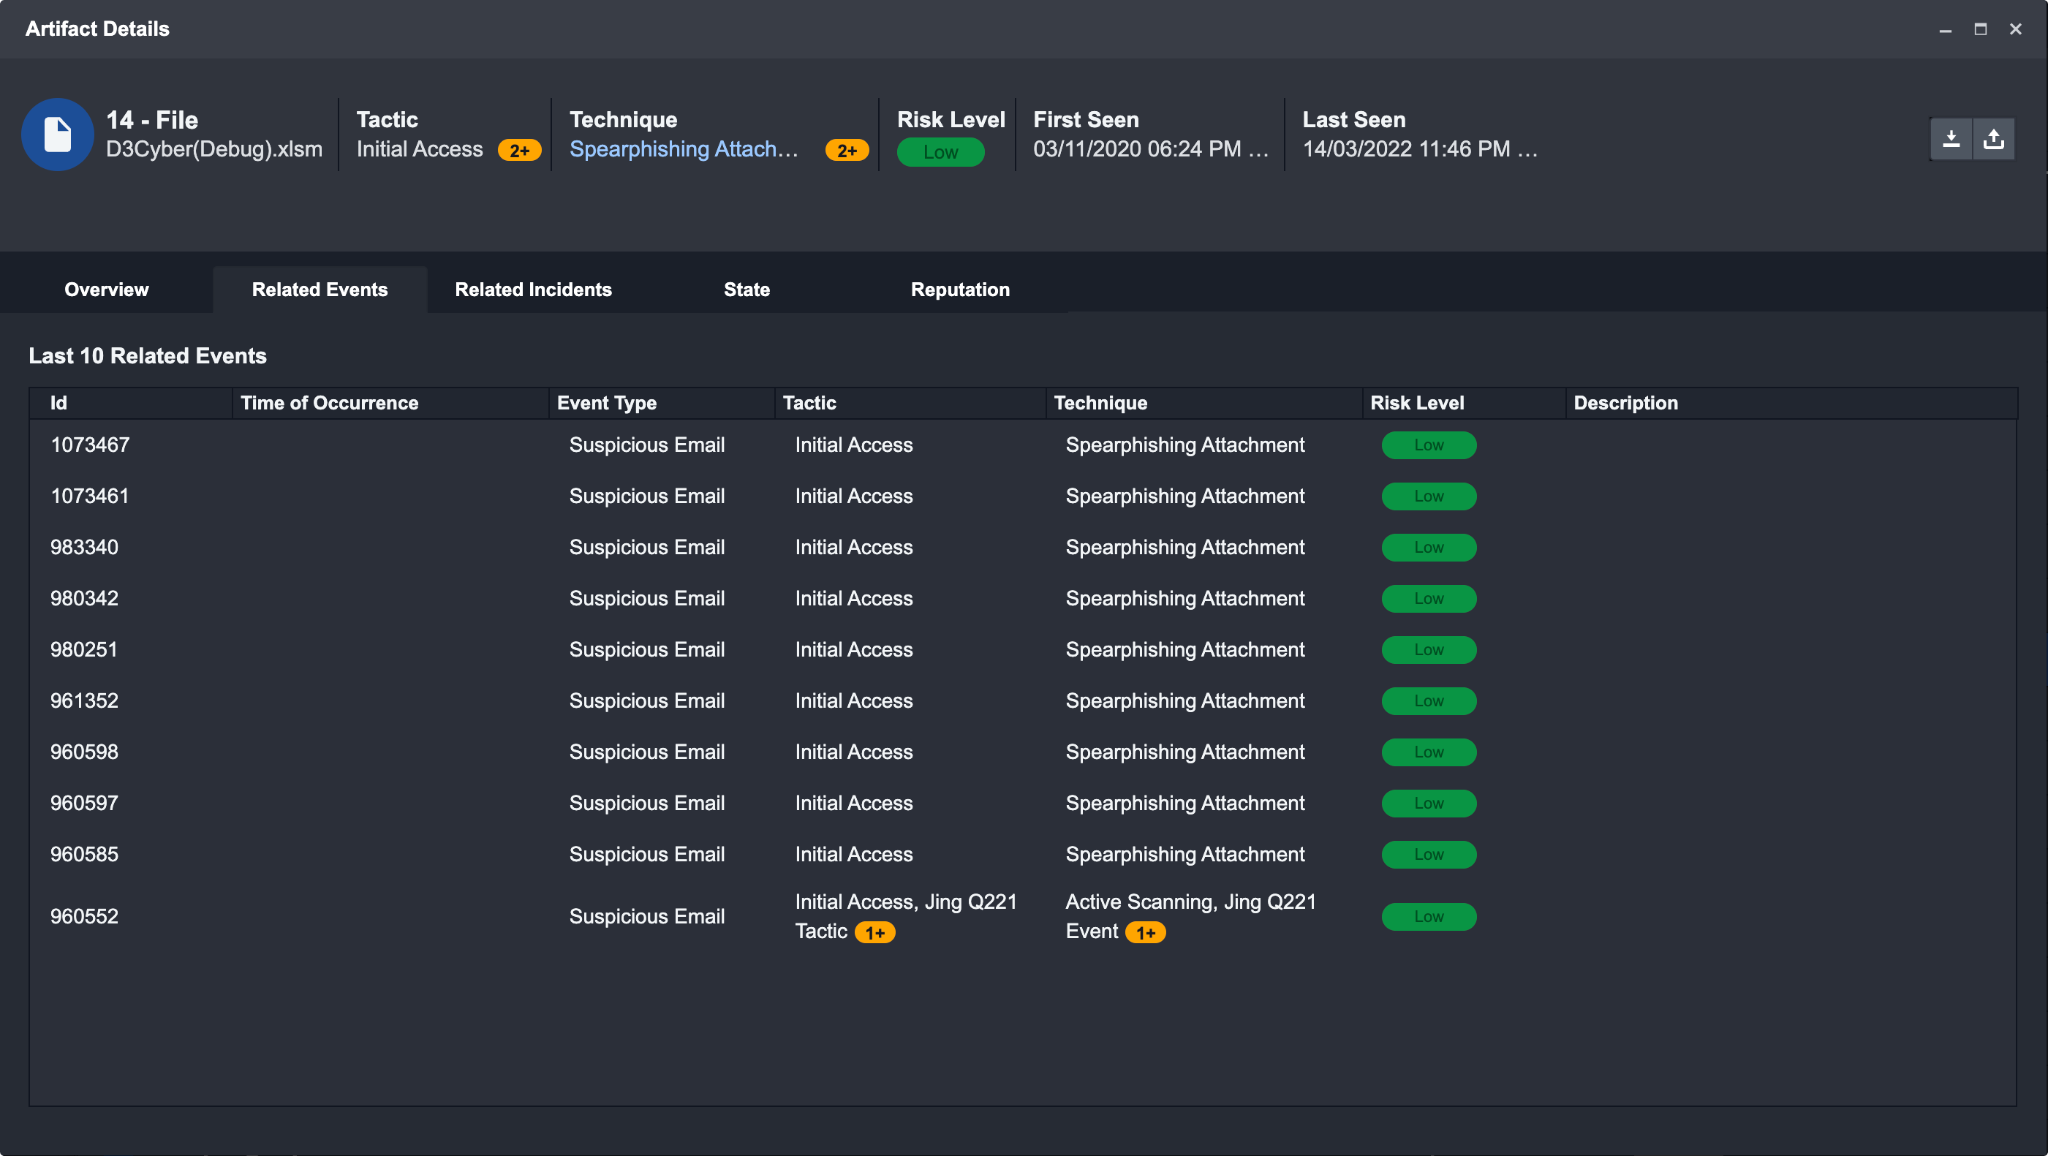
Related Events: Provides a list of all instances where the selected artifact appears in an event. Clicking on an event will open the Event Details window.
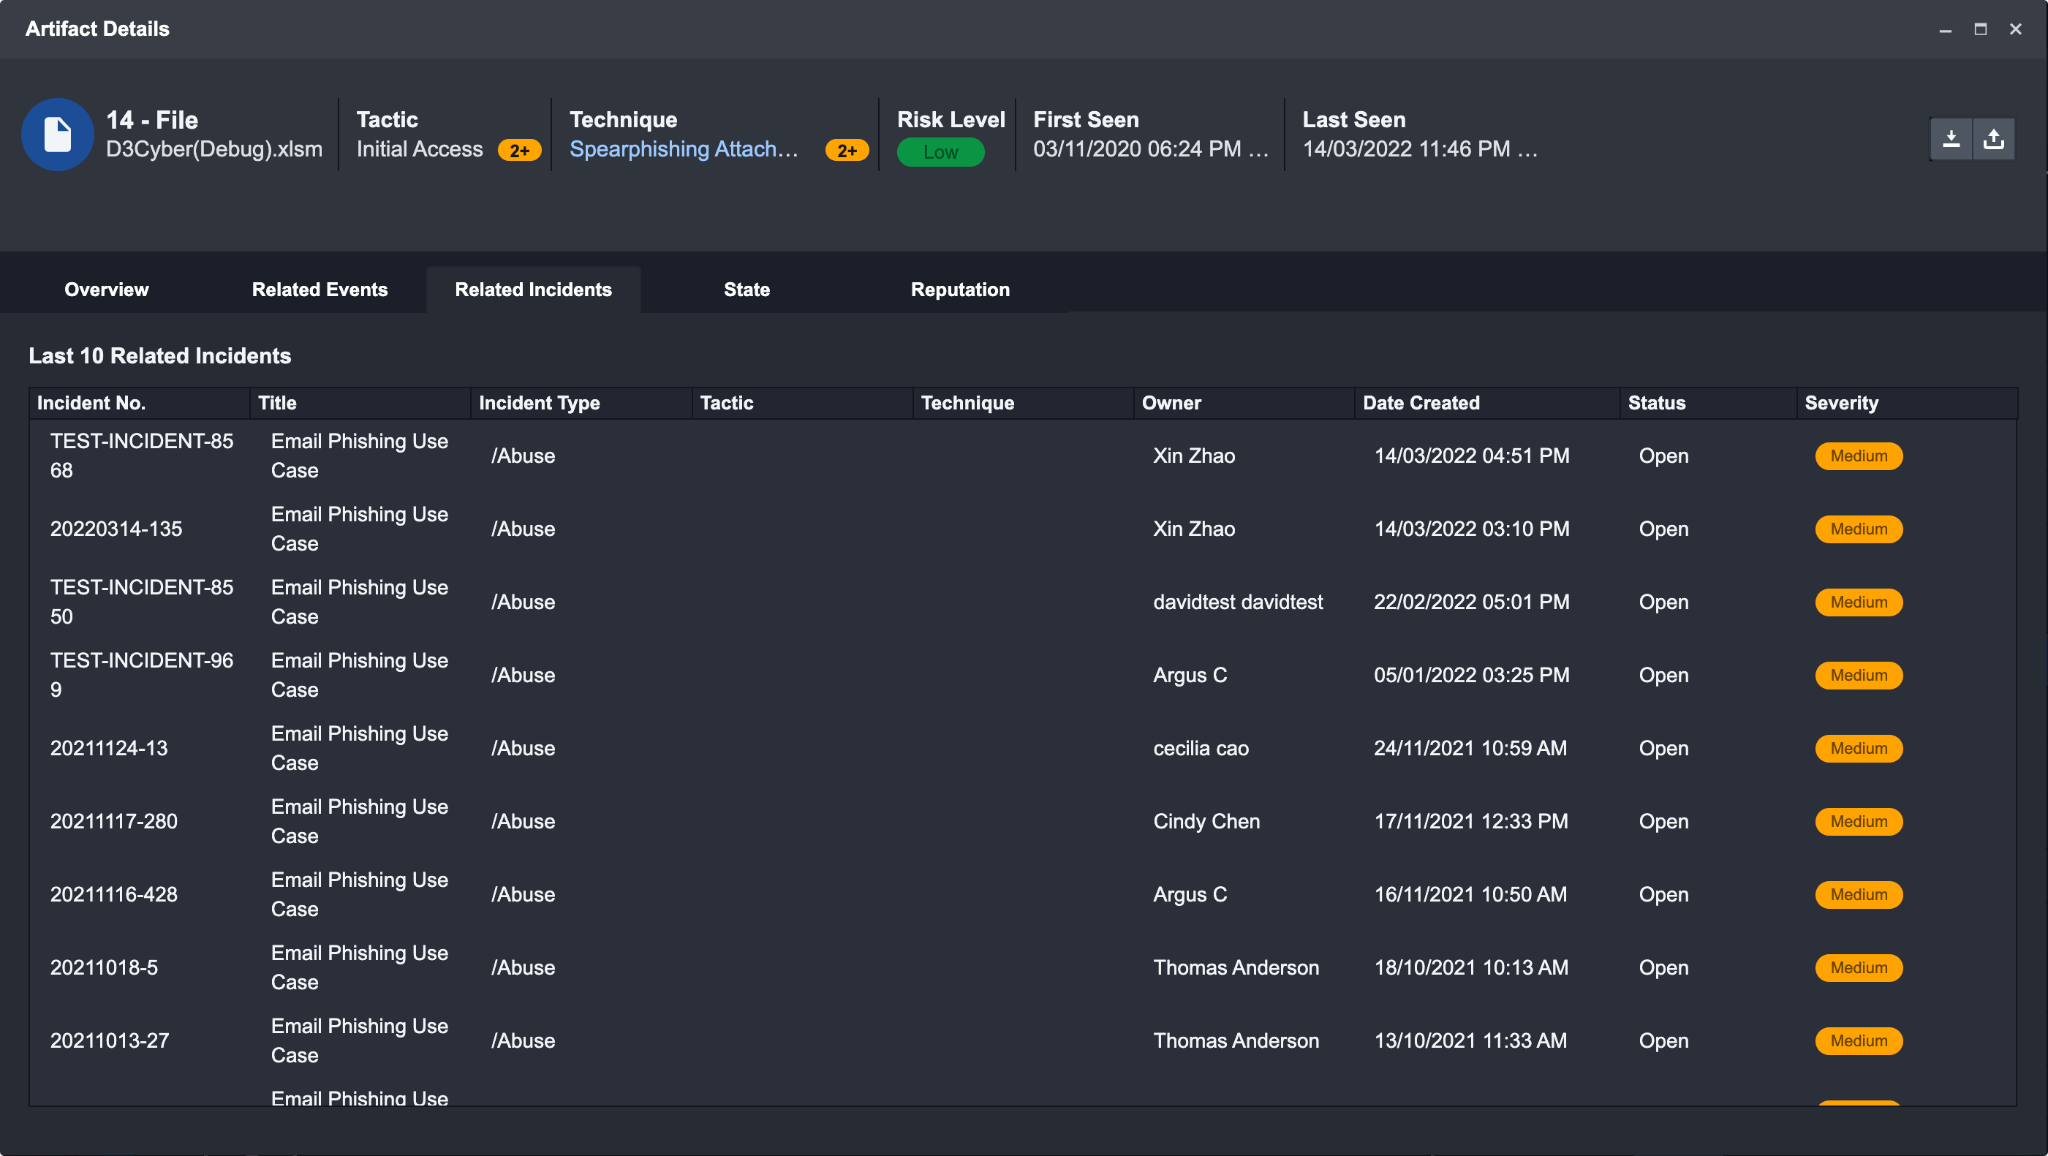
Related Incidents: Provides a list of all instances where the selected artifact appears in an incident. Clicking on an incident will open the related Incident Workspace.
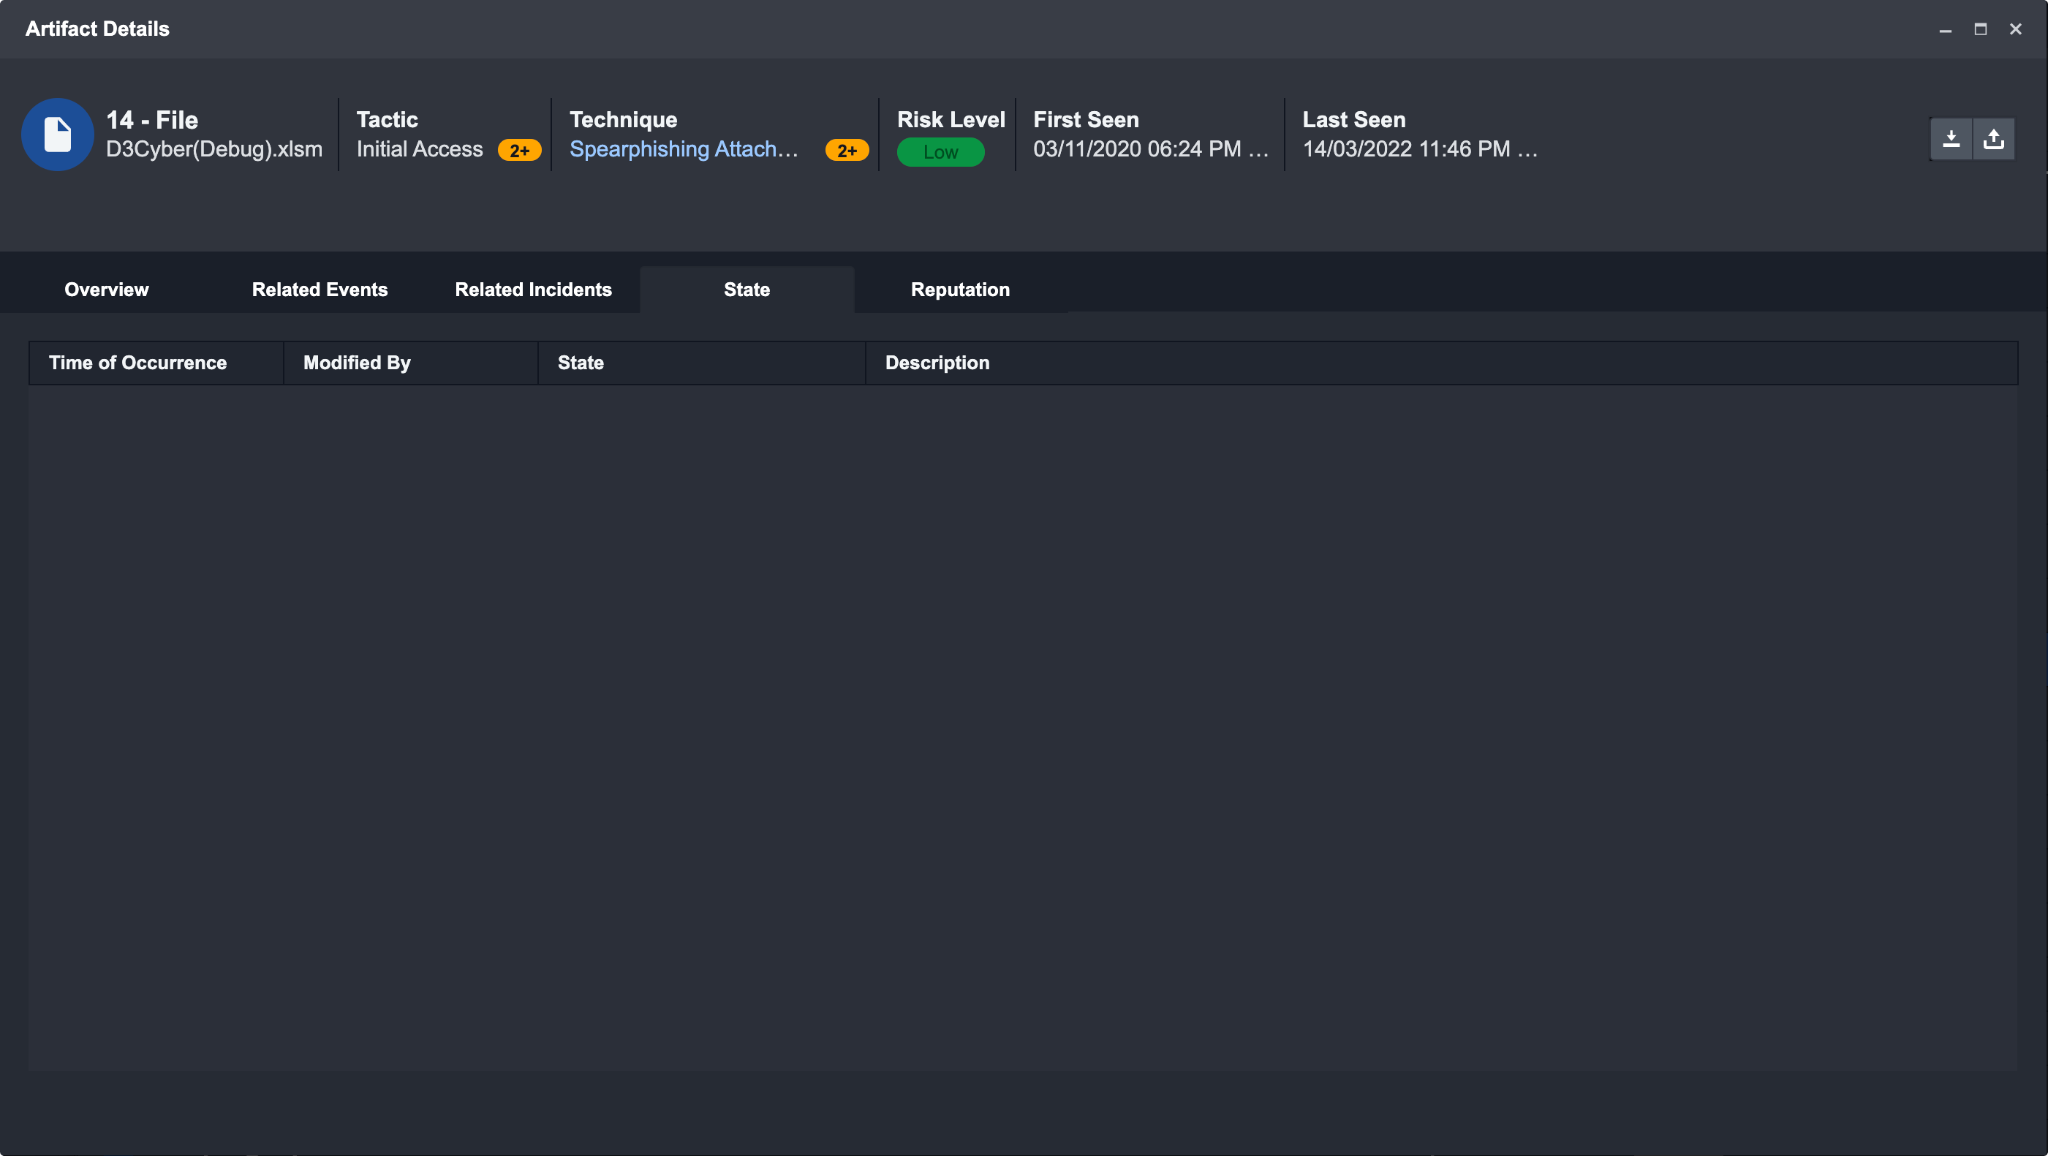
State: If the artifact has been updated or changed, the State will display a history of said changes.
Reputation: Provides a historical record of the reputation for the selected Artifact. This is useful to detect changes in an Artifact.
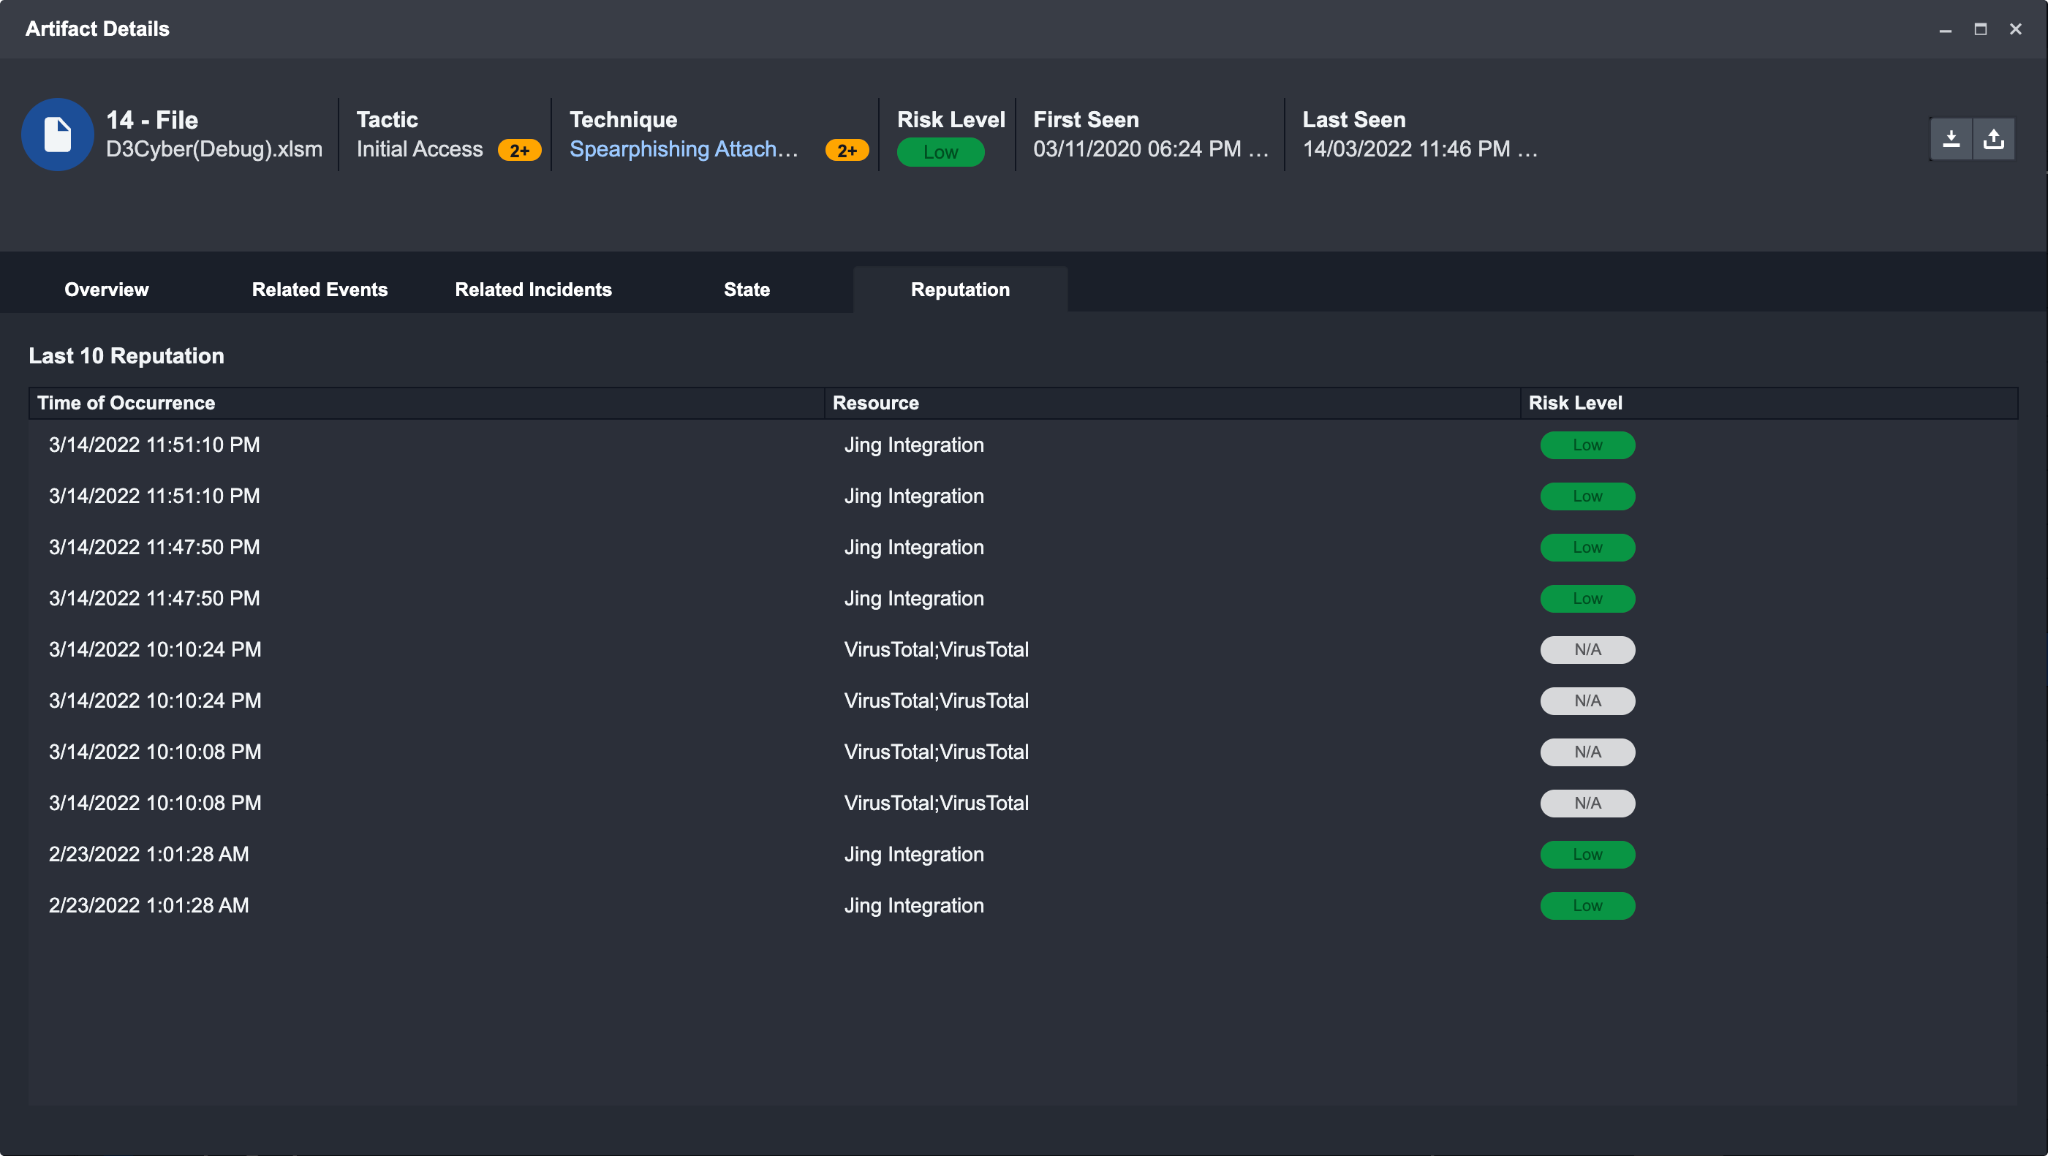
Artifacts can be exported in STIX 2.1 format, as a JSON file type. Use the share icon located at the top right corner of the artifacts detail window.
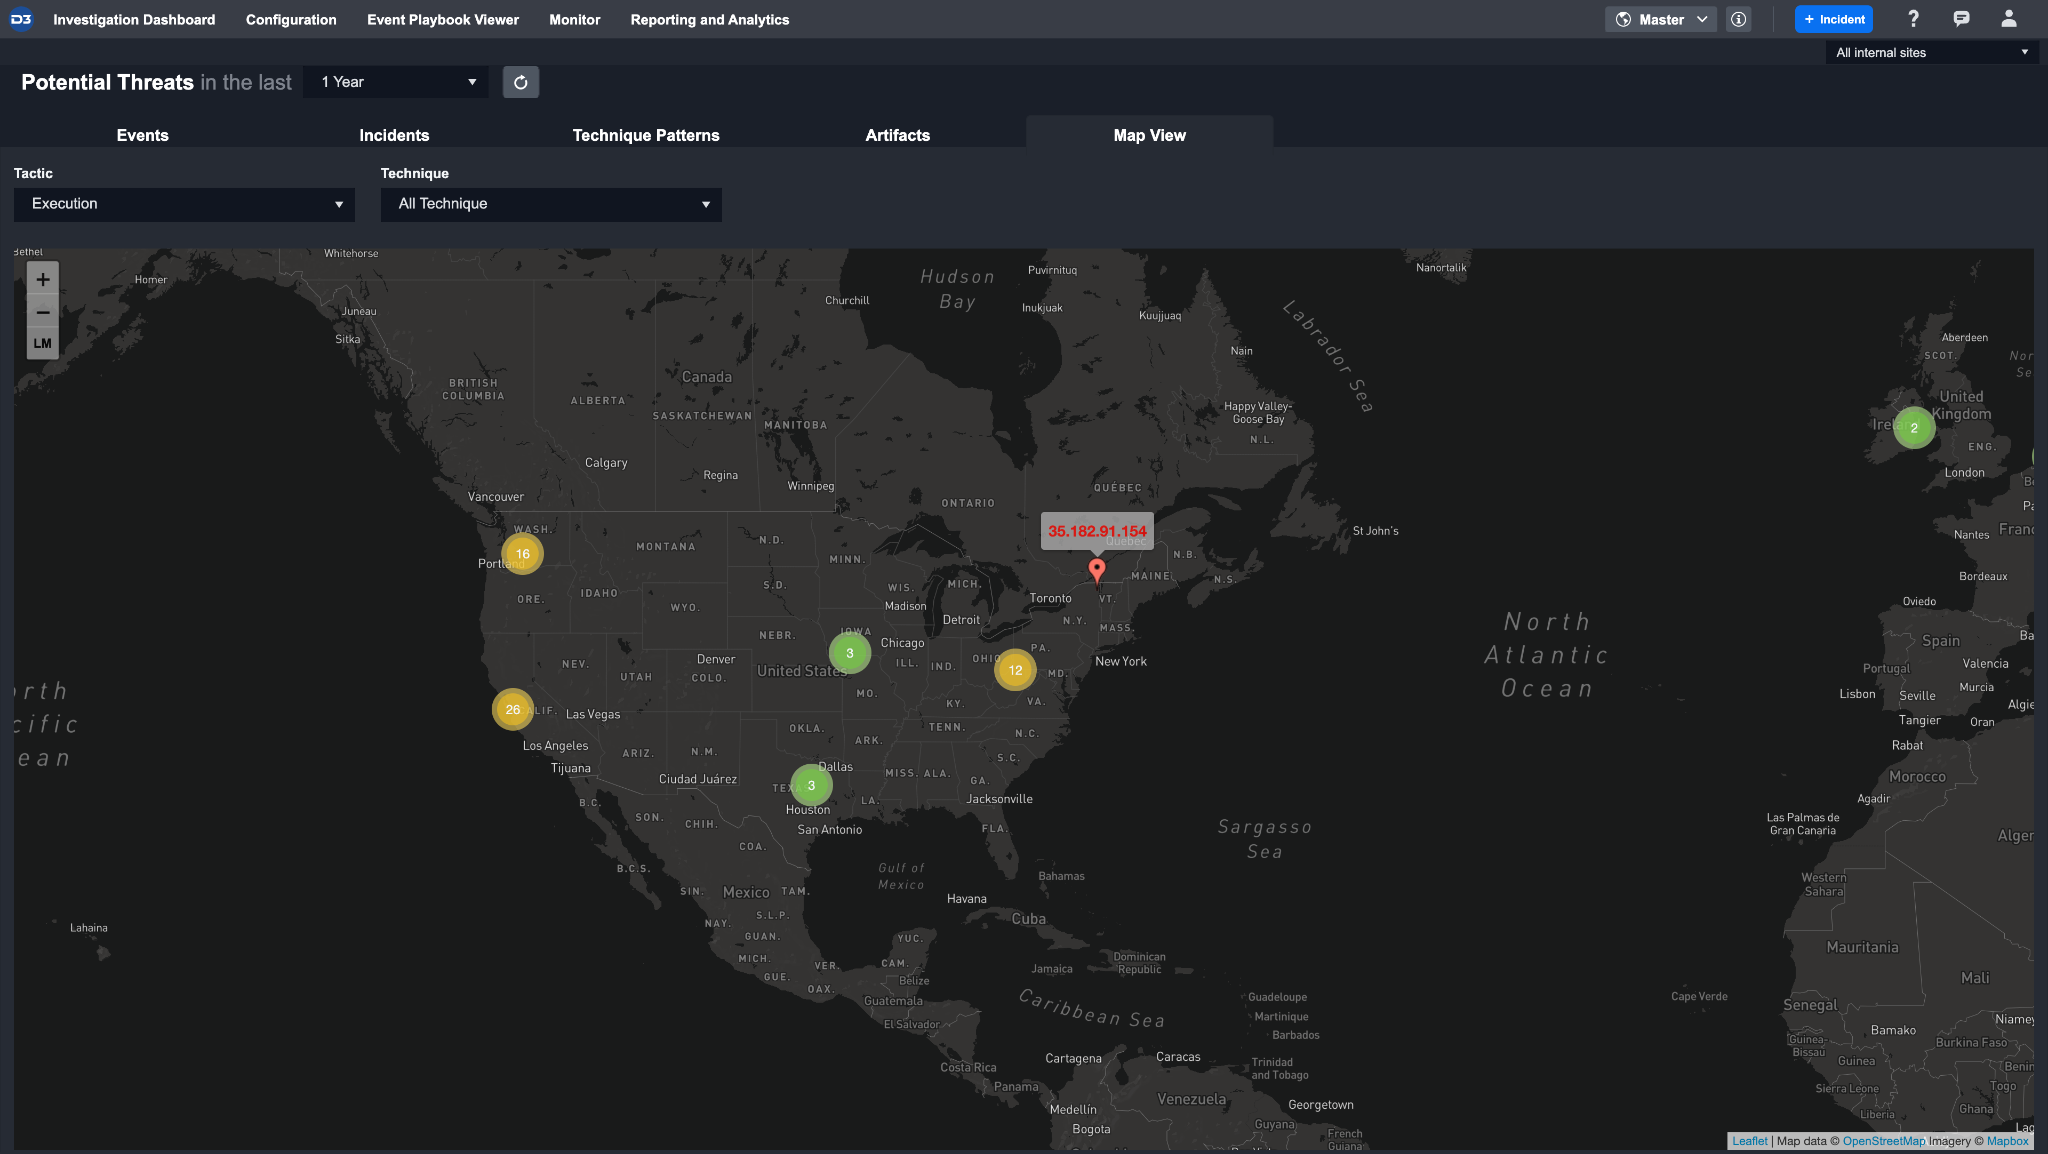
Map View
The Map View tab provides you with a visual representation of all surfaced and high-risk threats. This view allows you to draw connections between artifacts and potential adversarial groups geospatially.
The highlighted circles indicate a cluster of Events or Artifacts located in a central location. Colors change from green to yellow and red depending on the number of threats within a cluster. To view the locations at a more granular level, you can scroll your mouse or use the zoom buttons on the left hand side of the screen. Expanding a pin will open that specific Artifact or Event Details page.